7006 S Laurel Ave · Pharr, TX
Flood risk 4/10 · Minor
- FEMA flood zone
- X (shaded)
- Chance of flooding over 30 yrs
- 0.24%
- Est. flood insurance / yr
- $507 – $1,088
Fire risk 7/10 · Major
- Est. fire insurance / yr
- $1,222 – $2,270
Heat risk 9/10 · Severe
- Hot days now (above 111°F)
- 7 days/yr
- Hot days in 30 yrs
- 22 days/yr
Wind risk 8/10 · Major
- Chance of severe wind over 30 yrs
- 99.0%
Air-quality risk 1/10 · Minimal
- Unhealthy air days now
- 0 days/yr
- Unhealthy air days in 30 yrs
- 0 days/yr
Risk factors via First Street. Map © Google.
Why this score? — see what drove the B- grade
The composite is a weighted blend of 9 inputs, each scored 0–100. Each bar is that input's sub-score; the figure is the points it added to the 100-point composite (weight × sub-score).
- Cash flow +28.5/30.0
- 1% rule +10.0/10.0
- DSCR +10.0/10.0
- ARV discount +7.5/15.0
- Livability +3.6/5.0
- Condition / age +2.5/5.0
- Rent growth +2.4/5.0
- Schools +2.0/10.0
- Appreciation +0.0/10.0
$79,900
🖨 Deal sheet 📄 Offer letter ✓ Due diligence
Listing remarks
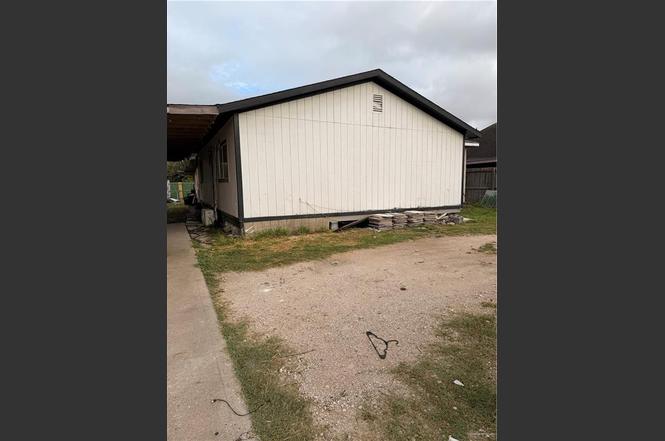
Investor opportunity in Pharr, Texas! This 3-bedroom, 1-bath home offers approximately 1,300 square feet of living space and is ready for a new owner with vision. Built in 2010, the property sits on a spacious lot and presents excellent potential for renovation, rental income, or resale. Conveniently located near schools, shopping, restaurants, and major thoroughfares, this property provides easy access to everyday amenities. With the right improvements, this home can be transformed into a valuable investment or comfortable residence. Property is being sold as-is.
Key facts
- Spacious lot
- 6,381 sq ft lot
- 2 parking spots
Tags
Property features AI
Finance
- Other: Lot area approximately 6,382 square feet (0.1465 acres)
- HOA & community: No homeowners association; Community curbs
Exterior
- Parking: 2 total parking spaces; 2 covered/carport spaces; No garage
- Utilities: City sewer; Public water; Wall cooling unit(s)
- Home design: Not new construction; Living area source: county appraisal (HidalgoCAD)
- Construction: Wood siding construction; Pillar/post/pier foundation; Total building area about 1,349
- Exterior features: Other exterior features; Chain link and other fencing; Composition shingle roof; Paved road access; Public water
Interior
- Kitchen: No conveying appliances; Water heater located in a separate/other location
- Flooring: Other
- Bathrooms: 2 full bathrooms
- Heating & cooling: Wall cooling unit(s)
- Interior features: Countertops: other; Window coverings: other; Other flooring
- Laundry & utility: Dedicated laundry area
Neighborhood map
What this means for you Summary
Snapshot
- This is a 3-bed/2.0-bath single-family listed at $80k.
Deal economics
- At list price, monthly cash flow is $260 ($3k/yr) — positive.
- The deal already cash-flows at list — no discount required.
- Meets the 1% rule at list price ($1k rent vs $80k).
- Cap rate 10.2% vs local median 3.4% in Pharr — top-decile yield for the area; either an underpriced asset or a hidden risk that comps aren't pricing in. Stress-test before assuming the spread holds.
Location & tenants
- Location reads 72/100 on livability (#245 in TX) — a middle-class / working-renter tenant base. Strengths: cost of living A+, housing A+, health & safety A+; Watch: amenities F, commute F, employment F.
- Pharr-San Juan-Alamo ISD (suburban): math 18% / reading 30% proficiency, ranked #740 of 826 in TX (top 90%) — low school quality limits family demand, transient renter base, plan for 1-2y turnover; 72% free/reduced lunch — lower-income household profile, screen leases tightly.
- Zoned schools: Cesar Chavez El (math 12% / reading 27%, grade F, #3,583 of 4,322 statewide, top 86%, 405 students, 100% FRL); Jaime Escalante Middle (math 6% / reading 21%, grade F, #1,602 of 1,662 statewide, top 97%, 566 students, 99% FRL); Psja Southwest Early College H S (math 18% / reading 37%, grade F, #1,183 of 1,632 statewide, top 73%, 1,692 students, 98% FRL) — zoned schools average 99% FRL vs 72% district-wide (27 pts higher); higher-poverty schools than district average — tighter screening recommended.
- Market conditions: Rents soft (-0.2%/yr); 451 active listings in the ZIP; 5 comparable units currently listed for rent nearby; rentals at typical pace (median 24d on market — plan ~3-4 weeks tenant-placement turnaround); 40% of comp listings sitting > 30 days — soft ceiling on asking rent; 7,378 units permitted in Hidalgo County in 2024 (641 in 5+ unit buildings).
Forward outlook
- Local home prices are declining (-3.0%/yr); year-one equity from $552 of loan paydown is wiped out by about $2k of value loss. Plan a longer hold.
- Hidalgo County population projected at +28% by 2050 — long-run rental-demand tailwind backs the buy-and-hold thesis.
Negotiation context
- Only 1 days on market — expect competitive offers; lowballing is unlikely to land.
Risks & watch-outs
- Watch-outs: property tax is 4.6% of price.
- Climate carrying-cost: severe wind risk, 99% chance of damaging wind over 30y; major wildfire risk; extreme-heat days projected 7→22/yr by 2055 (HVAC capex compounding) — expect insurance premiums to compound above CPI over the hold.
Questions for the listing agent
- Property tax is high relative to price — has the assessment been appealed recently, and will the sale trigger a re-assessment?
- Is there a deadline driving the sale (1031 exchange, divorce, estate, relocation)? That informs how much negotiation room exists.
- Schools are D-rated, which usually means shorter tenancies and higher turnover. Who's the typical renter profile here, and what's been the actual vacancy rate?
- What's the average days-on-market for RENTAL listings here right now (not sales)? A rising rental-DOM trend means longer vacancies and softer asking-rent achievability than the comps imply.
- What's the recent tenant-quality profile in this submarket — average credit score on applications, eviction rate, late-payment / NSF rate, and stable-employment percentage? A property-management company in the area should have these aggregated.
- How much new for-sale + rental construction is in the pipeline within 1–3 miles? Heavy new supply typically softens prices + rents 12–24 months out; constrained supply supports both.
Investment metrics
- 1% rule
- 1.61% ✓
- Cap rate
- 10.20%
- Cash-on-cash
- 13.95%
- DSCR
- 1.62
- GRM
- 5.2
CMA / ARV
- ARV (on-the-fly)
- $175,370
- Comps found
- 12
Show comp detail 12 sales within ~0.75 mi
| Address | Dist | Beds/Ba | Sqft | Sold | Price | $/sf | Match |
|---|---|---|---|---|---|---|---|
| 7109 S San Marcos St | 0.09mi | 3/2.0 | 1,329 (-2%) | 1mo | $195,000 | $147 | 92 |
| 321 Greg Dr | 0.47mi | 3/2.0 | 1,368 (+1%) | 3mo | $155,000 | $113 | 73 |
| 412 E Nannette Ave | 0.43mi | 3/2.0 | 1,314 (-3%) | 12mo | $220,000 | $167 | 66 |
| 7221 S San Joaquin St | 0.24mi | 3/1.0 | 1,200 (-11%) | 4mo | $105,000 | $88 | 64 |
| 408 E Darlene Dr | 0.47mi | 3/2.0 | 1,260 (-7%) | 7mo | $140,000 | $111 | 61 |
| 309 Universal Ave | 0.50mi | 3/2.0 | 1,258 (-7%) | 7mo | $130,000 | $103 | 60 |
| 247 E Saint John Dr | 0.63mi | 3/2.0 | 1,319 (-2%) | 10mo | $194,900 | $148 | 58 |
| 7008 Venus Ln | 0.64mi | 4/2.0 (+1) | 1,418 (+5%) | 6mo | $185,000 | $130 | 52 |
| 316 E Ricky Ave | 0.50mi | 3/2.0 | 1,505 (+12%) | 7mo | $209,000 | $139 | 52 |
| 6402 S Mars Ln | 0.73mi | 3/2.0 | 1,250 (-7%) | 3mo | $159,700 | $128 | 51 |
| 6502 S Galaxy Dr | 0.66mi | 3/2.0 | 1,455 (+8%) | 9mo | $162,900 | $112 | 49 |
| 7100 E Comet Dr | 0.71mi | 4/2.0 (+1) | 1,260 (-7%) | 3mo | $164,000 | $130 | 48 |
Match score weights: distance 35% · size 25% · config 20% · recency 20%. Top-matched comps best support the ARV.
Projected returns pro-forma
-3.0% appreciation · 0.0% rent growth · sell at horizon
- IRR
- -0.0%
- Equity multiple
- 1.00×
- Total profit
- $-9
- Equity at exit
- $11,913
- IRR
- 5.3%
- Equity multiple
- 1.33×
- Total profit
- $7,322
- Equity at exit
- $6,908
Cash invested: $22,372 (down + closing). Projections, not guarantees.
Landlord ↔ Tenant lean methodology
- Overall (STATE)
- 87 Strongly Landlord-Friendly
- State Texas
- 87 Strongly Landlord-Friendly · R+5
- County
- — inherits STATE
- City
- — inherits STATE
ZIP-level market 78577
- Home prices YoY
- -8.1%
- Rents YoY
- -0.2%
- Active inventory
- 451
- Price-to-rent
- 5.2×
Monthly cashflow live
- Estimated rent
- $1,289 high interval (Pro) →
- Mortgage (P&I)
- −$419
- Tax from tax record
- −$306 /mo · $3,670/yr
- Insurance
- −$33
- HOA
- −$0
- Vacancy / Maint / Mgmt
- −$271
- Net cashflow
- $260
Break-even live
UW: 25.0% down · 7.5% · 30yr · 1.5% tax · 5.0% vac · 8.0% maint · 8.0% mgmt
Financing live
Cash to close
- Down payment
- $19,975
- Closing costs
- $2,397
- Reserves months
- —
- Total cash needed
- —
Loan-product check · same deal, 3 products live
Conventional
25% down · 7.5% · 30yr
- Down + closing
- —
- Monthly P&I
- —
- Monthly cashflow
- —
- DSCR
- —
- Eligible?
- —
Personal DTI + credit; lowest rate.
DSCR
20% down · 8.5% · 30yr
- Down + closing
- —
- Monthly P&I
- —
- Monthly cashflow
- —
- DSCR
- —
- Eligible?
- —
No personal income docs; deal must DSCR.
Hard money
10% down · 12.0% · 12mo
- Down + closing
- —
- Monthly P&I
- —
- Monthly cashflow
- —
- DSCR
- —
- Eligible?
- —
Short-term bridge; refi at stabilization.
Rent comps 5 comps
| Address | Beds | Baths | Sqft | Rent | $/sqft | DOM | Units | Dist |
|---|---|---|---|---|---|---|---|---|
| 715 E Rusty Dr Pharr, TX | 3.0 | 1.0 | 1178 | $1,100 | $0.93 | 44d | 1 | 0.20mi |
| 901 E Thomas Dr Pharr, TX | 3.0 | 2.0 | 1100 | $1,295 | $1.18 | 23d | 1 | 0.37mi |
| 901 E Thomas Dr Pharr, TX | 2.0 | 2.0 | 900 | $998 | $1.11 | 21d | 1 | 0.37mi |
| 321 E Greg Dr Pharr, TX | 3.0 | 2.0 | 1368 | $1,500 | $1.10 | 44d | 1 | 0.49mi |
| 6703 S Oro Ln Pharr, TX | 4.0 | 2.5 | 1786 | $1,700 | $0.95 | 14d | 1 | 1.42mi |
Listing history 2 events
-
2026-06-17remarks 570-char remark
-
2026-06-17$79,900 Active 1 DOM
ⓘ Source: listings_history table (triggers on properties + properties_extension) + one-shot
backfill from property_details.listing_events for pre-trigger history.
Tax reassessment forecast TX · Resets to sale price
- Current annual tax
- $3,670 · $306/mo
- Projected year-2 tax
- $3,670 · $306/mo
- Expected delta
- $0/yr ($0/mo · 0.0%)
ⓘ Screening estimate from a state-policy table — verify with the county assessor before closing.
Climate risk First Street
- Flood 4/10 Moderate FEMA zone X (shaded) · 24% chance over 30 yrs
- Wildfire 7/10 Severe
- Heat 9/10 Extreme 7 d/yr ≥111°F today · 22 d/yr by 30 yrs out
- Wind 8/10 Severe 99% chance of damaging wind over 30 yrs
- Air quality 1/10 Low 0 unhealthy d/yr today · 0 by 30 yrs out
Nearby sold comps map
Loading sold comps map…
Walkable amenities ~0.75 mi
Loading nearby amenities…
Taxation est. · year 1
- Rental income
- $15,468
- − Mortgage interest
- −$4,476
- − Property taxes
- −$3,670
- − Insurance
- −$400
- − Repairs & maintenance
- −$1,237
- − Management
- −$1,237
- − Depreciation
- −$2,324
- Taxable income
- $2,123
- Est. tax owed @ 24.0%
- −$510
- After-tax cash flow
- $2,612/yr
For passive investors: Depreciation is non-cash, so a rental often shows a tax loss while cash-flowing — sheltering income. Rental losses are passive: they offset passive income freely, and up to $25,000/yr can offset ordinary (W-2) income if you actively participate and your MAGI is under $100k (phasing out to $0 by $150k); unused losses carry forward. On sale, claimed depreciation is recaptured at up to 25%, and gains may owe capital-gains tax (a 1031 exchange can defer both). Figures are a year-1 estimate at your 24.0% rate — not tax advice; consult a CPA.
Schools (NCES district)
- District
- Pharr-San Juan-Alamo ISD
- NCES district ID
- 4834860
- Math proficiency
- 18% ▼ -34.00%
- Reading proficiency
- 30% ▼ -11.00%
- Median HH income
- $33,757
- Composite
- 19.63/100
- National rank
- #8744
- State rank
- #740 of 826 in TX
Livability — Pharr
- Score
- 72/100
- State rank
- #245
- US rank
- #5852
Category grades
Schools grade is shown separately in the Schools card above.
Census & demographics
- Census place
- Pharr, TX
- County
- Hidalgo County · 623,128 people
- City population
- 80,540
- Metro
- McAllen-Edinburg-Mission, TX
- Population (ZIP)
- 80,540
- Household income
- $52,770
- Rent vs Own
- Severe rent burden
- 2161.0
Population outlook (Hidalgo County) Hauer SSP2
- Today (2025)
- 955,232 people
- By 2030
- 1,009,774 · +5.7%
- By 2040
- 1,120,332 · +17.3%
- By 2050
- 1,225,036 · +28.2%
- By 2075
- 1,439,189 · +50.7%
- By 2100
- 1,533,429 · +60.5%
Race, ethnicity, and origin ACS 2023
- Neighborhood character
- Predominantly Hispanic (95%)
- Race & ethnicity
- Hispanic / Latino 95% Two or more races 45% White 5%
- Hispanic origin (detail)
- Mexican 92%
- Foreign-born
- 29% · Canada
- Languages at home
- 18% English-only · Spanish 81%
Political lean MEDSL · Hidalgo
- 2024 margin
- Toss-up / Even · D 48.1% · R 51.0%
- 2008→2024 swing
- -41.6pp toward R · 2008: 38.7pp · 2024: -2.9pp
- All cycles
- 2024: R+2.9 2020: D+17.1 2016: D+40.5 2012: D+41.8 2008: D+38.7
Not yet ingested
- Civics
- —
Market trends
- HPI YoY
- ▼ -23.00%
- Current HPI
- 261.1606
- Rent YoY
- ▼ -0.24%
- Metro
- McAllen-Edinburg-Mission, TX
- State GDP YoY
- ▲ 3.95%
- F500 in state
- 110
Industry mix (Fortune 500 HQ in TX)
| Industry | F500 HQs | Revenue |
|---|---|---|
| Energy | 16 | $1,198B |
|
||
| Technology | 5 | $198B |
|
||
| Engineering / Construction | 4 | $72B |
|
||
| Energy Services | 3 | $60B |
|
||
| Utilities | 3 | $41B |
|
||
| Healthcare | 2 | $330B |
|
||
Price history
4 events — show timeline
- 2026-06-17 Listed $79,900 MCALLENMLS
- 2014-08-06 Sold (Public Records) — Public Records
- 2005-09-06 Sold (Public Records) — Public Records
- 2005-04-21 Sold (Public Records) — Public Records
Property tax history
+18.8%/yrLatest (2025): $3,670 · +19.8% YoY. Source: county tax records.
Cash-flow waterfall
monthlySold comps — $/sqft
last 12 mo · ≤1 miLoading sold comps…