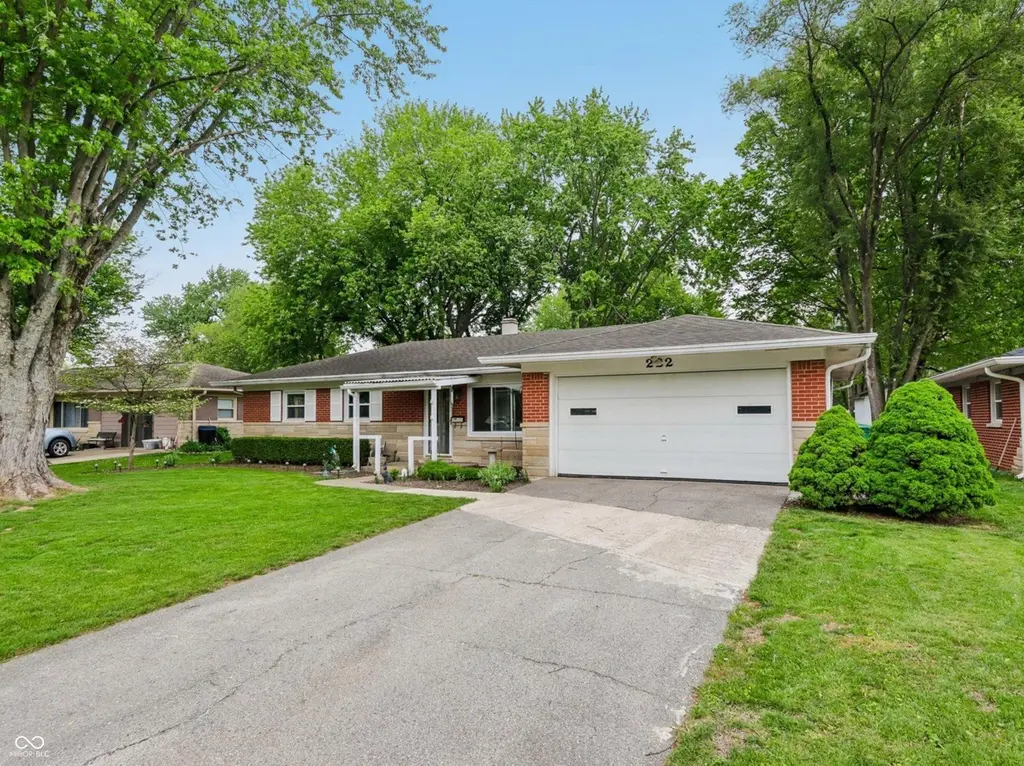
222 Pamela Pkwy · Brownsburg, IN
Flood risk 1/10 · Minimal
- FEMA flood zone
- X (unshaded)
- Chance of flooding over 30 yrs
- 0.0%
- Est. flood insurance / yr
- $507 – $1,088
Fire risk 1/10 · Minimal
- Est. fire insurance / yr
- $717 – $1,331
Heat risk 3/10 · Minor
- Hot days now (above 100°F)
- 7 days/yr
- Hot days in 30 yrs
- 19 days/yr
Wind risk 2/10 · Minimal
- Chance of severe wind over 30 yrs
- 1.0%
Air-quality risk 2/10 · Minimal
- Unhealthy air days now
- 1 days/yr
- Unhealthy air days in 30 yrs
- 2 days/yr
Risk factors via First Street. Map © Google.
Why this score? — see what drove the D- grade
The composite is a weighted blend of 9 inputs, each scored 0–100. Each bar is that input's sub-score; the figure is the points it added to the 100-point composite (weight × sub-score).
- Cash flow +11.2/30.0
- Schools +6.3/10.0
- ARV discount +4.7/15.0
- Rent growth +4.1/5.0
- Livability +3.8/5.0
- DSCR +3.3/10.0
- 1% rule +2.5/10.0
- Condition / age +2.5/5.0
- Appreciation +0.0/10.0
$265,000
🖨 Deal sheet (PDF) 📄 Offer letter ✓ Due diligence
Listing remarks MLS
Clean and ready for new owner. No need to do anything but make yourself at home. Roof, windows, hvac, kitchen ,water heater, blacktop, sunroom,washer/dryer, garage door opener all have been replaced by the current owner. Sunroom works year around with small heater. Family room was used as a dining room and could be another bedroom or a great office. Good location with quiet street, mature trees,fenced back yard. Deep finished garage with cabinets and workspace.
Key facts
- 0.29 acre lot
- 2 garage spots
- Built 1959
Property features AI
Finance
- Other: Property type: Residential; Property subtype: Single Family Residence; Lot approximately 0.29 acres (about 1/4–1/2 acre)
Exterior
- Parking: Attached 2-car garage with garage door opener; Guest street parking
- Security: Smoke detector(s)
- Utilities: Public water; Municipal sewer connected; Natural gas connected; 100 amp electric service; No solid waste service indicated
- Home design: Single-family residence; One story; Faces south
- Construction: Brick and stone exterior; Slab foundation
- Exterior features: Covered patio; Storage shed; Fire pit; Full yard fencing; Mature trees; Located on a cul-de-sac; Sidewalks; Storm sewer
Interior
- Kitchen: Dishwasher; Disposal; Microwave (with hood); Refrigerator; Tankless water heater
- Bedrooms: Three bedrooms on the main level
- Flooring: Hardwood floors
- Bathrooms: One full bath; One half bath
- Heating & cooling: Forced-air heating (natural gas); Central air conditioning
- Interior features: Attic access; Hardwood floors; Eat-in kitchen; Painted woodwork; Living room (formal)
- Laundry & utility: Washer and dryer included; Laundry closet; Water softener (owned)
Neighborhood map
What this means for you Summary
Snapshot
- This is a 3-bed/1.5-bath single-family listed at $265k.
Deal economics
- At list price, monthly cash flow is $-102 ($-1k/yr) — negative.
- To cash-flow at today's rent, offer at most $247k (6.8% below list).
- To meet the 1% rule (rent ≥ 1% of price), the offer needs to be $199k (24.7% below list).
- Recommended offer: $199k (24.7% below list) — sets the bar for 1% rule.
- Cap rate 5.8% vs local median 3.8% in Brownsburg — top-decile yield for the area; either an underpriced asset or a hidden risk that comps aren't pricing in. Stress-test before assuming the spread holds.
Location & tenants
- Location reads 75/100 on livability (#61 in IN, #4,105 nationally) — a middle-class / working-renter tenant base. Strengths: crime A+, employment A+, cost of living A+; Watch: amenities F, commute F, health & safety F.
- Brownsburg Community School Corporation (suburban): math 72% / reading 72% proficiency, ranked #2 of 301 in IN (top 1%) — strong family-tenant draw, lease renewals of 3-5y typical; only 17% free/reduced lunch — higher-income household profile.
- Zoned schools: Brownsburg High School (math 61% / reading 83%, grade B+, #12 of 369 statewide, top 4%, 3,177 students, 33% FRL) — zoned schools average 33% FRL vs 17% district-wide (16 pts higher); higher-poverty schools than district average — tighter screening recommended.
- Market conditions: Rents rising fast (+6.3%/yr); 340 active listings in the ZIP; 11 comparable units currently listed for rent nearby; rentals leasing fast (median 0d on market — plan ~1-2 weeks tenant-placement turnaround); high-income renter base; 1,294 units permitted in Hendricks County in 2024 (18 in 5+ unit buildings).
Forward outlook
- Local home prices are declining (-3.0%/yr); year-one equity from $2k of loan paydown is wiped out by about $8k of value loss. Plan a longer hold.
- Hendricks County population projected at +35% by 2050 — long-run rental-demand tailwind backs the buy-and-hold thesis.
Negotiation context
- Only 7 days on market — expect competitive offers; lowballing is unlikely to land.
- 3 sale attempts since 23y ago with the ask held roughly flat each time — persistent listings suggest the price (not the market) is what's stuck; bring a comps-based counter.
Risks & watch-outs
- Watch-outs: built in 1959 — expect roof / HVAC / electrical / plumbing capex.
Questions for the listing agent
- What do current leases actually rent for vs. the listed asking? Can we see a recent rent roll and the last 12 months of T-12 income?
- Built in 1959 — when were the roof, HVAC, electrical panel, plumbing, and water heater last replaced?
- Is there a deadline driving the sale (1031 exchange, divorce, estate, relocation)? That informs how much negotiation room exists.
- Schools are A-rated — typically a magnet for longer-tenancy family renters. What's the average tenant stay here, and is there a school-zone premium baked into asking?
- The area grade is low — what's the realistic commute time and amenity access for the typical tenant pool here? Any planned neighborhood developments (good or bad) we should know about?
- What's the average days-on-market for RENTAL listings here right now (not sales)? A rising rental-DOM trend means longer vacancies and softer asking-rent achievability than the comps imply.
- What's the recent tenant-quality profile in this submarket — average credit score on applications, eviction rate, late-payment / NSF rate, and stable-employment percentage? A property-management company in the area should have these aggregated.
- How much new for-sale + rental construction is in the pipeline within 1–3 miles? Heavy new supply typically softens prices + rents 12–24 months out; constrained supply supports both.
Investment metrics
- 1% rule
- 0.75% ✗
- Cap rate
- 5.83%
- Cash-on-cash
- -1.66%
- DSCR
- 0.93
- GRM
- 11.1
CMA / ARV
- ARV (median comp)
- $249,676
- List price
- $265,000
- Delta
- 6.14%
- Verdict
- FAIR
- Comps
- 20 within 1.0 mi
Show comp detail 12 sales within ~0.75 mi
| Address | Dist | Beds/Ba | Sqft | Sold | Price | $/sf | Match |
|---|---|---|---|---|---|---|---|
| 222 Pamela Pkwy | 0.00mi | 3/1.5 | 1,441 (+8%) | 1mo | $260,000 | $180 | 87 |
| 263 S Jefferson St | 0.31mi | 3/2.0 | 1,316 (-2%) | 1mo | $250,000 | $190 | 80 |
| 506 S Green St | 0.20mi | 3/1.0 | 1,264 (-6%) | 2mo | $245,000 | $194 | 78 |
| 48 Picadilly Ct | 0.31mi | 3/1.5 | 1,274 (-5%) | 4mo | $230,000 | $181 | 74 |
| 541 S Alpha Ave | 0.49mi | 3/2.0 | 1,361 (+2%) | 0mo | $230,000 | $169 | 72 |
| 14 James Ct | 0.23mi | 3/1.0 | 1,232 (-8%) | 3mo | $165,000 | $134 | 71 |
| 108 Prairie Pkwy | 0.17mi | 3/2.0 | 1,175 (-12%) | 0mo | $252,000 | $214 | 69 |
| 1020 S Green St | 0.52mi | 3/2.0 | 1,428 (+6%) | 0mo | $285,000 | $200 | 63 |
| 2 Nash Ct | 0.62mi | 3/2.0 | 1,308 (-2%) | 4mo | $268,000 | $205 | 62 |
| 6 Kristelli Ct | 0.53mi | 3/2.0 | 1,200 (-10%) | 2mo | $270,000 | $225 | 54 |
| 27 Lake Dr S | 0.66mi | 3/2.0 | 1,200 (-10%) | 1mo | $240,000 | $200 | 49 |
| 667 S Alpha Ave | 0.72mi | 3/2.0 | 1,189 (-11%) | 5mo | $165,000 | $139 | 42 |
Match score weights: distance 35% · size 25% · config 20% · recency 20%. Top-matched comps best support the ARV.
Projected returns pro-forma
-3.0% appreciation · 6.31% rent growth · sell at horizon
- IRR
- -15.7%
- Equity multiple
- 0.42×
- Total profit
- $-42,670
- Equity at exit
- $39,512
- IRR
- -2.8%
- Equity multiple
- 0.79×
- Total profit
- $-15,677
- Equity at exit
- $22,912
Cash invested: $74,200 (down + closing). Projections, not guarantees.
Landlord ↔ Tenant lean methodology
- Overall (STATE)
- 90 Strongly Landlord-Friendly
- State Indiana
- 90 Strongly Landlord-Friendly · R+11
- County
- — inherits STATE
- City
- — inherits STATE
ZIP-level market 46112
- Rents YoY
- 6.3%
- Active inventory
- 340
- Price-to-rent
- 11.1×
Monthly cashflow live
- Estimated rent
- $1,994 high interval (Pro) →
- Mortgage (P&I)
- −$1,390
- Tax from tax record
- −$178 /mo · $2,136/yr
- Insurance
- −$110
- HOA
- −$0
- Vacancy / Maint / Mgmt
- −$419
- Net cashflow
- $-102
Break-even live
Sensitivity live
| Price | -10% $48 | -5% $-27 | +0% $-102 | +5% $-177 | +10% $-252 |
|---|---|---|---|---|---|
| Rent | -10% $-260 | -5% $-181 | +0% $-102 | +5% $-24 | +10% $55 |
| Rate | -1.0pp $31 | -0.5pp $-35 | base $-102 | +0.5pp $-171 | +1.0pp $-241 |
UW: 25.0% down · 7.5% · 30yr · 1.5% tax · 5.0% vac · 8.0% maint · 8.0% mgmt
Financing live
Cash to close
- Down payment
- $66,250
- Closing costs
- $7,950
- Reserves months
- —
- Total cash needed
- —
Loan-product check · same deal, 3 products live
Conventional
25% down · 7.5% · 30yr
- Down + closing
- —
- Monthly P&I
- —
- Monthly cashflow
- —
- DSCR
- —
- Eligible?
- —
Personal DTI + credit; lowest rate.
DSCR
20% down · 8.5% · 30yr
- Down + closing
- —
- Monthly P&I
- —
- Monthly cashflow
- —
- DSCR
- —
- Eligible?
- —
No personal income docs; deal must DSCR.
Hard money
10% down · 12.0% · 12mo
- Down + closing
- —
- Monthly P&I
- —
- Monthly cashflow
- —
- DSCR
- —
- Eligible?
- —
Short-term bridge; refi at stabilization.
Rent comps 11 comps
| Address | Beds | Baths | Sqft | Rent | $/sqft | DOM | Units | Dist |
|---|---|---|---|---|---|---|---|---|
| 102 Murphy Ln Brownsburg, IN | 3.0 | 1.5 | 1248 | $1,775 | $1.42 | 9d | 1 | 0.77mi |
| 288 N Odell St Brownsburg, IN | 3.0 | 2.0 | 1408 | $2,000 | $1.42 | 0d | 1 | 0.85mi |
| 5793 N Green St Brownsburg, IN | 1.0–2.0 | 1.0–2.0 | 835 | $1,678 | $2.01 | 6d | 7 | 0.90mi |
| 5793 N Green St Brownsburg, IN | 1.0–2.0 | 1.0–2.0 | 835 | $1,678 | $2.01 | 0d | 7 | 0.90mi |
| 7249 Arbuckle Cmns Brownsburg, IN | 1.0–2.0 | 1.0–2.5 | 1548 | $2,545 | $1.64 | 0d | 19 | 0.91mi |
| 457 Sable Chase Brownsburg, IN | 3.0 | 2.0 | 1408 | $2,185 | $1.55 | 6d | 1 | 1.01mi |
| 28 Parkwood Dr Brownsburg, IN | 3.0 | 2.0 | 1422 | $1,760 | $1.24 | 20d | 1 | 1.12mi |
| 640 N Grant St Brownsburg, IN | 2.0 | 2.0 | 1116 | $1,550 | $1.39 | 0d | 1 | 1.27mi |
| 640 N Grant St Brownsburg, IN | 2.0 | 2.0 | 1116 | $1,550 | $1.39 | 16d | 1 | 1.27mi |
| 7774 Bedford Ct Brownsburg, IN | 2.0 | 1.5 | 1071 | $1,865 | $1.74 | 0d | 5 | 1.27mi |
| 711 Green Ridge Pkwy Brownsburg, IN | 1.0–2.0 | 1.0–2.0 | 857 | $1,529 | $1.78 | 0d | 3 | 1.33mi |
Listing history 8 events
-
2026-05-06status Pending 1283-char remark
-
2026-04-29$265,000 Active 1283-char remark
-
2015-09-03soldstatus $130,000 Sold 466-char remark
Show marketing remark (466 chars)
Clean and ready for new owner. No need to do anything but make yourself at home. Roof, windows, hvac, kitchen ,water heater, blacktop, sunroom,washer/dryer, garage door opener all have been replaced by the current owner. Sunroom works year around with small heater. Family room was used as a dining room and could be another bedroom or a great office. Good location with quiet street, mature trees,fenced back yard. Deep finished garage with cabinets and workspace.
-
2015-09-02status Pending 466-char remark
Show marketing remark (466 chars)
Clean and ready for new owner. No need to do anything but make yourself at home. Roof, windows, hvac, kitchen ,water heater, blacktop, sunroom,washer/dryer, garage door opener all have been replaced by the current owner. Sunroom works year around with small heater. Family room was used as a dining room and could be another bedroom or a great office. Good location with quiet street, mature trees,fenced back yard. Deep finished garage with cabinets and workspace.
-
2015-08-10status Pending 466-char remark
Show marketing remark (466 chars)
Clean and ready for new owner. No need to do anything but make yourself at home. Roof, windows, hvac, kitchen ,water heater, blacktop, sunroom,washer/dryer, garage door opener all have been replaced by the current owner. Sunroom works year around with small heater. Family room was used as a dining room and could be another bedroom or a great office. Good location with quiet street, mature trees,fenced back yard. Deep finished garage with cabinets and workspace.
-
2015-07-24$138,900 Active 466-char remark
Show marketing remark (466 chars)
Clean and ready for new owner. No need to do anything but make yourself at home. Roof, windows, hvac, kitchen ,water heater, blacktop, sunroom,washer/dryer, garage door opener all have been replaced by the current owner. Sunroom works year around with small heater. Family room was used as a dining room and could be another bedroom or a great office. Good location with quiet street, mature trees,fenced back yard. Deep finished garage with cabinets and workspace.
-
2003-03-28soldstatus $123,000
Show marketing remark (426 chars)
STUNNING! EVERTHING TOP NOTCH & SHOWS LIKE A DISIGNER DID IT! NATURAL MAPLE CABINETS, BLT-IN MICROWAVE,STACK NEPTUNE WASHER/DRYER, & DISHWASHER STAY.BOTH BATHROOMS BEAUTIFULLY UPDATED! ALLERGIES? ALL HARDWOOD OR VINYL F LOORS. 3BR ALL W/CLOSET ORGANIZERS & CEILING FANS. MASTER 15X12!NEW DOORS,WHITE WOODWORK,LIV&FAM RMS. BIG FENCED YARD.(POOL CAN BE REMOVED) A/C' 01,FUNR 7 YEARS,WTR HTR '96. CANT SAY ENOUGH!
-
2003-03-03$125,500
Show marketing remark (426 chars)
STUNNING! EVERTHING TOP NOTCH & SHOWS LIKE A DISIGNER DID IT! NATURAL MAPLE CABINETS, BLT-IN MICROWAVE,STACK NEPTUNE WASHER/DRYER, & DISHWASHER STAY.BOTH BATHROOMS BEAUTIFULLY UPDATED! ALLERGIES? ALL HARDWOOD OR VINYL F LOORS. 3BR ALL W/CLOSET ORGANIZERS & CEILING FANS. MASTER 15X12!NEW DOORS,WHITE WOODWORK,LIV&FAM RMS. BIG FENCED YARD.(POOL CAN BE REMOVED) A/C' 01,FUNR 7 YEARS,WTR HTR '96. CANT SAY ENOUGH!
ⓘ Source: listings_history table (triggers on properties + properties_extension) + one-shot
backfill from property_details.listing_events for pre-trigger history.
Tax reassessment forecast IN · Partial reset (capped growth)
- Current annual tax
- $2,136 · $178/mo
- Projected year-2 tax
- $2,194 · $183/mo
- Expected delta
- +$58/yr (+$5/mo · 2.7%)
ⓘ Screening estimate from a state-policy table — verify with the county assessor before closing.
Climate risk First Street
- Flood 1/10 Low FEMA zone X (unshaded) · 0% chance over 30 yrs
- Wildfire 1/10 Low
- Heat 3/10 Moderate 7 d/yr ≥100°F today · 19 d/yr by 30 yrs out
- Wind 2/10 Low 100% chance of damaging wind over 30 yrs
- Air quality 2/10 Low 1 unhealthy d/yr today · 2 by 30 yrs out
Nearby sold comps map
Loading sold comps map…
Walkable amenities ~0.75 mi
Loading nearby amenities…
Taxation est. · year 1
- Rental income
- $23,934
- − Mortgage interest
- −$14,844
- − Property taxes
- −$2,136
- − Insurance
- −$1,325
- − Repairs & maintenance
- −$1,915
- − Management
- −$1,915
- − Depreciation
- −$7,709
- Taxable loss
- −$5,910
- Est. tax savings @ 24.0%
- +$1,418
- After-tax cash flow
- $189/yr
For passive investors: Depreciation is non-cash, so a rental often shows a tax loss while cash-flowing — sheltering income. Rental losses are passive: they offset passive income freely, and up to $25,000/yr can offset ordinary (W-2) income if you actively participate and your MAGI is under $100k (phasing out to $0 by $150k); unused losses carry forward. On sale, claimed depreciation is recaptured at up to 25%, and gains may owe capital-gains tax (a 1031 exchange can defer both). Figures are a year-1 estimate at your 24.0% rate — not tax advice; consult a CPA.
Schools (NCES district)
- District
- Brownsburg Community School Corporation
- NCES district ID
- 1801020
- Math proficiency
- 72% ▼ -5.00%
- Reading proficiency
- 72% ▼ -4.00%
- Median HH income
- $75,304
- Composite
- 63.45/100
- National rank
- #616
- State rank
- #2 of 301 in IN
Livability — Brownsburg
- Score
- 75/100
- State rank
- #61
- US rank
- #4105
Category grades
Schools grade is shown separately in the Schools card above.
Census & demographics
- Census place
- Brownsburg, IN
- County
- Hendricks County · 143,373 people
- City population
- 44,220
- Metro
- Indianapolis-Carmel-Anderson, IN
- Population (ZIP)
- 44,220
- Household income
- $112,565
- Rent vs Own
- Severe rent burden
- 614.0
Population outlook (Hendricks County) Hauer SSP2
- Today (2025)
- 187,418 people
- By 2030
- 201,494 · +7.5%
- By 2040
- 228,487 · +21.9%
- By 2050
- 253,068 · +35.0%
- By 2075
- 308,920 · +64.8%
- By 2100
- 336,510 · +79.6%
Race, ethnicity, and origin ACS 2023
- Neighborhood character
- Predominantly White (83%)
- Race & ethnicity
- White 83% Black 10% Two or more races 4% Hispanic / Latino 4%
- Common ancestry
- Slovak 3% Iranian 2% Romanian 2%
- Foreign-born
- 6% · Canada, China
- Languages at home
- 93% English-only · Spanish 2% French/Haitian/Cajun 1%
Political lean MEDSL · Hendricks
- 2024 margin
- Strong R (+21.5) · D 38.4% · R 59.9% · Other 1.7%
- 2008→2024 swing
- +1.9pp toward D · 2008: -23.4pp · 2024: -21.5pp
- All cycles
- 2024: R+21.5 2020: R+23.9 2016: R+34.2 2012: R+34.9 2008: R+23.4
Not yet ingested
- Civics
- —
Market trends
- HPI YoY
- ▼ -135.99%
- Current HPI
- 217.3787
- Rent YoY
- ▲ 6.31%
- Metro
- Indianapolis-Carmel-Anderson, IN
- State GDP YoY
- ▲ 2.90%
- F500 in state
- 18
Industry mix (Fortune 500 HQ in IN)
| Industry | F500 HQs | Revenue |
|---|---|---|
| Industrial Machinery | 2 | $37B |
|
||
| Healthcare | 1 | $177B |
|
||
| Pharmaceuticals | 1 | $45B |
|
||
| Metals / Steel | 1 | $18B |
|
||
| Agriculture | 1 | $17B |
|
||
| Packaging | 1 | $12B |
|
||
Price history
+107.2% since first listed9 events — show timeline
- 2026-06-05 Sold (MLS) $260,000 MIBOR as Distributed by MLS Grid
- 2026-05-06 Pending — MIBOR as Distributed by MLS Grid
- 2026-04-29 Listed $265,000 MIBOR as Distributed by MLS Grid
- 2015-09-03 Sold (MLS) $130,000 MIBOR as Distributed by MLS Grid
- 2015-09-02 Pending — MIBOR as Distributed by MLS Grid
- 2015-08-10 Pending — MIBOR as Distributed by MLS Grid
- 2015-07-24 Listed $138,900 MIBOR as Distributed by MLS Grid
- 2003-03-28 Sold (MLS) $123,000 MIBOR as Distributed by MLS Grid
- 2003-03-03 Listed $125,500 MIBOR as Distributed by MLS Grid
Property tax history
+6.1%/yrLatest (2025): $2,136 · +1.7% YoY. Source: county tax records.
Cash-flow waterfall
monthlySold comps — $/sqft
last 12 mo · ≤1 miLoading sold comps…