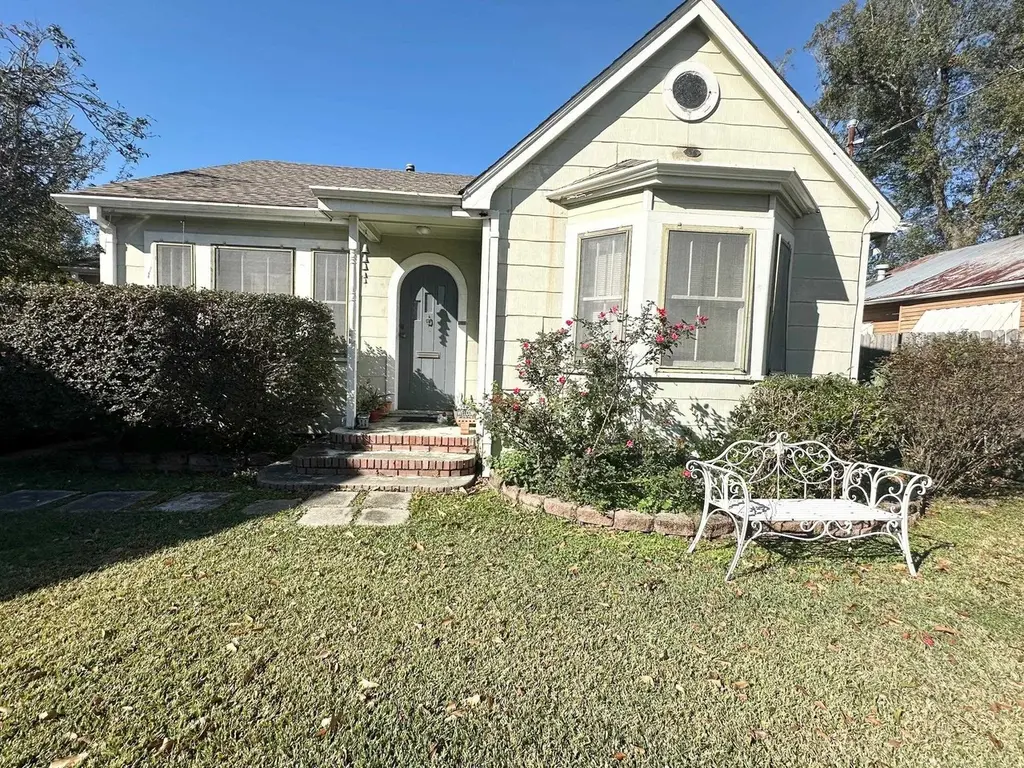
173 New Orleans Blvd · Houma, LA
Flood risk 6/10 · Moderate
- FEMA flood zone
- X (shaded)
- Chance of flooding over 30 yrs
- 0.57%
- Est. flood insurance / yr
- $507 – $1,088
Fire risk 1/10 · Minimal
- Est. fire insurance / yr
- $1,269 – $2,357
Heat risk 9/10 · Severe
- Hot days now (above 107°F)
- 7 days/yr
- Hot days in 30 yrs
- 21 days/yr
Wind risk 9/10 · Severe
- Chance of severe wind over 30 yrs
- 99.0%
Air-quality risk 1/10 · Minimal
- Unhealthy air days now
- 0 days/yr
- Unhealthy air days in 30 yrs
- 0 days/yr
Risk factors via First Street. Map © Google.
Why this score? — see what drove the C+ grade
The composite is a weighted blend of 9 inputs, each scored 0–100. Each bar is that input's sub-score; the figure is the points it added to the 100-point composite (weight × sub-score).
- Cash flow +23.5/30.0
- ARV discount +15.0/15.0
- DSCR +7.6/10.0
- 1% rule +5.5/10.0
- Schools +3.3/10.0
- Livability +3.2/5.0
- Rent growth +2.5/5.0
- Condition / age +2.5/5.0
- Appreciation +0.0/10.0
$117,000
🖨 Deal sheet 📄 Offer letter ✓ Due diligence
Listing remarks MLS
Located in downtown Houma, seconds away from Terrebonne General Hospital and minutes away from the Mardi Gras parade route, downtown festivals, and plenty of shopping and dining. This home has lots of character and would make the perfect starter home! Very spacious kitchen for someone who loves to cook! Large backyard with multiple cement slabs for you to add a shed. This house isn't in a flood zone that requires flood insurance. All measurements and flood zones to be confirmed by the buyer.
Key facts
- Not in a flood zone
- Spacious kitchen
- Large backyard
Tags
Neighborhood map
What this means for you Summary
Snapshot
- This is a 2-bed/1.0-bath single-family listed at $117k.
Deal economics
- At list price, monthly cash flow is $219 ($3k/yr) — positive.
- The deal already cash-flows at list — no discount required.
- Meets the 1% rule at list price ($1k rent vs $117k).
- Recommended offer: $103k (12.0% below list) — sets the bar for market timing.
- Cap rate 8.5% vs local median 4.0% in Houma — top-decile yield for the area; either an underpriced asset or a hidden risk that comps aren't pricing in. Stress-test before assuming the spread holds.
Location & tenants
- Location reads 64/100 on livability (#165 in LA) — a middle-class / working-renter tenant base. Strengths: cost of living A+, housing A; Watch: employment D, crime D-, amenities F.
- Terrebonne Parish (other): math 32% / reading 46% proficiency, ranked #23 of 98 in LA (top 24%) — families likely to look elsewhere, expect single-tenant / working-renter base with shorter leases; 62% free/reduced lunch — lower-income household profile, screen leases tightly.
- Market conditions: 311 active listings in the ZIP; 8 comparable units currently listed for rent nearby; rentals lingering (median 44d on market — plan ~5-8 weeks vacancy on turnover, expect pricing pressure); 100% of comp listings sitting > 30 days — soft ceiling on asking rent; 300 units permitted in Terrebonne Parish in 2024 (0 in 5+ unit buildings).
Forward outlook
- Local home prices are declining (-3.0%/yr); year-one equity from $809 of loan paydown is wiped out by about $4k of value loss. Plan a longer hold.
Negotiation context
- It's been on market 170 days — a 12% lower offer ($103k) is reasonable based on typical stale-listing flexibility.
- 7 sale attempts since 3y ago with the ask held roughly flat each time — persistent listings suggest the price (not the market) is what's stuck; bring a comps-based counter.
- Current owner paid $84k; 38% above their basis — modest negotiation headroom, anchor on the comps not their cost.
Risks & watch-outs
- Watch-outs: built in 1950 — expect roof / HVAC / electrical / plumbing capex.
- Climate carrying-cost: major flood risk; severe wind risk, 99% chance of damaging wind over 30y; extreme-heat days projected 7→21/yr by 2055 (HVAC capex compounding) — expect insurance premiums to compound above CPI over the hold.
Questions for the listing agent
- It's been on market 170 days. Have you received any prior offers? Is the seller open to a 12% concession, seller financing, or rate buy-down credit?
- Built in 1950 — when were the roof, HVAC, electrical panel, plumbing, and water heater last replaced?
- Why hasn't it sold? Are there any deal-killer items the seller is aware of (foundation, flood, title, zoning, code violations)?
- Is there a deadline driving the sale (1031 exchange, divorce, estate, relocation)? That informs how much negotiation room exists.
- Schools are B-rated — typically a magnet for longer-tenancy family renters. What's the average tenant stay here, and is there a school-zone premium baked into asking?
- Crime grade is D in this area — have there been break-ins, vandalism, or insurance claims at this property in the last 3 years? What carrier currently insures it and at what premium?
- What's the average days-on-market for RENTAL listings here right now (not sales)? A rising rental-DOM trend means longer vacancies and softer asking-rent achievability than the comps imply.
- What's the recent tenant-quality profile in this submarket — average credit score on applications, eviction rate, late-payment / NSF rate, and stable-employment percentage? A property-management company in the area should have these aggregated.
- How much new for-sale + rental construction is in the pipeline within 1–3 miles? Heavy new supply typically softens prices + rents 12–24 months out; constrained supply supports both.
Investment metrics
- 1% rule
- 1.05% ✓
- Cap rate
- 8.54%
- Cash-on-cash
- 8.04%
- DSCR
- 1.36
- GRM
- 7.9
CMA / ARV
- ARV (median comp)
- $141,959
- List price
- $117,000
- Delta
- -17.58%
- Verdict
- UNDERPRICED
- Comps
- 20 within 1.0 mi
Show comp detail 12 sales within ~0.75 mi
| Address | Dist | Beds/Ba | Sqft | Sold | Price | $/sf | Match |
|---|---|---|---|---|---|---|---|
| 828 Elm St | 0.36mi | 2/1.0 | 1,078 (-3%) | 3mo | $57,900 | $54 | 76 |
| 811 Elm St | 0.34mi | 2/1.0 | 1,032 (-7%) | 4mo | $44,900 | $44 | 69 |
| 204 Williams Ave | 0.17mi | 2/1.0 | 1,002 (-10%) | 9mo | $115,000 | $115 | 68 |
| 635 Wilson Ave | 0.54mi | 2/2.0 | 1,095 (-1%) | 4mo | $169,000 | $154 | 65 |
| 129 Pecan St | 0.33mi | 2/2.0 | 1,200 (+8%) | 4mo | $49,900 | $42 | 64 |
| 825 School St | 0.40mi | 2/1.0 | 1,005 (-10%) | 9mo | $165,100 | $164 | 57 |
| 315 Gouaux Ave | 0.31mi | 3/1.5 (+1) | 1,004 (-10%) | 8mo | $162,000 | $161 | 56 |
| 226 Cherry St | 0.33mi | 2/2.0 | 957 (-14%) | 2mo | $70,000 | $73 | 56 |
| 703 Duval Ave | 0.61mi | 3/1.0 (+1) | 1,145 (+3%) | 7mo | $125,000 | $109 | 56 |
| 247 Mckinley St | 0.68mi | 2/2.0 | 1,061 (-4%) | 7mo | $145,000 | $137 | 51 |
| 201 Ash St | 0.52mi | 2/2.0 | 954 (-14%) | 3mo | $135,000 | $142 | 46 |
| 1141 Bond St | 0.74mi | 3/2.0 (+1) | 1,056 (-5%) | 6mo | $47,000 | $45 | 43 |
Match score weights: distance 35% · size 25% · config 20% · recency 20%. Top-matched comps best support the ARV.
Projected returns pro-forma
-3.0% appreciation · 3.0% rent growth · sell at horizon
- IRR
- -4.1%
- Equity multiple
- 0.85×
- Total profit
- $-5,002
- Equity at exit
- $17,445
- IRR
- 5.6%
- Equity multiple
- 1.41×
- Total profit
- $13,569
- Equity at exit
- $10,116
Cash invested: $32,760 (down + closing). Projections, not guarantees.
Landlord ↔ Tenant lean methodology
- Overall (STATE)
- 90 Strongly Landlord-Friendly
- State Louisiana
- 90 Strongly Landlord-Friendly · R+12
- County
- — inherits STATE
- City
- — inherits STATE
ZIP-level market 70364
- Active inventory
- 311
- Price-to-rent
- 7.9×
Monthly cashflow live
- Estimated rent
- $1,228 high interval (Pro) →
- Mortgage (P&I)
- −$614
- Tax from tax record
- −$88 /mo · $1,057/yr
- Insurance
- −$49
- HOA
- −$0
- Vacancy / Maint / Mgmt
- −$258
- Net cashflow
- $219
Break-even live
UW: 25.0% down · 7.5% · 30yr · 1.5% tax · 5.0% vac · 8.0% maint · 8.0% mgmt
Financing live
Cash to close
- Down payment
- $29,250
- Closing costs
- $3,510
- Reserves months
- —
- Total cash needed
- —
Loan-product check · same deal, 3 products live
Conventional
25% down · 7.5% · 30yr
- Down + closing
- —
- Monthly P&I
- —
- Monthly cashflow
- —
- DSCR
- —
- Eligible?
- —
Personal DTI + credit; lowest rate.
DSCR
20% down · 8.5% · 30yr
- Down + closing
- —
- Monthly P&I
- —
- Monthly cashflow
- —
- DSCR
- —
- Eligible?
- —
No personal income docs; deal must DSCR.
Hard money
10% down · 12.0% · 12mo
- Down + closing
- —
- Monthly P&I
- —
- Monthly cashflow
- —
- DSCR
- —
- Eligible?
- —
Short-term bridge; refi at stabilization.
Rent comps 8 comps
| Address | Beds | Baths | Sqft | Rent | $/sqft | DOM | Units | Dist |
|---|---|---|---|---|---|---|---|---|
| 179 Garnet St Unit B Houma, LA | 3.0 | 1.0 | 1100 | $1,200 | $1.09 | 43d | 1 | 0.17mi |
| 735 A School St Unit A Houma, LA | 3.0 | 2.0 | 1450 | $1,600 | $1.10 | 43d | 1 | 0.44mi |
| 624 Gabasse St Unit 1 Houma, LA | 1.0 | 1.0 | 750 | $975 | $1.30 | 43d | 1 | 0.60mi |
| 885 High St Houma, LA | 2.0 | 1.0 | 801 | $1,100 | $1.37 | 43d | 1 | 0.63mi |
| 1140 Church St Unit B Houma, LA | 2.0 | 1.0 | 1000 | $1,150 | $1.15 | 43d | 1 | 0.99mi |
| 810 Saadi St Houma, LA | 2.0 | 1.0 | 754 | $1,300 | $1.72 | 43d | 3 | 1.00mi |
| 100 Chateau Ct Houma, LA | 2.0 | 2.5 | 988 | $1,262 | $1.28 | 43d | 5 | 1.23mi |
| 211 Saint Malo St Houma, LA | 3.0 | 1.0 | 951 | $1,050 | $1.10 | 43d | 1 | 1.37mi |
Listing history 28 events
-
2026-06-19days on market $117,000 Active 170 DOM
-
2026-06-18days on market $117,000 Active 169 DOM
-
2026-06-17days on market $117,000 Active 168 DOM
-
2026-06-16days on market $117,000 Active 167 DOM
-
2026-06-15days on market $117,000 Active 166 DOM
-
2026-06-14days on market $117,000 Active 164 DOM
-
2026-06-13days on market $117,000 Active 163 DOM
-
2026-06-10days on market $117,000 Active 161 DOM
-
2026-06-09days on market $117,000 Active 160 DOM
-
2026-06-08days on market $117,000 Active 159 DOM
-
2026-06-07days on market $117,000 Active 158 DOM
-
2026-06-05days on market $117,000 Active 155 DOM
-
2026-06-03days on market $117,000 Active 154 DOM
-
2026-06-02days on market $117,000 Active 153 DOM
-
2026-06-01days on market $117,000 Active 152 DOM
-
2026-05-31days on market $117,000 Active 151 DOM
-
2026-05-30days on market $117,000 Active 150 DOM
-
2025-12-31$117,000 Active 496-char remark
Show marketing remark (496 chars)
Located in downtown Houma, seconds away from Terrebonne General Hospital and minutes away from the Mardi Gras parade route, downtown festivals, and plenty of shopping and dining. This home has lots of character and would make the perfect starter home! Very spacious kitchen for someone who loves to cook! Large backyard with multiple cement slabs for you to add a shed. This house isn't in a flood zone that requires flood insurance. All measurements and flood zones to be confirmed by the buyer.
-
2024-10-13historical
-
2024-07-28$1,500
-
2024-03-14price $149,900
-
2024-01-30$155,000 Active
-
2024-01-30$149,900
-
2023-03-04historical
-
2023-01-10$200,000 Active
-
2023-01-10$200,000
-
2003-04-30soldstatus $84,500
ⓘ Source: listings_history table (triggers on properties + properties_extension) + one-shot
backfill from property_details.listing_events for pre-trigger history.
Tax reassessment forecast LA · Resets to sale price
- Current annual tax
- $1,057 · $88/mo
- Projected year-2 tax
- $1,057 · $88/mo
- Expected delta
- $0/yr ($0/mo · 0.0%)
ⓘ Screening estimate from a state-policy table — verify with the county assessor before closing.
Climate risk First Street
- Flood 6/10 Major FEMA zone X (shaded) · 57% chance over 30 yrs
- Wildfire 1/10 Low
- Heat 9/10 Extreme 7 d/yr ≥107°F today · 21 d/yr by 30 yrs out
- Wind 9/10 Extreme 99% chance of damaging wind over 30 yrs
- Air quality 1/10 Low 0 unhealthy d/yr today · 0 by 30 yrs out
Nearby sold comps map
Loading sold comps map…
Walkable amenities ~0.75 mi
Loading nearby amenities…
Taxation est. · year 1
- Rental income
- $14,731
- − Mortgage interest
- −$6,554
- − Property taxes
- −$1,057
- − Insurance
- −$585
- − Repairs & maintenance
- −$1,178
- − Management
- −$1,178
- − Depreciation
- −$3,404
- Taxable income
- $775
- Est. tax owed @ 24.0%
- −$186
- After-tax cash flow
- $2,447/yr
For passive investors: Depreciation is non-cash, so a rental often shows a tax loss while cash-flowing — sheltering income. Rental losses are passive: they offset passive income freely, and up to $25,000/yr can offset ordinary (W-2) income if you actively participate and your MAGI is under $100k (phasing out to $0 by $150k); unused losses carry forward. On sale, claimed depreciation is recaptured at up to 25%, and gains may owe capital-gains tax (a 1031 exchange can defer both). Figures are a year-1 estimate at your 24.0% rate — not tax advice; consult a CPA.
Schools (NCES district)
- District
- Terrebonne Parish
- NCES district ID
- 2201740
- Math proficiency
- 32% ▼ -36.00%
- Reading proficiency
- 46% ▼ -30.00%
- Median HH income
- $47,612
- Composite
- 33.38/100
- National rank
- #5480
- State rank
- #23 of 98 in LA
Livability — Houma
- Score
- 64/100
- State rank
- #165
- US rank
- #13966
Category grades
Schools grade is shown separately in the Schools card above.
Census & demographics
- Census place
- Houma, LA
- County
- Terrebonne Parish · 57,290 people
- City population
- 57,290
- Metro
- Houma-Thibodaux, LA
- Population (ZIP)
- 28,716
- Household income
- $68,843
- Rent vs Own
- Severe rent burden
- 387.0
Population outlook (Terrebonne County) Hauer SSP2
- Today (2025)
- 118,724 people
- By 2030
- 120,321 · +1.3%
- By 2040
- 121,894 · +2.7%
- By 2050
- 121,119 · +2.0%
- By 2075
- 117,270 · -1.2%
- By 2100
- 107,544 · -9.4%
Race, ethnicity, and origin ACS 2023
- Neighborhood character
- Majority White (65%)
- Race & ethnicity
- White 65% Black 16% Hispanic / Latino 9% Two or more races 9% Native American 7% Asian 1%
- Hispanic origin (detail)
- Mexican 7% Puerto Rican 1%
- Common ancestry
- Lithuanian 17% Slovak 1% Serbian 1%
- Foreign-born
- 3% · Canada, Vietnam
- Languages at home
- 92% English-only · Spanish 4% French/Haitian/Cajun 2% Other Indo-European 1%
Political lean MEDSL · Terrebonne
- 2024 margin
- Solid R (+51.8) · D 23.5% · R 75.3% · Other 1.2%
- 2008→2024 swing
- -11.0pp toward R · 2008: -40.9pp · 2024: -51.8pp
- All cycles
- 2024: R+51.8 2020: R+50.0 2016: R+48.4 2012: R+41.2 2008: R+40.9
Not yet ingested
- Civics
- —
Market trends
- HPI YoY
- ▼ -99.75%
- Current HPI
- 113.1047
- Rent YoY
- —
- Metro
- Houma-Thibodaux, LA
- State GDP YoY
- ▲ 3.29%
- F500 in state
- 10
Industry mix (Fortune 500 HQ in LA)
| Industry | F500 HQs | Revenue |
|---|---|---|
| Telecommunications | 2 | $23B |
|
||
| Utilities | 1 | $12B |
|
||
| Wholesale / Distribution | 1 | $5B |
|
||
| Advertising | 1 | $2B |
|
||
Price history
+38.5% since first listed11 events — show timeline
- 2025-12-31 Listed $117,000 GBRMLS
- 2025-12-31 Listed $117,000 AcadianaMLS
- 2024-10-13 Delisted — GBRMLS
- 2024-07-28 Listed $1,500 GBRMLS
- 2024-03-14 Price Changed $149,900 GBRMLS
- 2024-01-30 Listed $149,900 AcadianaMLS
- 2024-01-30 Listed $155,000 GBRMLS
- 2023-03-04 Delisted — GBRMLS
- 2023-01-10 Listed $200,000 AcadianaMLS
- 2023-01-10 Listed $200,000 GBRMLS
- 2003-04-30 Sold (Public Records) $84,500 Public Records
Property tax history
+10.3%/yrLatest (2025): $1,057 · -2.3% YoY. Source: county tax records.
Cash-flow waterfall
monthlySold comps — $/sqft
last 12 mo · ≤1 miLoading sold comps…