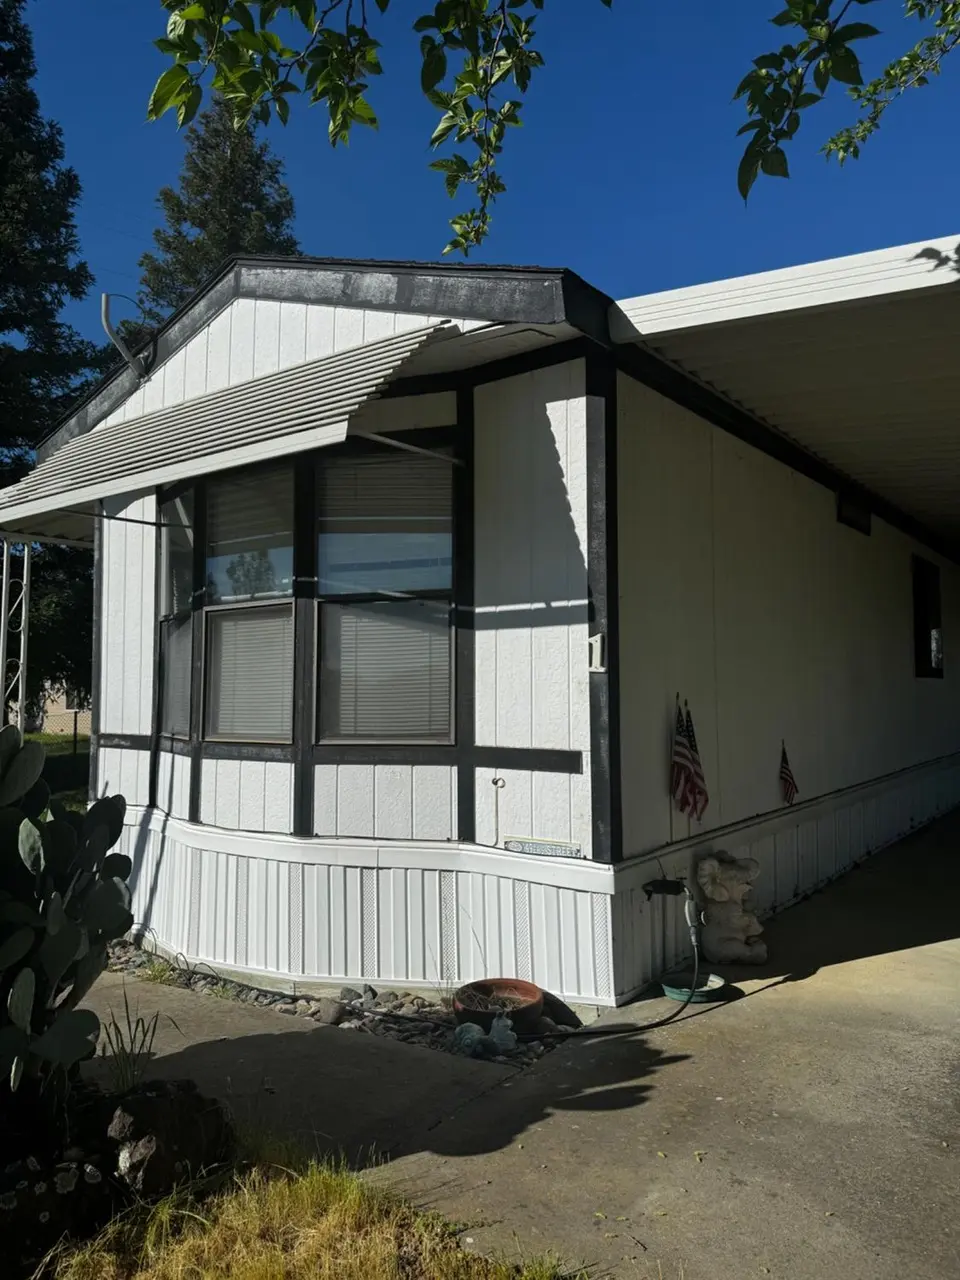
8255 Hwy 99 E #1 · Los Molinos, CA
Flood risk 3/10 · Minor
- FEMA flood zone
- X (unshaded)
- Chance of flooding over 30 yrs
- 0.09%
- Est. flood insurance / yr
- $507 – $1,088
Fire risk 8/10 · Major
- Est. fire insurance / yr
- $659 – $1,223
Heat risk 8/10 · Major
- Hot days now (above 106°F)
- 7 days/yr
- Hot days in 30 yrs
- 17 days/yr
Wind risk 1/10 · Minimal
- Chance of severe wind over 30 yrs
- —
Air-quality risk 10/10 · Severe
- Unhealthy air days now
- 34 days/yr
- Unhealthy air days in 30 yrs
- 38 days/yr
Risk factors via First Street. Map © Google.
Why this score? — see what drove the B- grade
The composite is a weighted blend of 9 inputs, each scored 0–100. Each bar is that input's sub-score; the figure is the points it added to the 100-point composite (weight × sub-score).
- Cash flow +30.0/30.0
- 1% rule +10.0/10.0
- DSCR +10.0/10.0
- ARV discount +7.5/15.0
- Livability +3.0/5.0
- Schools +2.6/10.0
- Rent growth +2.5/5.0
- Condition / age +2.5/5.0
- Appreciation +0.0/10.0
$24,900
🖨 Deal sheet (PDF) 📄 Offer letter ✓ Due diligence
Listing remarks
Mobile home at New Orchard Mobile Home Park (55+ community). This home is just needs a little TLC and in a peaceful, well-maintained senior park! Large single wide with open kitchen.
Key facts
- Parking
- Built 1989
- Listed 70 days
Neighborhood map
What this means for you Summary
Snapshot
- This is a 2-bed/2.0-bath manufactured listed at $25k.
Deal economics
- At list price, monthly cash flow is $610 ($7k/yr) — positive.
- The deal already cash-flows at list — no discount required.
- Meets the 1% rule at list price ($975 rent vs $25k).
- Recommended offer: $23k (6.0% below list) — sets the bar for market timing.
Location & tenants
- Location reads 59/100 on livability (#650 in CA) — a working-class tenant base; expect higher turnover. Strengths: housing A, crime B; Watch: cost of living D+, schools D, amenities F.
- Los Molinos Unified (rural): math 26% / reading 37% proficiency, ranked #339 of 517 in CA (top 66%) — families likely to look elsewhere, expect single-tenant / working-renter base with shorter leases; 68% free/reduced lunch — lower-income household profile, screen leases tightly.
- Market conditions: 25 active listings in the ZIP; 2 comparable units currently listed for rent nearby; 186 units permitted in Tehama County in 2024 (0 in 5+ unit buildings).
Forward outlook
- Local home prices are declining (-3.0%/yr); year-one equity from $172 of loan paydown is wiped out by about $747 of value loss. Plan a longer hold.
- Tehama County population projected at -14% by 2050 — secular population decline; favor cash flow + early exit over multi-decade hold.
- At projected returns (-3.0% appreciation + 3.0% rent growth), your $7k cash investment doubles in ~2 years — after that, you're playing with house money.
Negotiation context
- It's been on market 71 days — a 6% lower offer ($23k) is reasonable based on typical stale-listing flexibility.
Risks & watch-outs
- Climate carrying-cost: severe wildfire risk; extreme-heat days projected 7→17/yr by 2055 (HVAC capex compounding) — expect insurance premiums to compound above CPI over the hold.
Questions for the listing agent
- It's been on market 71 days. Have you received any prior offers? Is the seller open to a 6% concession, seller financing, or rate buy-down credit?
- Why hasn't it sold? Are there any deal-killer items the seller is aware of (foundation, flood, title, zoning, code violations)?
- Is there a deadline driving the sale (1031 exchange, divorce, estate, relocation)? That informs how much negotiation room exists.
- Schools are D-rated, which usually means shorter tenancies and higher turnover. Who's the typical renter profile here, and what's been the actual vacancy rate?
- What's the average days-on-market for RENTAL listings here right now (not sales)? A rising rental-DOM trend means longer vacancies and softer asking-rent achievability than the comps imply.
- What's the recent tenant-quality profile in this submarket — average credit score on applications, eviction rate, late-payment / NSF rate, and stable-employment percentage? A property-management company in the area should have these aggregated.
- How much new for-sale + rental construction is in the pipeline within 1–3 miles? Heavy new supply typically softens prices + rents 12–24 months out; constrained supply supports both.
Investment metrics
- 1% rule
- 3.92% ✓
- Cap rate
- 35.68%
- Cash-on-cash
- 104.97%
- DSCR
- 5.67
- GRM
- 2.1
CMA / ARV
- ARV (median comp)
- $108,866
- List price
- $24,900
- Delta
- -77.13%
- Verdict
- UNDERPRICED
- Comps
- 2 within 1.0 mi
Projected returns pro-forma
-3.0% appreciation · 3.0% rent growth · sell at horizon
- IRR
- —
- Equity multiple
- 5.99×
- Total profit
- $34,815
- Equity at exit
- $3,713
- IRR
- —
- Equity multiple
- 12.53×
- Total profit
- $80,363
- Equity at exit
- $2,153
Cash invested: $6,972 (down + closing). Projections, not guarantees.
Landlord ↔ Tenant lean methodology
- Overall (STATE)
- 18 Strongly Tenant-Friendly
- State California
- 18 Strongly Tenant-Friendly · D+13
- County
- — inherits STATE
- City
- — inherits STATE
ZIP-level market 96055
- Home prices YoY
- -10.2%
- Active inventory
- 25
- Price-to-rent
- 2.1×
Monthly cashflow live
- Estimated rent
- $975 medium interval (Pro) →
- Mortgage (P&I)
- −$131
- Tax from tax record
- −$19 /mo · $233/yr
- Insurance
- −$10
- HOA
- −$0
- Vacancy / Maint / Mgmt
- −$205
- Net cashflow
- $610
Break-even live
Sensitivity live
| Price | -10% $624 | -5% $617 | +0% $610 | +5% $603 | +10% $596 |
|---|---|---|---|---|---|
| Rent | -10% $533 | -5% $571 | +0% $610 | +5% $648 | +10% $687 |
| Rate | -1.0pp $622 | -0.5pp $616 | base $610 | +0.5pp $603 | +1.0pp $597 |
UW: 25.0% down · 7.5% · 30yr · 1.5% tax · 5.0% vac · 8.0% maint · 8.0% mgmt
Financing live
Cash to close
- Down payment
- $6,225
- Closing costs
- $747
- Reserves months
- —
- Total cash needed
- —
Loan-product check · same deal, 3 products live
Conventional
25% down · 7.5% · 30yr
- Down + closing
- —
- Monthly P&I
- —
- Monthly cashflow
- —
- DSCR
- —
- Eligible?
- —
Personal DTI + credit; lowest rate.
DSCR
20% down · 8.5% · 30yr
- Down + closing
- —
- Monthly P&I
- —
- Monthly cashflow
- —
- DSCR
- —
- Eligible?
- —
No personal income docs; deal must DSCR.
Hard money
10% down · 12.0% · 12mo
- Down + closing
- —
- Monthly P&I
- —
- Monthly cashflow
- —
- DSCR
- —
- Eligible?
- —
Short-term bridge; refi at stabilization.
Rent comps 2 comps
| Address | Beds | Baths | Sqft | Rent | $/sqft | DOM | Units | Dist |
|---|---|---|---|---|---|---|---|---|
| 8255 State Highway 99E #38 Los Molinos, CA | 2.0 | 2.0 | 840 | $975 | $1.16 | 14d | 1 | 0.03mi |
| 8255 Highway 99e Los Molinos, CA | 2.0 | 2.0 | 840 | $975 | $1.16 | 44d | 1 | 0.12mi |
Listing history 17 events
-
2026-06-19days on market $24,900 Active 71 DOM
-
2026-06-18days on market $24,900 Active 70 DOM
-
2026-06-17days on market $24,900 Active 69 DOM
-
2026-06-16days on market $24,900 Active 68 DOM
-
2026-06-15days on market $24,900 Active 67 DOM
-
2026-06-14days on market $24,900 Active 65 DOM
-
2026-06-13days on market $24,900 Active 64 DOM
-
2026-06-10days on market $24,900 Active 62 DOM
-
2026-06-09days on market $24,900 Active 61 DOM
-
2026-06-08days on market $24,900 Active 60 DOM
-
2026-06-07days on market $24,900 Active 59 DOM
-
2026-06-05days on market $24,900 Active 56 DOM
-
2026-06-03pricedays on market $24,900 Active 55 DOM
-
2026-06-02days on market $34,900 Active 54 DOM
-
2026-06-01days on market $34,900 Active 53 DOM
-
2026-05-31days on market $34,900 Active 52 DOM
-
2026-05-30days on market $34,900 Active 51 DOM
ⓘ Source: listings_history table (triggers on properties + properties_extension) + one-shot
backfill from property_details.listing_events for pre-trigger history.
Tax reassessment forecast CA · Resets to sale price
- Current annual tax
- $233 · $19/mo
- Projected year-2 tax
- $233 · $19/mo
- Expected delta
- $0/yr ($0/mo · 0.0%)
ⓘ Screening estimate from a state-policy table — verify with the county assessor before closing.
Climate risk First Street
- Flood 3/10 Moderate FEMA zone X (unshaded) · 9% chance over 30 yrs
- Wildfire 8/10 Severe
- Heat 8/10 Severe 7 d/yr ≥106°F today · 17 d/yr by 30 yrs out
- Wind 1/10 Low
- Air quality 10/10 Extreme 34 unhealthy d/yr today · 38 by 30 yrs out
Nearby sold comps map
Loading sold comps map…
Walkable amenities ~0.75 mi
Loading nearby amenities…
Taxation est. · year 1
- Rental income
- $11,700
- − Mortgage interest
- −$1,395
- − Property taxes
- −$233
- − Insurance
- −$124
- − Repairs & maintenance
- −$936
- − Management
- −$936
- − Depreciation
- −$724
- Taxable income
- $7,351
- Est. tax owed @ 24.0%
- −$1,764
- After-tax cash flow
- $5,554/yr
For passive investors: Depreciation is non-cash, so a rental often shows a tax loss while cash-flowing — sheltering income. Rental losses are passive: they offset passive income freely, and up to $25,000/yr can offset ordinary (W-2) income if you actively participate and your MAGI is under $100k (phasing out to $0 by $150k); unused losses carry forward. On sale, claimed depreciation is recaptured at up to 25%, and gains may owe capital-gains tax (a 1031 exchange can defer both). Figures are a year-1 estimate at your 24.0% rate — not tax advice; consult a CPA.
Schools (NCES district)
- District
- Los Molinos Unified
- NCES district ID
- 0622860
- Math proficiency
- 26% ▼ -8.00%
- Reading proficiency
- 37% ▼ -9.00%
- Median HH income
- $39,064
- Composite
- 26.36/100
- National rank
- #7234
- State rank
- #339 of 517 in CA
Livability — Los Molinos
- Score
- 59/100
- State rank
- #650
- US rank
- #20269
Category grades
Schools grade is shown separately in the Schools card above.
Census & demographics
- Census place
- Los Molinos, CA
- Population (ZIP)
- 3,404
Population outlook (Tehama County) Hauer SSP2
- Today (2025)
- 61,058 people
- By 2030
- 59,493 · -2.6%
- By 2040
- 56,076 · -8.2%
- By 2050
- 52,372 · -14.2%
- By 2075
- 43,895 · -28.1%
- By 2100
- 34,186 · -44.0%
Race, ethnicity, and origin ACS 2023
- Neighborhood character
- Majority White (61%)
- Race & ethnicity
- White 61% Hispanic / Latino 34% Two or more races 19% Asian 1%
- Hispanic origin (detail)
- Mexican 32% Puerto Rican 2%
- Common ancestry
- Italian 4% Lithuanian 3% Portuguese 3%
- Foreign-born
- 10% · Canada, China
- Languages at home
- 72% English-only · Spanish 25% Other Indo-European 1% Chinese 1%
Political lean MEDSL · Tehama
- 2024 margin
- Solid R (+41.8) · D 27.9% · R 69.7% · Other 2.3%
- 2008→2024 swing
- -17.7pp toward R · 2008: -24.1pp · 2024: -41.8pp
- All cycles
- 2024: R+41.8 2020: R+35.6 2016: R+36.8 2012: R+27.4 2008: R+24.1
Not yet ingested
- Civics
- —
Market trends
- HPI YoY
- ▼ -29.37%
- Current HPI
- 259.2093
- Rent YoY
- —
- Metro
- —
- State GDP YoY
- ▲ 3.21%
- F500 in state
- 116
Industry mix (Fortune 500 HQ in CA)
| Industry | F500 HQs | Revenue |
|---|---|---|
| Technology | 27 | $1,492B |
|
||
| Financial Services | 3 | $174B |
|
||
| Retail | 3 | $44B |
|
||
| Insurance | 3 | $26B |
|
||
| Media / Entertainment | 2 | $115B |
|
||
| Pharmaceuticals / Biotech | 2 | $62B |
|
||
Property tax history
+9.6%/yrLatest (2025): $233 · +170.1% YoY. Source: county tax records.
Cash-flow waterfall
monthlySold comps — $/sqft
last 12 mo · ≤1 miLoading sold comps…