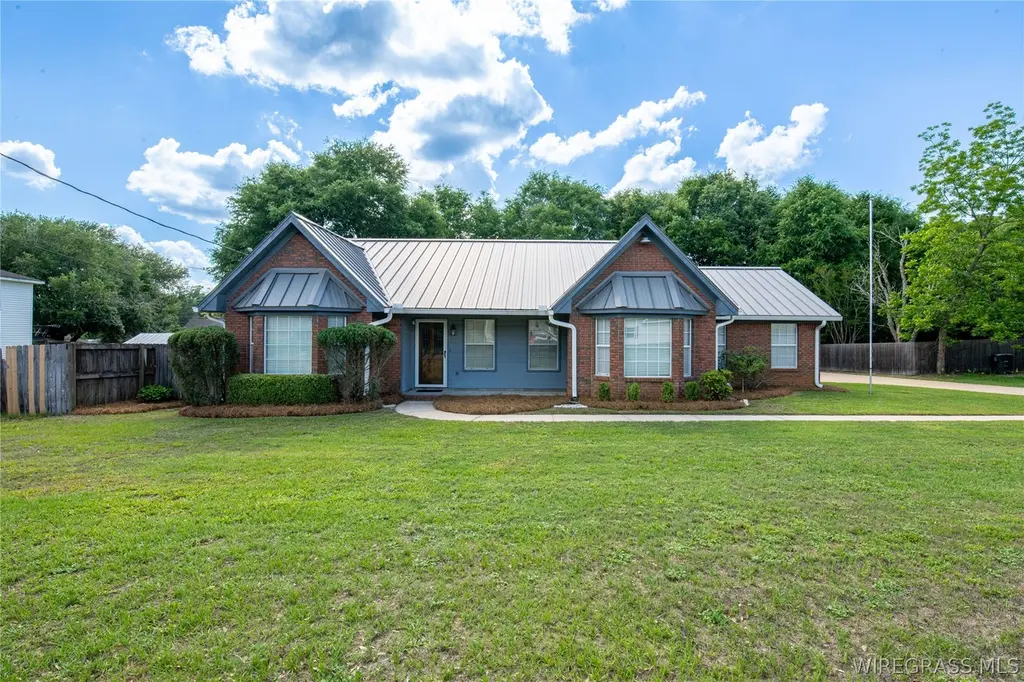
103 N Woodlawn Dr · Enterprise, AL
Flood risk 1/10 · Minimal
- FEMA flood zone
- X (unshaded)
- Chance of flooding over 30 yrs
- 0.0%
- Est. flood insurance / yr
- $507 – $1,088
Fire risk 3/10 · Minor
- Est. fire insurance / yr
- $916 – $1,700
Heat risk 8/10 · Major
- Hot days now (above 106°F)
- 7 days/yr
- Hot days in 30 yrs
- 19 days/yr
Wind risk 8/10 · Major
- Chance of severe wind over 30 yrs
- 99.0%
Air-quality risk 1/10 · Minimal
- Unhealthy air days now
- 0 days/yr
- Unhealthy air days in 30 yrs
- 0 days/yr
Risk factors via First Street. Map © Google.
Why this score? — see what drove the D grade
The composite is a weighted blend of 9 inputs, each scored 0–100. Each bar is that input's sub-score; the figure is the points it added to the 100-point composite (weight × sub-score).
- ARV discount +15.0/15.0
- Cash flow +9.0/30.0
- Schools +4.3/10.0
- Rent growth +3.5/5.0
- Livability +3.2/5.0
- DSCR +2.5/10.0
- Condition / age +2.5/5.0
- 1% rule +1.5/10.0
- Appreciation +0.0/10.0
$250,000
🖨 Deal sheet (PDF) 📄 Offer letter ✓ Due diligence
Listing remarks
Welcome to 103 North Woodlawn Drive — a spacious and character-filled home tucked away on a cul de sac in Enterprise! With timeless features, generous living spaces, and endless potential, this property offers the perfect blend of comfort and functionality. Inside, you’ll find hardwood flooring, oversized rooms, and custom cabinets that add warmth and charm throughout the home. The living room features a brick fireplace, creating the perfect gathering space. The kitchen offers abundant cabinet storage, stainless appliances, and a functional layout with an adjoining breakfast area surrounded by natural light. The primary bathroom has been updated with a large tiled walk-in shower
Key facts
- Hardwood flooring
- Tiled walk-in shower
- Brick fireplace
Tags
Property features AI
Exterior
- Parking: Attached garage (2 spaces)
- Utilities: Public water; Septic tank; Electricity available
- Home design: Single-family residence; One story; Brick construction; Slab foundation
- Construction: Brick exterior; Slab foundation
- Exterior features: Storage; Porch (covered, screened); Fenced yard with privacy fencing; Level lot; City lot; Paved road access
Interior
- Kitchen: Dishwasher; Electric range; Microwave; Refrigerator; Electric water heater
- Flooring: Laminate; Tile; Vinyl
- Bathrooms: 2 full bathrooms
- Heating & cooling: Central heating; Hot water heating; Electric heating; Central air conditioning; Electric cooling
- Interior features: Double vanity; Vaulted ceilings; Walk-in closet(s); Window coverings and blinds; Fireplace (1)
- Laundry & utility: Washer hookup
Neighborhood map
What this means for you Summary
Snapshot
- This is a 3-bed/1.0-bath single-family listed at $250k.
Deal economics
- At list price, monthly cash flow is $-196 ($-2k/yr) — negative.
- To cash-flow at today's rent, offer at most $215k (13.8% below list).
- To meet the 1% rule (rent ≥ 1% of price), the offer needs to be $163k (34.8% below list).
- Recommended offer: $163k (34.8% below list) — sets the bar for 1% rule.
- Cap rate 5.4% vs local median 4.1% in Enterprise — top-decile yield for the area; either an underpriced asset or a hidden risk that comps aren't pricing in. Stress-test before assuming the spread holds.
Location & tenants
- Location reads 65/100 on livability (#127 in AL) — a middle-class / working-renter tenant base. Strengths: cost of living A+, housing A+; Watch: health & safety D, crime F, amenities F.
- Enterprise City (town): math 40% / reading 60% proficiency, ranked #12 of 129 in AL (top 9%) — acceptable for families but not a draw, mixed tenant base, ~2y average lease.
- Zoned schools: Holly Hill Elementary School (math 50% / reading 70%, grade B-, #61 of 627 statewide, top 10%, 708 students, 44% FRL); Dauphin Junior High School (math 42% / reading 68%, grade B-, #17 of 257 statewide, top 7%, 500 students, 39% FRL); Enterprise High School (math 34% / reading 37%, grade F, #45 of 305 statewide, top 14%, 2,117 students, 44% FRL) — zoned schools at 42% FRL track the district average.
- Market conditions: Rents rising (+3.9%/yr); 444 active listings in the ZIP; 1 comparable units currently listed for rent nearby; solid renter incomes; 137 units permitted in Coffee County in 2024 (0 in 5+ unit buildings).
Forward outlook
- Local home prices are declining (-3.0%/yr); year-one equity from $2k of loan paydown is wiped out by about $8k of value loss. Plan a longer hold.
Negotiation context
- It's been on market 22 days — a 2% lower offer ($246k) is reasonable based on typical stale-listing flexibility.
Risks & watch-outs
- Climate carrying-cost: severe wind risk, 99% chance of damaging wind over 30y; extreme-heat days projected 7→19/yr by 2055 (HVAC capex compounding) — expect insurance premiums to compound above CPI over the hold.
Questions for the listing agent
- What do current leases actually rent for vs. the listed asking? Can we see a recent rent roll and the last 12 months of T-12 income?
- Is there a deadline driving the sale (1031 exchange, divorce, estate, relocation)? That informs how much negotiation room exists.
- Crime grade is F in this area — have there been break-ins, vandalism, or insurance claims at this property in the last 3 years? What carrier currently insures it and at what premium?
- The area grade is low — what's the realistic commute time and amenity access for the typical tenant pool here? Any planned neighborhood developments (good or bad) we should know about?
- What's the average days-on-market for RENTAL listings here right now (not sales)? A rising rental-DOM trend means longer vacancies and softer asking-rent achievability than the comps imply.
- What's the recent tenant-quality profile in this submarket — average credit score on applications, eviction rate, late-payment / NSF rate, and stable-employment percentage? A property-management company in the area should have these aggregated.
- How much new for-sale + rental construction is in the pipeline within 1–3 miles? Heavy new supply typically softens prices + rents 12–24 months out; constrained supply supports both.
Investment metrics
- 1% rule
- 0.65% ✗
- Cap rate
- 5.35%
- Cash-on-cash
- -3.36%
- DSCR
- 0.85
- GRM
- 12.8
CMA / ARV
- ARV (median comp)
- $321,965
- List price
- $250,000
- Delta
- -22.35%
- Verdict
- UNDERPRICED
- Comps
- 20 within 1.0 mi
Show comp detail 12 sales within ~0.75 mi
| Address | Dist | Beds/Ba | Sqft | Sold | Price | $/sf | Match |
|---|---|---|---|---|---|---|---|
| 5560 Shellfield Rd | 0.49mi | 3/1.5 | 2,020 (+3%) | 7mo | $205,000 | $101 | 64 |
| 300 Fernway Dr | 0.42mi | 3/2.0 | 1,872 (-4%) | 9mo | $285,000 | $152 | 62 |
| 211 Oxford St | 0.65mi | 3/2.0 | 1,840 (-6%) | 1mo | $350,000 | $190 | 55 |
| 6 Stratford Ln | 0.57mi | 3/2.0 | 2,142 (+10%) | 2mo | $311,000 | $145 | 52 |
| 2730 Ozark Hwy | 0.74mi | 3/2.0 | 2,050 (+5%) | 2mo | $260,000 | $127 | 52 |
| 10 Stratford Ln | 0.56mi | 3/2.0 | 1,897 (-3%) | 17mo | $238,000 | $125 | 51 |
| 102 Shadow Ln | 0.35mi | 4/2.0 (+1) | 2,102 (+8%) | 14mo | $270,000 | $128 | 50 |
| 206 Aaron Dr | 0.40mi | 3/2.5 | 2,110 (+8%) | 18mo | $269,500 | $128 | 47 |
| 108 Central Park Cir | 0.68mi | 4/2.5 (+1) | 2,000 (+2%) | 13mo | $347,000 | $174 | 43 |
| 102 Central Park Cir | 0.70mi | 3/2.0 | 1,823 (-7%) | 12mo | $310,000 | $170 | 42 |
| 206 Sonya Dr | 0.39mi | 4/3.0 (+1) | 2,239 (+14%) | 9mo | $390,000 | $174 | 37 |
| 100 Boxwood Dr | 0.48mi | 4/2.5 (+1) | 2,247 (+15%) | 16mo | $318,000 | $142 | 29 |
Match score weights: distance 35% · size 25% · config 20% · recency 20%. Top-matched comps best support the ARV.
Projected returns pro-forma
-3.0% appreciation · 3.92% rent growth · sell at horizon
- IRR
- -21.1%
- Equity multiple
- 0.26×
- Total profit
- $-51,596
- Equity at exit
- $37,276
- IRR
- -13.1%
- Equity multiple
- 0.21×
- Total profit
- $-55,143
- Equity at exit
- $21,615
Cash invested: $70,000 (down + closing). Projections, not guarantees.
Landlord ↔ Tenant lean methodology
- Overall (STATE)
- 90 Strongly Landlord-Friendly
- State Alabama
- 90 Strongly Landlord-Friendly · R+15
- County
- — inherits STATE
- City
- — inherits STATE
ZIP-level market 36330
- Home prices YoY
- -19.4%
- Rents YoY
- 3.9%
- Active inventory
- 444
- Price-to-rent
- 12.8×
Monthly cashflow live
- Estimated rent
- $1,630 medium interval (Pro) →
- Mortgage (P&I)
- −$1,311
- Tax from tax record
- −$69 /mo · $826/yr
- Insurance
- −$104
- HOA
- −$0
- Vacancy / Maint / Mgmt
- −$342
- Net cashflow
- $-196
Break-even live
Sensitivity live
| Price | -10% $-54 | -5% $-125 | +0% $-196 | +5% $-267 | +10% $-338 |
|---|---|---|---|---|---|
| Rent | -10% $-325 | -5% $-260 | +0% $-196 | +5% $-132 | +10% $-67 |
| Rate | -1.0pp $-70 | -0.5pp $-132 | base $-196 | +0.5pp $-261 | +1.0pp $-327 |
UW: 25.0% down · 7.5% · 30yr · 1.5% tax · 5.0% vac · 8.0% maint · 8.0% mgmt
Financing live
Cash to close
- Down payment
- $62,500
- Closing costs
- $7,500
- Reserves months
- —
- Total cash needed
- —
Loan-product check · same deal, 3 products live
Conventional
25% down · 7.5% · 30yr
- Down + closing
- —
- Monthly P&I
- —
- Monthly cashflow
- —
- DSCR
- —
- Eligible?
- —
Personal DTI + credit; lowest rate.
DSCR
20% down · 8.5% · 30yr
- Down + closing
- —
- Monthly P&I
- —
- Monthly cashflow
- —
- DSCR
- —
- Eligible?
- —
No personal income docs; deal must DSCR.
Hard money
10% down · 12.0% · 12mo
- Down + closing
- —
- Monthly P&I
- —
- Monthly cashflow
- —
- DSCR
- —
- Eligible?
- —
Short-term bridge; refi at stabilization.
Rent comps 1 comps
| Address | Beds | Baths | Sqft | Rent | $/sqft | DOM | Units | Dist |
|---|---|---|---|---|---|---|---|---|
| 108 Avalon Ln Enterprise, AL | 3.0 | 2.0 | 1634 | $1,725 | $1.06 | 45d | 1 | 0.97mi |
Listing history 7 events
-
2026-06-05statusdays on market $250,000 Pending 22 DOM
-
2026-06-03days on market $250,000 Active 21 DOM
-
2026-06-02days on market $250,000 Active 20 DOM
-
2026-06-01days on market $250,000 Active 19 DOM
-
2026-05-31days on market $250,000 Active 18 DOM
-
2026-05-30days on market $250,000 Active 17 DOM
-
2026-05-13$250,000 Active 1049-char remark
ⓘ Source: listings_history table (triggers on properties + properties_extension) + one-shot
backfill from property_details.listing_events for pre-trigger history.
Tax reassessment forecast AL · Resets to sale price
- Current annual tax
- $826 · $69/mo
- Projected year-2 tax
- $1,025 · $85/mo
- Expected delta
- +$199/yr (+$17/mo · 24.1%)
ⓘ Screening estimate from a state-policy table — verify with the county assessor before closing.
Climate risk First Street
- Flood 1/10 Low FEMA zone X (unshaded) · 0% chance over 30 yrs
- Wildfire 3/10 Moderate
- Heat 8/10 Severe 7 d/yr ≥106°F today · 19 d/yr by 30 yrs out
- Wind 8/10 Severe 99% chance of damaging wind over 30 yrs
- Air quality 1/10 Low 0 unhealthy d/yr today · 0 by 30 yrs out
Nearby sold comps map
Loading sold comps map…
Walkable amenities ~0.75 mi
Loading nearby amenities…
Taxation est. · year 1
- Rental income
- $19,565
- − Mortgage interest
- −$14,004
- − Property taxes
- −$826
- − Insurance
- −$1,250
- − Repairs & maintenance
- −$1,565
- − Management
- −$1,565
- − Depreciation
- −$7,273
- Taxable loss
- −$6,918
- Est. tax savings @ 24.0%
- +$1,660
- After-tax cash flow
- $-692/yr
For passive investors: Depreciation is non-cash, so a rental often shows a tax loss while cash-flowing — sheltering income. Rental losses are passive: they offset passive income freely, and up to $25,000/yr can offset ordinary (W-2) income if you actively participate and your MAGI is under $100k (phasing out to $0 by $150k); unused losses carry forward. On sale, claimed depreciation is recaptured at up to 25%, and gains may owe capital-gains tax (a 1031 exchange can defer both). Figures are a year-1 estimate at your 24.0% rate — not tax advice; consult a CPA.
Schools (NCES district)
- District
- Enterprise City
- NCES district ID
- 0101320
- Math proficiency
- 40% ▼ -20.00%
- Reading proficiency
- 60% ▲ 4.00%
- Median HH income
- $51,311
- Composite
- 42.83/100
- National rank
- #3136
- State rank
- #12 of 129 in AL
Livability — Enterprise
- Score
- 65/100
- State rank
- #127
- US rank
- #12953
Category grades
Schools grade is shown separately in the Schools card above.
Census & demographics
- Census place
- Enterprise, AL
- County
- Coffee County · 39,557 people
- City population
- 39,557
- Metro
- Enterprise, AL
- Population (ZIP)
- 39,557
- Household income
- $75,765
- Rent vs Own
- Severe rent burden
- 1126.0
Population outlook (Coffee County) Hauer SSP2
- Today (2025)
- 53,133 people
- By 2030
- 53,832 · +1.3%
- By 2040
- 54,504 · +2.6%
- By 2050
- 54,289 · +2.2%
- By 2075
- 51,175 · -3.7%
- By 2100
- 46,793 · -11.9%
Race, ethnicity, and origin ACS 2023
- Neighborhood character
- Diverse neighborhood (Simpson 0.56)
- Race & ethnicity
- White 63% Black 17% Hispanic / Latino 13% Two or more races 9% Asian 1%
- Hispanic origin (detail)
- Mexican 6% Puerto Rican 3%
- Common ancestry
- Italian 3% Lithuanian 2% Serbian 2%
- Foreign-born
- 6% · Canada, Vietnam, South Korea
- Languages at home
- 89% English-only · Spanish 8% German/W. Germanic 2%
Political lean MEDSL · Coffee
- 2024 margin
- Solid R (+57.9) · D 20.7% · R 78.6%
- 2008→2024 swing
- -9.0pp toward R · 2008: -48.9pp · 2024: -57.9pp
- All cycles
- 2024: R+57.9 2020: R+53.1 2016: R+56.7 2012: R+49.4 2008: R+48.9
Not yet ingested
- Civics
- —
Market trends
- HPI YoY
- ▼ -44.44%
- Current HPI
- 184.0163
- Rent YoY
- ▲ 3.92%
- Metro
- Enterprise, AL
- State GDP YoY
- ▲ 2.94%
- F500 in state
- 4
Industry mix (Fortune 500 HQ in AL)
| Industry | F500 HQs | Revenue |
|---|---|---|
| Financial Services | 1 | $8B |
|
||
| Healthcare | 1 | $5B |
|
||
Price history
2 events — show timeline
- 2026-06-04 Pending — WBR
- 2026-05-13 Listed $250,000 WBR
Property tax history
+3.4%/yrLatest (2025): $826 · +6.3% YoY. Source: county tax records.
Cash-flow waterfall
monthlySold comps — $/sqft
last 12 mo · ≤1 miLoading sold comps…