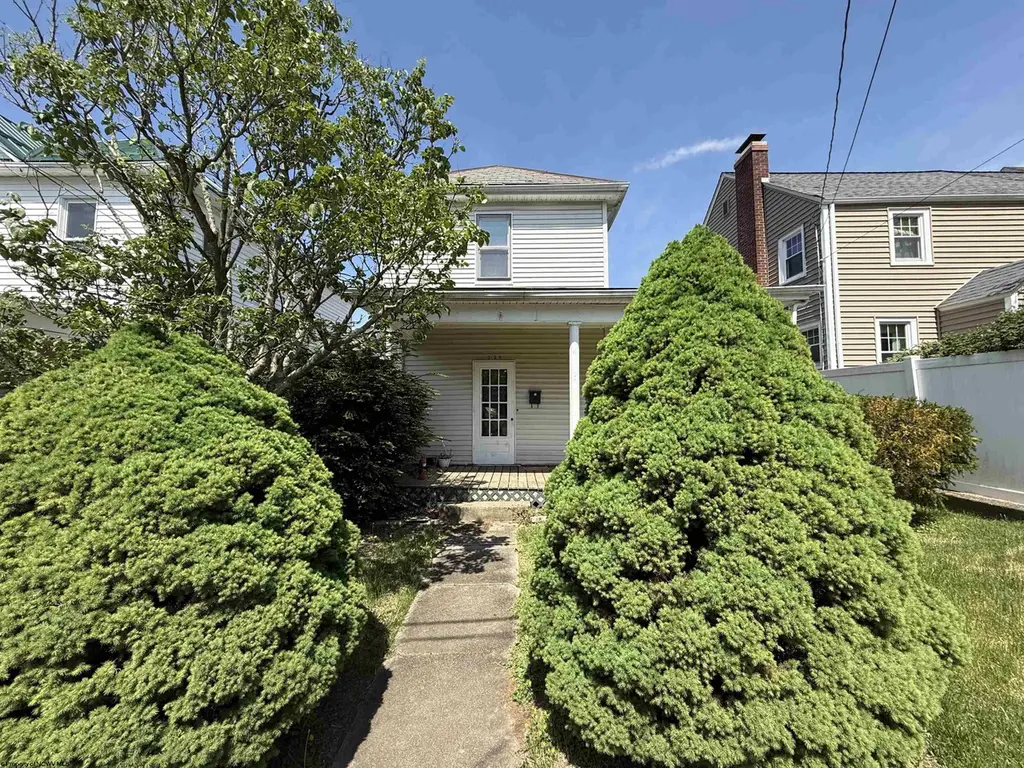
220 Vermont Ave · Clarksburg, WV
Flood risk 1/10 · Minimal
- FEMA flood zone
- X (unshaded)
- Chance of flooding over 30 yrs
- 0.0%
- Est. flood insurance / yr
- $507 – $1,088
Fire risk 1/10 · Minimal
- Est. fire insurance / yr
- $787 – $1,461
Heat risk 4/10 · Minor
- Hot days now (above 97°F)
- 7 days/yr
- Hot days in 30 yrs
- 20 days/yr
Wind risk 1/10 · Minimal
- Chance of severe wind over 30 yrs
- 0.0%
Air-quality risk 2/10 · Minimal
- Unhealthy air days now
- 0 days/yr
- Unhealthy air days in 30 yrs
- 1 days/yr
Risk factors via First Street. Map © Google.
Why this score? — see what drove the B+ grade
The composite is a weighted blend of 9 inputs, each scored 0–100. Each bar is that input's sub-score; the figure is the points it added to the 100-point composite (weight × sub-score).
- Cash flow +30.0/30.0
- ARV discount +15.0/15.0
- 1% rule +10.0/10.0
- DSCR +10.0/10.0
- Livability +4.0/5.0
- Rent growth +3.4/5.0
- Schools +3.0/10.0
- Condition / age +2.5/5.0
- Appreciation +0.0/10.0
$72,000
🖨 Deal sheet 📄 Offer letter ✓ Due diligence
Listing remarks
Make this one your own! This home is situated on a lovely street right off of Route 50. With a little TLC and some imagination, this home could be restored back to its original beauty!
Key facts
- 3,049 sq ft lot
- Garage
- Built 1900
Property features AI
Exterior
- Parking: Detached garage (1 car); Off-street and on-street parking available
- Utilities: Public water; Public sewer
- Home design: Detached single-family residence; 2-story
- Construction: Aluminum siding with frame construction; Shingle roof
- Exterior features: Front porch; Level lot
Interior
- Bedrooms: Total of 5 rooms (bedroom count not separately listed)
- Bathrooms: 1 full bathroom; 1 half bathroom
- Heating & cooling: Forced air heating (natural gas); Central air conditioning
- Interior features: Masonry fireplace; Crawl space basement
Neighborhood map
What this means for you Summary
Snapshot
- This is a 3-bed/1.0-bath single-family listed at $72k.
Deal economics
- At list price, monthly cash flow is $387 ($5k/yr) — positive.
- The deal already cash-flows at list — no discount required.
- Meets the 1% rule at list price ($1k rent vs $72k).
- Recommended offer: $70k (3.0% below list) — sets the bar for market timing.
- Cap rate 12.7% vs local median 6.8% in Clarksburg — top-decile yield for the area; either an underpriced asset or a hidden risk that comps aren't pricing in. Stress-test before assuming the spread holds.
Location & tenants
- Location reads 81/100 on livability (#11 in WV, #1,521 nationally) — a professional / high-income tenant draw. Strengths: commute A+, cost of living A+, housing A+; Watch: amenities C-, crime D+, employment D-.
- Harrison County Schools (town): math 29% / reading 43% proficiency, ranked #12 of 55 in WV (top 22%) — families likely to look elsewhere, expect single-tenant / working-renter base with shorter leases.
- Zoned schools: Robert C Byrd High School (math 22% / reading 52%, grade F, #32 of 110 statewide, top 34%, 765 students, 0% FRL) — zoned schools average 0% FRL vs 43% district-wide (43 pts lower); this property's tenant base skews higher-income than the district average.
- Market conditions: Rents rising (+3.6%/yr); 56 active listings in the ZIP; 84 units permitted in Harrison County in 2024 (5 in 5+ unit buildings).
Forward outlook
- Local home prices are declining (-3.0%/yr); year-one equity from $498 of loan paydown is wiped out by about $2k of value loss. Plan a longer hold.
- Harrison County population projected at -11% by 2050 — secular population decline; favor cash flow + early exit over multi-decade hold.
- At projected returns (-3.0% appreciation + 3.6% rent growth), your $20k cash investment doubles in ~6 years — after that, you're playing with house money.
Negotiation context
- It's been on market 36 days — a 3% lower offer ($70k) is reasonable based on typical stale-listing flexibility.
- Current owner paid $53k; 36% above their basis — modest negotiation headroom, anchor on the comps not their cost.
Risks & watch-outs
- Watch-outs: built in 1900 — expect roof / HVAC / electrical / plumbing capex.
Questions for the listing agent
- It's been on market 36 days. Have you received any prior offers? Is the seller open to a 3% concession, seller financing, or rate buy-down credit?
- Built in 1900 — when were the roof, HVAC, electrical panel, plumbing, and water heater last replaced?
- Is there a deadline driving the sale (1031 exchange, divorce, estate, relocation)? That informs how much negotiation room exists.
- Schools are F-rated, which usually means shorter tenancies and higher turnover. Who's the typical renter profile here, and what's been the actual vacancy rate?
- Crime grade is D in this area — have there been break-ins, vandalism, or insurance claims at this property in the last 3 years? What carrier currently insures it and at what premium?
- What's the average days-on-market for RENTAL listings here right now (not sales)? A rising rental-DOM trend means longer vacancies and softer asking-rent achievability than the comps imply.
- What's the recent tenant-quality profile in this submarket — average credit score on applications, eviction rate, late-payment / NSF rate, and stable-employment percentage? A property-management company in the area should have these aggregated.
- How much new for-sale + rental construction is in the pipeline within 1–3 miles? Heavy new supply typically softens prices + rents 12–24 months out; constrained supply supports both.
Investment metrics
- 1% rule
- 1.63% ✓
- Cap rate
- 12.74%
- Cash-on-cash
- 23.01%
- DSCR
- 2.02
- GRM
- 5.1
CMA / ARV
- ARV (on-the-fly)
- $125,304
- Comps found
- 12
Show comp detail 12 sales within ~0.75 mi
| Address | Dist | Beds/Ba | Sqft | Sold | Price | $/sf | Match |
|---|---|---|---|---|---|---|---|
| 315 Monticello Ave | 0.23mi | 3/1.5 | 1,350 (-1%) | 3mo | $16,000 | $12 | 84 |
| 148 Jackson | 0.46mi | 3/1.5 | 1,384 (+2%) | 0mo | $124,500 | $90 | 73 |
| 306 Hedge | 0.25mi | 3/1.5 | 1,292 (-5%) | 9mo | $164,900 | $128 | 71 |
| 196 Buena Vis | 0.42mi | 3/1.0 | 1,335 (-2%) | 8mo | $170,000 | $127 | 70 |
| 209 Grant St | 0.48mi | 3/1.0 | 1,295 (-5%) | 1mo | $119,000 | $92 | 68 |
| 306 Elm St | 0.17mi | 3/1.5 | 1,535 (+13%) | 3mo | $180,000 | $117 | 66 |
| 107 S Florence St | 0.46mi | 4/1.0 (+1) | 1,305 (-4%) | 7mo | $40,000 | $31 | 60 |
| 201 Buena Vis | 0.41mi | 3/1.0 | 1,254 (-8%) | 9mo | $20,000 | $16 | 60 |
| 113 Buckhannon | 0.17mi | 2/2.0 (-1) | 1,187 (-13%) | 2mo | $38,000 | $32 | 60 |
| 1205 E Main St | 0.60mi | 3/2.0 | 1,188 (-13%) | 0mo | $160,000 | $135 | 46 |
| 324 Fowler Ave | 0.71mi | 4/1.5 (+1) | 1,250 (-8%) | 3mo | $60,000 | $48 | 44 |
| 1629 Gregorys Rd | 0.61mi | 3/1.5 | 1,160 (-15%) | 11mo | $156,000 | $134 | 36 |
Match score weights: distance 35% · size 25% · config 20% · recency 20%. Top-matched comps best support the ARV.
Projected returns pro-forma
-3.0% appreciation · 3.62% rent growth · sell at horizon
- IRR
- 16.8%
- Equity multiple
- 1.68×
- Total profit
- $13,734
- Equity at exit
- $10,735
- IRR
- 25.8%
- Equity multiple
- 3.33×
- Total profit
- $46,906
- Equity at exit
- $6,225
Cash invested: $20,160 (down + closing). Projections, not guarantees.
Landlord ↔ Tenant lean methodology
- Overall (STATE)
- 83 Strongly Landlord-Friendly
- State West Virginia
- 83 Strongly Landlord-Friendly · R+22
- County
- — inherits STATE
- City
- — inherits STATE
ZIP-level market 26301
- Home prices YoY
- -26.4%
- Rents YoY
- 3.6%
- Active inventory
- 56
- Price-to-rent
- 5.1×
Monthly cashflow live
- Estimated rent
- $1,174 medium interval (Pro) →
- Mortgage (P&I)
- −$378
- Tax from tax record
- −$134 /mo · $1,604/yr
- Insurance
- −$30
- HOA
- −$0
- Vacancy / Maint / Mgmt
- −$247
- Net cashflow
- $387
Break-even live
UW: 25.0% down · 7.5% · 30yr · 1.5% tax · 5.0% vac · 8.0% maint · 8.0% mgmt
Financing live
Cash to close
- Down payment
- $18,000
- Closing costs
- $2,160
- Reserves months
- —
- Total cash needed
- —
Loan-product check · same deal, 3 products live
Conventional
25% down · 7.5% · 30yr
- Down + closing
- —
- Monthly P&I
- —
- Monthly cashflow
- —
- DSCR
- —
- Eligible?
- —
Personal DTI + credit; lowest rate.
DSCR
20% down · 8.5% · 30yr
- Down + closing
- —
- Monthly P&I
- —
- Monthly cashflow
- —
- DSCR
- —
- Eligible?
- —
No personal income docs; deal must DSCR.
Hard money
10% down · 12.0% · 12mo
- Down + closing
- —
- Monthly P&I
- —
- Monthly cashflow
- —
- DSCR
- —
- Eligible?
- —
Short-term bridge; refi at stabilization.
Listing history 11 events
-
2026-06-09days on market $72,000 Active 36 DOM
-
2026-06-08days on market $72,000 Active 35 DOM
-
2026-06-07days on market $72,000 Active 34 DOM
-
2026-06-05days on market $72,000 Active 31 DOM
-
2026-06-03days on market $72,000 Active 30 DOM
-
2026-06-02days on market $72,000 Active 29 DOM
-
2026-06-01days on market $72,000 Active 28 DOM
-
2026-05-31days on market $72,000 Active 27 DOM
-
2026-05-30days on market $72,000 Active 26 DOM
-
2026-05-04$72,000 Active
-
1990-09-25soldstatus $52,800
ⓘ Source: listings_history table (triggers on properties + properties_extension) + one-shot
backfill from property_details.listing_events for pre-trigger history.
Tax reassessment forecast WV · Resets to sale price
- Current annual tax
- $1,604 · $134/mo
- Projected year-2 tax
- $1,604 · $134/mo
- Expected delta
- $0/yr ($0/mo · 0.0%)
ⓘ Screening estimate from a state-policy table — verify with the county assessor before closing.
Climate risk First Street
- Flood 1/10 Low FEMA zone X (unshaded) · 0% chance over 30 yrs
- Wildfire 1/10 Low
- Heat 4/10 Moderate 7 d/yr ≥97°F today · 20 d/yr by 30 yrs out
- Wind 1/10 Low 0% chance of damaging wind over 30 yrs
- Air quality 2/10 Low 0 unhealthy d/yr today · 1 by 30 yrs out
Nearby sold comps map
Loading sold comps map…
Walkable amenities ~0.75 mi
Loading nearby amenities…
Taxation est. · year 1
- Rental income
- $14,093
- − Mortgage interest
- −$4,033
- − Property taxes
- −$1,604
- − Insurance
- −$360
- − Repairs & maintenance
- −$1,127
- − Management
- −$1,127
- − Depreciation
- −$2,095
- Taxable income
- $3,747
- Est. tax owed @ 24.0%
- −$899
- After-tax cash flow
- $3,739/yr
For passive investors: Depreciation is non-cash, so a rental often shows a tax loss while cash-flowing — sheltering income. Rental losses are passive: they offset passive income freely, and up to $25,000/yr can offset ordinary (W-2) income if you actively participate and your MAGI is under $100k (phasing out to $0 by $150k); unused losses carry forward. On sale, claimed depreciation is recaptured at up to 25%, and gains may owe capital-gains tax (a 1031 exchange can defer both). Figures are a year-1 estimate at your 24.0% rate — not tax advice; consult a CPA.
Schools (NCES district)
- District
- Harrison County Schools
- NCES district ID
- 5400510
- Math proficiency
- 29% ▼ -10.00%
- Reading proficiency
- 43% ▼ -3.00%
- Median HH income
- $43,269
- Composite
- 30.48/100
- National rank
- #6222
- State rank
- #12 of 55 in WV
Livability — Clarksburg
- Score
- 81/100
- State rank
- #11
- US rank
- #1521
Category grades
Schools grade is shown separately in the Schools card above.
Census & demographics
- Census place
- Clarksburg, WV
- County
- Harrison County · 44,316 people
- City population
- 28,716
- Metro
- Clarksburg, WV
- Population (ZIP)
- 28,716
- Household income
- $49,816
- Rent vs Own
- Severe rent burden
- 765.0
Population outlook (Harrison County) Hauer SSP2
- Today (2025)
- 67,273 people
- By 2030
- 65,963 · -1.9%
- By 2040
- 63,033 · -6.3%
- By 2050
- 59,999 · -10.8%
- By 2075
- 52,524 · -21.9%
- By 2100
- 42,654 · -36.6%
Race, ethnicity, and origin ACS 2023
- Neighborhood character
- Predominantly White (92%)
- Race & ethnicity
- White 92% Two or more races 5% Hispanic / Latino 2% Black 2%
- Common ancestry
- Slovak 2% Serbian 2% Lithuanian 1%
- Foreign-born
- 0%
- Languages at home
- 98% English-only · Other Indo-European 1%
Political lean MEDSL · Harrison
- 2024 margin
- Solid R (+41.0) · D 28.5% · R 69.4% · Other 2.1%
- 2008→2024 swing
- -27.6pp toward R · 2008: -13.3pp · 2024: -41.0pp
- All cycles
- 2024: R+41.0 2020: R+37.6 2016: R+39.5 2012: R+23.5 2008: R+13.3
Not yet ingested
- Civics
- —
Market trends
- HPI YoY
- ▼ -53.70%
- Current HPI
- 149.308
- Rent YoY
- ▲ 3.62%
- Metro
- Clarksburg, WV
- State GDP YoY
- —
- F500 in state
- 0
Price history
+36.4% since first listed2 events — show timeline
- 2026-05-04 Listed $72,000 NCWVREIN
- 1990-09-25 Sold (Public Records) $52,800 Public Records
Property tax history
+2.7%/yrLatest (2025): $1,604 · +7.9% YoY. Source: county tax records.
Cash-flow waterfall
monthlySold comps — $/sqft
last 12 mo · ≤1 miLoading sold comps…