 Multi-family
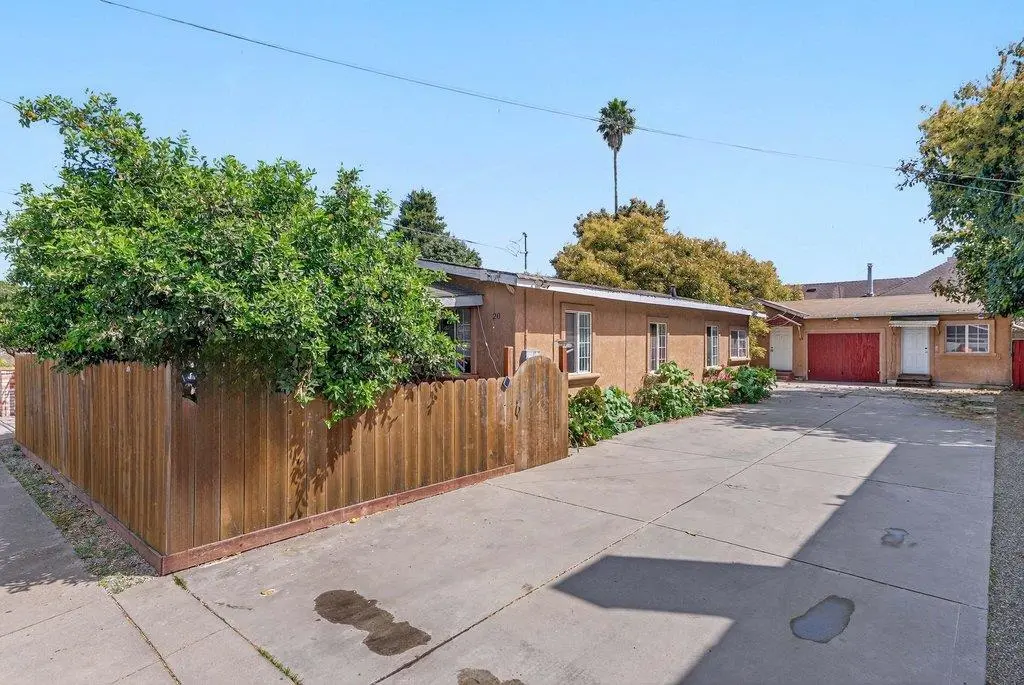
20 Gonda St · Pajaro, CA
Flood risk 6/10 · Moderate
- FEMA flood zone
- AO
- Chance of flooding over 30 yrs
- 0.72%
- Est. flood insurance / yr
- $848 – $2,087
Fire risk 1/10 · Minimal
- Est. fire insurance / yr
- $659 – $1,223
Heat risk 3/10 · Minor
- Hot days now (above 86°F)
- 7 days/yr
- Hot days in 30 yrs
- 14 days/yr
Wind risk 1/10 · Minimal
- Chance of severe wind over 30 yrs
- —
Air-quality risk 6/10 · Moderate
- Unhealthy air days now
- 8 days/yr
- Unhealthy air days in 30 yrs
- 9 days/yr
Risk factors via First Street. Map © Google.
Why this score? — see what drove the D- grade
The composite is a weighted blend of 9 inputs, each scored 0–100. Each bar is that input's sub-score; the figure is the points it added to the 100-point composite (weight × sub-score).
- Cash flow +9.4/30.0
- ARV discount +7.5/15.0
- Schools +6.5/10.0
- Rent growth +4.2/5.0
- 1% rule +2.7/10.0
- Livability +2.7/5.0
- DSCR +2.6/10.0
- Condition / age +2.5/5.0
- Appreciation +0.0/10.0
$765,000
🖨 Deal sheet 📄 Offer letter ✓ Due diligence
Multi-family units
County records classify this as Multi-Family (2-4 Unit). Listing-text estimate: 1 unit. estimate disagrees with records
Listing remarks MLS
Own a steady investment property in the heart of Pajaro on a quiet street. Your tenants will enjoy mature avocado trees, privacy, and gated yards with ample parking. The separate units include a 3bed/1bath home in front and the building plus garage/storage in the back. One unit is newer and shows nicely. The has been 0% Vacancy for many years. Don't miss this opportunity in a vibrant community where the soil is rich but your assets grow richer! Please do not disturb tenants.
Key facts
- 5,227 sq ft lot
- Garage
- Built 1926
Property features AI
Finance
- Other: Living area reported as 1,645
- Financial info: Annual rental income approximately $52,800; Annual gross income approximately $52,800; Gross scheduled income approximately $52,800; Total annual expenses approximately $14,715; Gross rent multiplier about 14.94; Unit rents: one unit at $2,300/month, one unit at $2,100/month; Tenant responsible for miscellaneous/other, electric, heating and water
Exterior
- Parking: Off-street parking; 1-car garage; 6 parking spaces (total)
- Utilities: Public water; Public sewer; Natural gas; Primary electric meter; Primary gas meter; Primary water meter
- Home design: Individual ownership; Single-story buildings; Two buildings on the property; Two total units
- Construction: Concrete slab and raised foundation
- Exterior features: Composition roof; Zoning: HDR20
Interior
- Bedrooms: One unit with 3 bedrooms; One unit with 2 bedrooms
- Flooring: Tile
- Bathrooms: Each unit has 1 full bathroom
- Interior features: Tile flooring
Neighborhood map
What this means for you Summary
Snapshot
- This is a 3-bed/1.0-bath multifamily listed at $765k.
Deal economics
- At list price, monthly cash flow is $-666 ($-8k/yr) — negative.
- To cash-flow at today's rent, offer at most $647k (15.4% below list).
- To meet the 1% rule (rent ≥ 1% of price), the offer needs to be $588k (23.1% below list).
- Recommended offer: $588k (23.1% below list) — sets the bar for 1% rule.
Location & tenants
- Location reads 54/100 on livability (#907 in CA) — a working-class tenant base; expect higher turnover. Strengths: commute A+; Watch: employment D+, schools F, amenities F.
- Pajaro Valley Unified (urban): math 75% / reading 75% proficiency, ranked #43 of 517 in CA (top 8%) — strong family-tenant draw, lease renewals of 3-5y typical; 67% free/reduced lunch — lower-income household profile, screen leases tightly.
- Market conditions: Rents rising fast (+6.6%/yr); 122 active listings in the ZIP; 1 comparable units currently listed for rent nearby; solid renter incomes; 530 units permitted in Monterey County in 2024 (50 in 5+ unit buildings).
- At $5,881/mo this rent would consume 77% of the median local household income ($91k/yr) (locally 3051% of renters already pay >50% of income on rent) — very limited rent-growth headroom before tenants either downsize or default.
Forward outlook
- Local home prices are declining (-3.0%/yr); year-one equity from $5k of loan paydown is wiped out by about $23k of value loss. Plan a longer hold.
- Monterey County population projected at +10% by 2050 — modest demand growth; plan on rents tracking national, not racing it.
Negotiation context
- It's been on market 73 days — a 6% lower offer ($719k) is reasonable based on typical stale-listing flexibility.
- 6 sale attempts since 22y ago; this cycle's ask has dropped $64k (8%) from the opening price — seller is motivated, your offer sets the floor, not the list.
- Current owner paid $513k; 49% above their basis — modest negotiation headroom, anchor on the comps not their cost.
Risks & watch-outs
- Watch-outs: flood insurance adds $122/mo; built in 1926 — expect roof / HVAC / electrical / plumbing capex.
- Climate carrying-cost: in FEMA flood zone AO (mandatory federal flood insurance) — expect insurance premiums to compound above CPI over the hold.
Questions for the listing agent
- What do current leases actually rent for vs. the listed asking? Can we see a recent rent roll and the last 12 months of T-12 income?
- It's been on market 73 days. Have you received any prior offers? Is the seller open to a 23% concession, seller financing, or rate buy-down credit?
- Built in 1926 — when were the roof, HVAC, electrical panel, plumbing, and water heater last replaced?
- What's the actual annual flood-insurance premium (NFIP or private), and is the property in a SFHA with mandatory coverage?
- Why hasn't it sold? Are there any deal-killer items the seller is aware of (foundation, flood, title, zoning, code violations)?
- Is there a deadline driving the sale (1031 exchange, divorce, estate, relocation)? That informs how much negotiation room exists.
- Schools are F-rated, which usually means shorter tenancies and higher turnover. Who's the typical renter profile here, and what's been the actual vacancy rate?
- The area grade is low — what's the realistic commute time and amenity access for the typical tenant pool here? Any planned neighborhood developments (good or bad) we should know about?
- What's the average days-on-market for RENTAL listings here right now (not sales)? A rising rental-DOM trend means longer vacancies and softer asking-rent achievability than the comps imply.
- What's the recent tenant-quality profile in this submarket — average credit score on applications, eviction rate, late-payment / NSF rate, and stable-employment percentage? A property-management company in the area should have these aggregated.
- How much new apartment / multifamily construction is in the pipeline within 1–3 miles? Heavy new supply (>2% of stock underway) typically softens rents 12–24 months out; light construction supports rent growth.
Investment metrics
- 1% rule
- 0.77% ✗
- Cap rate
- 5.44%
- Cash-on-cash
- -3.05%
- DSCR
- 0.86
- GRM
- 10.8
CMA / ARV
No comps found within radius.
Projected returns pro-forma
-3.0% appreciation · 6.64% rent growth · sell at horizon
- IRR
- -18.6%
- Equity multiple
- 0.33×
- Total profit
- $-143,973
- Equity at exit
- $114,064
- IRR
- -5.0%
- Equity multiple
- 0.62×
- Total profit
- $-80,846
- Equity at exit
- $66,143
Cash invested: $214,200 (down + closing). Projections, not guarantees.
Landlord ↔ Tenant lean methodology
- Overall (STATE)
- 18 Strongly Tenant-Friendly
- State California
- 18 Strongly Tenant-Friendly · D+13
- County
- — inherits STATE
- City
- — inherits STATE
ZIP-level market 95076
- Rents YoY
- 6.6%
- Active inventory
- 122
- Price-to-rent
- 20.3×
Monthly cashflow live
- Estimated rent
- $5,881 medium interval (Pro) →
- Mortgage (P&I)
- −$4,012
- Tax from tax record
- −$860 /mo · $10,315/yr
- Insurance
- −$319
- Flood insurance flood zone
- −$122 /mo · $1,468/yr
- HOA
- −$0
- Vacancy / Maint / Mgmt
- −$1,235
- Net cashflow
- $-666
Break-even live
2-unit breakdown (identical units grouped — click to expand)
| Units | Beds | Baths | Est. rent |
|---|---|---|---|
| 1× unit | 3 | 1 | $3,146 |
| 1× unit | 2 | 1 | $2,734 |
| Total (2 units) | $5,881 | ||
UW: 25.0% down · 7.5% · 30yr · 1.5% tax · 5.0% vac · 8.0% maint · 8.0% mgmt
Financing live
Cash to close
- Down payment
- $191,250
- Closing costs
- $22,950
- Reserves months
- —
- Total cash needed
- —
Loan-product check · same deal, 3 products live
Conventional
25% down · 7.5% · 30yr
- Down + closing
- —
- Monthly P&I
- —
- Monthly cashflow
- —
- DSCR
- —
- Eligible?
- —
Personal DTI + credit; lowest rate.
DSCR
20% down · 8.5% · 30yr
- Down + closing
- —
- Monthly P&I
- —
- Monthly cashflow
- —
- DSCR
- —
- Eligible?
- —
No personal income docs; deal must DSCR.
Hard money
10% down · 12.0% · 12mo
- Down + closing
- —
- Monthly P&I
- —
- Monthly cashflow
- —
- DSCR
- —
- Eligible?
- —
Short-term bridge; refi at stabilization.
Rent comps 1 comps
| Address | Beds | Baths | Sqft | Rent | $/sqft | DOM | Units | Dist |
|---|---|---|---|---|---|---|---|---|
| 558 Main St Watsonville, CA | 2.0 | 1.0–2.0 | 732 | $3,650 | $4.98 | 12d | 14 | 0.86mi |
Listing history 34 events
-
2026-06-18days on market $765,000 Active 73 DOM
-
2026-06-17days on market $765,000 Active 72 DOM
-
2026-06-16days on market $765,000 Active 71 DOM
-
2026-06-15days on market $765,000 Active 70 DOM
-
2026-06-14days on market $765,000 Active 68 DOM
-
2026-06-13days on market $765,000 Active 67 DOM
-
2026-06-10days on market $765,000 Active 65 DOM
-
2026-06-09days on market $765,000 Active 64 DOM
-
2026-06-09price $765,000 Active 63 DOM
-
2026-06-08days on market $789,000 Active 63 DOM
-
2026-06-07days on market $789,000 Active 62 DOM
-
2026-06-05days on market $789,000 Active 59 DOM
-
2026-06-03days on market $789,000 Active 58 DOM
-
2026-06-02days on market $789,000 Active 57 DOM
-
2026-06-01days on market $789,000 Active 56 DOM
-
2026-05-31days on market $789,000 Active 55 DOM
-
2026-05-30days on market $789,000 Active 54 DOM
-
2026-05-09price $789,000 479-char remark
Show marketing remark (479 chars)
Own a steady investment property in the heart of Pajaro on a quiet street. Your tenants will enjoy mature avocado trees, privacy, and gated yards with ample parking. The separate units include a 3bed/1bath home in front and the building plus garage/storage in the back. One unit is newer and shows nicely. The has been 0% Vacancy for many years. Don't miss this opportunity in a vibrant community where the soil is rich but your assets grow richer! Please do not disturb tenants.
-
2026-04-06$829,000 Active 479-char remark
Show marketing remark (479 chars)
Own a steady investment property in the heart of Pajaro on a quiet street. Your tenants will enjoy mature avocado trees, privacy, and gated yards with ample parking. The separate units include a 3bed/1bath home in front and the building plus garage/storage in the back. One unit is newer and shows nicely. The has been 0% Vacancy for many years. Don't miss this opportunity in a vibrant community where the soil is rich but your assets grow richer! Please do not disturb tenants.
-
2026-03-31historical
-
2016-02-11historical
-
2015-09-27historical
-
2015-03-05$499,000
-
2013-09-27$499,000
-
2004-07-07soldstatus $513,000
-
2004-07-07historical
-
2004-06-30soldstatus $513,000
-
2004-05-24soldstatus $513,000
-
2004-02-19$510,000
-
2004-02-19$510,000
-
1997-07-18soldstatus $80,000
-
1961-10-02soldstatus $5,000
ⓘ Source: listings_history table (triggers on properties + properties_extension) + one-shot
backfill from property_details.listing_events for pre-trigger history.
Tax reassessment forecast CA · Resets to sale price
- Current annual tax
- $10,315 · $860/mo
- Projected year-2 tax
- $10,315 · $860/mo
- Expected delta
- $0/yr ($0/mo · 0.0%)
ⓘ Screening estimate from a state-policy table — verify with the county assessor before closing.
Climate risk First Street
- Flood 6/10 Major FEMA zone AO · 72% chance over 30 yrs
- Wildfire 1/10 Low
- Heat 3/10 Moderate 7 d/yr ≥86°F today · 14 d/yr by 30 yrs out
- Wind 1/10 Low
- Air quality 6/10 Major 8 unhealthy d/yr today · 9 by 30 yrs out
Nearby sold comps map
Loading sold comps map…
Walkable amenities ~0.75 mi
Loading nearby amenities…
Taxation est. · year 1
- Rental income
- $70,572
- − Mortgage interest
- −$42,852
- − Property taxes
- −$10,315
- − Insurance
- −$5,292
- − Repairs & maintenance
- −$5,646
- − Management
- −$5,646
- − Depreciation
- −$22,255
- Taxable loss
- −$21,433
- Est. tax savings @ 24.0%
- +$5,144
- After-tax cash flow
- $-2,852/yr
For passive investors: Depreciation is non-cash, so a rental often shows a tax loss while cash-flowing — sheltering income. Rental losses are passive: they offset passive income freely, and up to $25,000/yr can offset ordinary (W-2) income if you actively participate and your MAGI is under $100k (phasing out to $0 by $150k); unused losses carry forward. On sale, claimed depreciation is recaptured at up to 25%, and gains may owe capital-gains tax (a 1031 exchange can defer both). Figures are a year-1 estimate at your 24.0% rate — not tax advice; consult a CPA.
Schools (NCES district)
- District
- Pajaro Valley Unified
- NCES district ID
- 0629490
- Math proficiency
- 75% ▲ 52.00%
- Reading proficiency
- 75% ▲ 42.00%
- Median HH income
- $60,619
- Composite
- 64.53/100
- National rank
- #537
- State rank
- #43 of 517 in CA
Livability — Pajaro
- Score
- 54/100
- State rank
- #907
- US rank
- #24040
Category grades
Schools grade is shown separately in the Schools card above.
Census & demographics
- Census place
- Pajaro, CA
- County
- Santa Cruz County · 225,113 people
- Metro
- Santa Cruz-Watsonville, CA
- Population (ZIP)
- 82,806
- Household income
- $91,099
- Rent vs Own
- Severe rent burden
- 3051.0
Population outlook (Monterey County) Hauer SSP2
- Today (2025)
- 458,436 people
- By 2030
- 469,418 · +2.4%
- By 2040
- 489,615 · +6.8%
- By 2050
- 506,696 · +10.5%
- By 2075
- 531,048 · +15.8%
- By 2100
- 519,153 · +13.2%
Race, ethnicity, and origin ACS 2023
- Neighborhood character
- Predominantly Hispanic (72%)
- Race & ethnicity
- Hispanic / Latino 72% White 22% Two or more races 19% Asian 2% Native American 2%
- Hispanic origin (detail)
- Mexican 69%
- Common ancestry
- Russian 2% Slovak 1% Italian 1%
- Foreign-born
- 32% · Canada
- Languages at home
- 35% English-only · Spanish 61% Other Indo-European 1% Arabic 1%
Political lean MEDSL · Monterey
- 2024 margin
- Strong D (+29.9) · D 63.4% · R 33.5% · Other 3.0%
- 2008→2024 swing
- -8.4pp toward R · 2008: 38.3pp · 2024: 29.9pp
- All cycles
- 2024: D+29.9 2020: D+41.3 2016: D+39.7 2012: D+33.9 2008: D+38.3
Not yet ingested
- Civics
- —
Market trends
- HPI YoY
- ▼ -883.52%
- Current HPI
- 273.5604
- Rent YoY
- ▲ 6.64%
- Metro
- Santa Cruz-Watsonville, CA
- State GDP YoY
- ▲ 3.21%
- F500 in state
- 116
Industry mix (Fortune 500 HQ in CA)
| Industry | F500 HQs | Revenue |
|---|---|---|
| Technology | 27 | $1,492B |
|
||
| Financial Services | 3 | $174B |
|
||
| Retail | 3 | $44B |
|
||
| Insurance | 3 | $26B |
|
||
| Media / Entertainment | 2 | $115B |
|
||
| Pharmaceuticals / Biotech | 2 | $62B |
|
||
Price history
+15680.0% since first listed17 events — show timeline
- 2026-05-09 Price Changed $789,000 bridgeMLS, Bay East AOR, or Contra Costa AOR
- 2026-05-09 Price Changed $789,000 MLSListings
- 2026-04-06 Listed $829,000 MLSListings
- 2026-04-06 Listed $829,000 bridgeMLS, Bay East AOR, or Contra Costa AOR
- 2026-03-31 Listing Removed — bridgeMLS, Bay East AOR, or Contra Costa AOR
- 2016-02-11 Listing Removed — SDMLS
- 2015-09-27 Listing Removed — SDMLS
- 2015-03-05 Listed $499,000 SDMLS
- 2013-09-27 Listed $499,000 SDMLS
- 2004-07-07 Listing Removed — MLSListings
- 2004-07-07 Sold (MLS) $513,000 bridgeMLS, Bay East AOR, or Contra Costa AOR
- 2004-06-30 Sold (Public Records) $513,000 Public Records
- 2004-05-24 Sold (MLS) $513,000 MLSListings
- 2004-02-19 Listed $510,000 MLSListings
- 2004-02-19 Listed $510,000 bridgeMLS, Bay East AOR, or Contra Costa AOR
- 1997-07-18 Sold (Public Records) $80,000 Public Records
- 1961-10-02 Sold (Public Records) $5,000 Public Records
Property tax history
+3.1%/yrLatest (2025): $10,315 · +10.8% YoY. Source: county tax records.
Cash-flow waterfall
monthlySold comps — $/sqft
last 12 mo · ≤1 miLoading sold comps…