2220 Battery Park Rd · Chesapeake, VA
Flood risk 4/10 · Minor
- FEMA flood zone
- X (unshaded)
- Chance of flooding over 30 yrs
- 0.13%
- Est. flood insurance / yr
- $507 – $1,088
Fire risk 1/10 · Minimal
- Est. fire insurance / yr
- $666 – $1,236
Heat risk 9/10 · Severe
- Hot days now (above 106°F)
- 7 days/yr
- Hot days in 30 yrs
- 16 days/yr
Wind risk 8/10 · Major
- Chance of severe wind over 30 yrs
- 80.0%
Air-quality risk 5/10 · Moderate
- Unhealthy air days now
- 6 days/yr
- Unhealthy air days in 30 yrs
- 7 days/yr
Risk factors via First Street. Map © Google.
Why this score? — see what drove the F grade
The composite is a weighted blend of 9 inputs, each scored 0–100. Each bar is that input's sub-score; the figure is the points it added to the 100-point composite (weight × sub-score).
- Cash flow +7.1/30.0
- Schools +5.8/10.0
- ARV discount +4.9/15.0
- Rent growth +4.0/5.0
- Livability +3.5/5.0
- Condition / age +2.5/5.0
- DSCR +1.3/10.0
- 1% rule +1.1/10.0
- Appreciation +0.0/10.0
$419,900
🖨 Deal sheet (PDF) 📄 Offer letter ✓ Due diligence
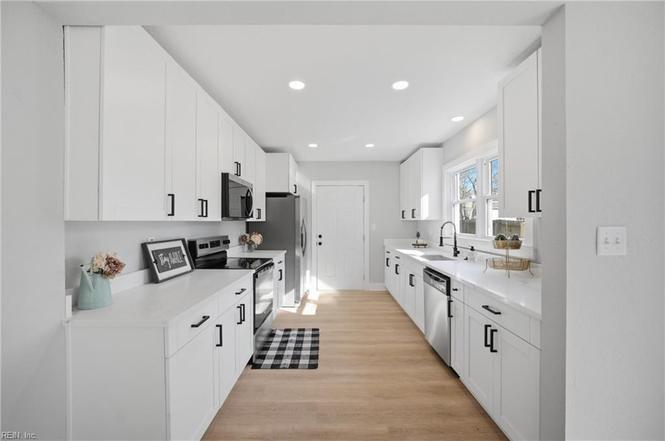
Listing remarks
Hard to know where to start with this one! Large 1/3~ acre lot with extensively renovated 6 bedroom home with tons of room and style. Ample driveway includes new concrete that leads to over 700 sq ft of attached garage space. Awesome setup for workshop, cave, etc. All new interior cosmetics including lvp and carpet flooring, fresh paint and all new fixtures. Bathrooms completely remodeled. Gorgeous kitchen with quartz tops, full stainless appliance package. New electric fireplace in great room. 3 bedrooms including primary on the 1st floor and 3 bedrooms on the 2nd floor. Peace of mind with new HVAC, architectural roof, and water heater, the backup generator works but conveys as is. Windows
Key facts
- Workshop setup
- Remodeled bathrooms
- 0.32 acre lot
Tags
Property features AI
Finance
- Other: Lot approx. 0.32 acre (lot dimensions: 102 x 149 x 93 x 138)
- HOA & community: No HOA fees listed
Exterior
- Parking: Attached garage with space for 3+ cars; Oversized garage; Multiple-car parking; Driveway parking
- Utilities: City/County water; City/County sewer; Electric water heater
- Home design: Detached property; Cottage / Transitional style; 2 stories; River view
- Construction: Vinyl siding; Asphalt shingle roof; Crawl foundation; Rehabilitated
- Exterior features: Deck; Storage shed; Back yard with privacy wood fence
Interior
- Kitchen: Electric range; Microwave; Dishwasher; Refrigerator
- Bedrooms: First-floor master bedroom; Bedroom and full bathroom on first floor
- Flooring: Carpet; Laminate
- Bathrooms: 2 full bathrooms; 1 half bathroom
- Heating & cooling: Heat pump heating; Electric heating; Central air conditioning
- Interior features: Backup generator; Ceiling fan(s); Garage door opener; Wood-burning fireplace; Primary bathroom with double sink; Walk-in closet(s)
- Laundry & utility: Washer hookup; Dryer hookup; Main floor laundry; Utility room
Neighborhood map
What this means for you Summary
Snapshot
- This is a 3-bed/1.0-bath single-family listed at $420k.
Deal economics
- At list price, monthly cash flow is $-599 ($-7k/yr) — negative.
- To cash-flow at today's rent, offer at most $314k (25.2% below list).
- To meet the 1% rule (rent ≥ 1% of price), the offer needs to be $257k (38.9% below list).
- Recommended offer: $257k (38.9% below list) — sets the bar for 1% rule.
- Cap rate 4.6% vs local median 3.7% in Chesapeake — meaningfully above typical; check what's discounted (condition, days-on-market, listing class) to confirm the premium yield is real.
Location & tenants
- Location reads 70/100 on livability (#236 in VA) — a middle-class / working-renter tenant base. Strengths: employment A+, housing A+; Watch: crime C-, cost of living C-, amenities F.
- Chesapeake City Public School District (suburban): math 58% / reading 74% proficiency, ranked #31 of 131 in VA (top 24%) — acceptable for families but not a draw, mixed tenant base, ~2y average lease.
- Zoned schools: G.A. Treakle Elementary (math 47% / reading 56%, grade C-, #728 of 1,108 statewide, top 66%, 421 students, 93% FRL); Deep Creek Middle (math 30% / reading 64%, grade D+, #257 of 342 statewide, top 77%, 770 students, 43% FRL); Deep Creek High (math 70% / reading 82%, grade A-, #102 of 319 statewide, top 32%, 1,597 students, 49% FRL) — zoned schools average 62% FRL vs 28% district-wide (34 pts higher); higher-poverty schools than district average — tighter screening recommended.
- Market conditions: Rents rising fast (+6.1%/yr); 184 active listings in the ZIP; 8 comparable units currently listed for rent nearby; rentals at typical pace (median 26d on market — plan ~3-4 weeks tenant-placement turnaround); solid renter incomes; 597 units permitted in Chesapeake city in 2024 (0 in 5+ unit buildings).
Forward outlook
- Local home prices are declining (-3.0%/yr); year-one equity from $3k of loan paydown is wiped out by about $13k of value loss. Plan a longer hold.
- Chesapeake County population projected at +21% by 2050 — long-run rental-demand tailwind backs the buy-and-hold thesis.
Negotiation context
- It's been on market 24 days — a 2% lower offer ($414k) is reasonable based on typical stale-listing flexibility.
- 2 sale attempts with the ask held roughly flat each time — persistent listings suggest the price (not the market) is what's stuck; bring a comps-based counter.
- Current owner paid $190k; list at $420k implies a 121% gain — meaningful room to come down on a strong offer.
Risks & watch-outs
- Watch-outs: built in 1952 — expect roof / HVAC / electrical / plumbing capex.
- Climate carrying-cost: severe wind risk, 80% chance of damaging wind over 30y; extreme-heat days projected 7→16/yr by 2055 (HVAC capex compounding) — expect insurance premiums to compound above CPI over the hold.
Questions for the listing agent
- What do current leases actually rent for vs. the listed asking? Can we see a recent rent roll and the last 12 months of T-12 income?
- Built in 1952 — when were the roof, HVAC, electrical panel, plumbing, and water heater last replaced?
- Is there a deadline driving the sale (1031 exchange, divorce, estate, relocation)? That informs how much negotiation room exists.
- Schools are A-rated — typically a magnet for longer-tenancy family renters. What's the average tenant stay here, and is there a school-zone premium baked into asking?
- The area grade is low — what's the realistic commute time and amenity access for the typical tenant pool here? Any planned neighborhood developments (good or bad) we should know about?
- What's the average days-on-market for RENTAL listings here right now (not sales)? A rising rental-DOM trend means longer vacancies and softer asking-rent achievability than the comps imply.
- What's the recent tenant-quality profile in this submarket — average credit score on applications, eviction rate, late-payment / NSF rate, and stable-employment percentage? A property-management company in the area should have these aggregated.
- How much new for-sale + rental construction is in the pipeline within 1–3 miles? Heavy new supply typically softens prices + rents 12–24 months out; constrained supply supports both.
Investment metrics
- 1% rule
- 0.61% ✗
- Cap rate
- 4.58%
- Cash-on-cash
- -6.12%
- DSCR
- 0.73
- GRM
- 13.6
CMA / ARV
- ARV (on-the-fly)
- $396,561
- Comps found
- 12
Show comp detail 12 sales within ~0.75 mi
| Address | Dist | Beds/Ba | Sqft | Sold | Price | $/sf | Match |
|---|---|---|---|---|---|---|---|
| 2320 Battery Park Rd | 0.23mi | 3/1.0 | 1,973 (-2%) | 2mo | $348,000 | $176 | 84 |
| 2309 Battery Park Rd | 0.19mi | 3/2.0 | 2,055 (+2%) | 2mo | $425,000 | $207 | 82 |
| 2325 Delwood Rd | 0.23mi | 3/2.5 | 2,000 (-1%) | 0mo | $419,900 | $210 | 82 |
| 1308 Boxwood Dr | 0.22mi | 4/2.5 (+1) | 2,130 (+6%) | 7mo | $375,000 | $176 | 63 |
| 1220 Boxwood Dr | 0.20mi | 3/1.5 | 1,724 (-14%) | 7mo | $314,000 | $182 | 59 |
| 1441 Boxwood Dr | 0.44mi | 3/2.0 | 1,739 (-14%) | 4mo | $355,000 | $204 | 50 |
| 1241 N River Dr | 0.31mi | 4/2.5 (+1) | 1,734 (-14%) | 2mo | $400,000 | $231 | 50 |
| 1400 Misty Ct | 0.60mi | 4/2.5 (+1) | 1,850 (-8%) | 2mo | $340,000 | $184 | 46 |
| 324 Albert Ave | 0.41mi | 4/2.5 (+1) | 2,200 (+9%) | 10mo | $433,000 | $197 | 45 |
| 925 Oklahoma Dr | 0.66mi | 4/2.5 (+1) | 1,806 (-10%) | 4mo | $420,000 | $233 | 38 |
| 5029 Deep Creek Blvd #202 | 0.72mi | 4/2.0 (+1) | 1,747 (-13%) | 5mo | $249,900 | $143 | 31 |
| 2539 Bird Ln | 0.73mi | 4/3.0 (+1) | 2,308 (+15%) | 10mo | $399,000 | $173 | 20 |
Match score weights: distance 35% · size 25% · config 20% · recency 20%. Top-matched comps best support the ARV.
Projected returns pro-forma
-3.0% appreciation · 6.13% rent growth · sell at horizon
- IRR
- -23.8%
- Equity multiple
- 0.17×
- Total profit
- $-98,006
- Equity at exit
- $62,608
- IRR
- -12.8%
- Equity multiple
- 0.16×
- Total profit
- $-98,539
- Equity at exit
- $36,305
Cash invested: $117,572 (down + closing). Projections, not guarantees.
Landlord ↔ Tenant lean methodology
- Overall (STATE)
- 55 Moderately Landlord-Leaning
- State Virginia
- 55 Moderately Landlord-Leaning · D+2
- County
- — inherits STATE
- City
- — inherits STATE
ZIP-level market 23323
- Home prices YoY
- -21.8%
- Rents YoY
- 6.1%
- Active inventory
- 184
- Price-to-rent
- 13.6×
Monthly cashflow live
- Estimated rent
- $2,567 high interval (Pro) →
- Mortgage (P&I)
- −$2,202
- Tax from tax record
- −$250 /mo · $3,000/yr
- Insurance
- −$175
- HOA
- −$0
- Vacancy / Maint / Mgmt
- −$539
- Net cashflow
- $-599
Break-even live
Sensitivity live
| Price | -10% $-362 | -5% $-480 | +0% $-599 | +5% $-718 | +10% $-837 |
|---|---|---|---|---|---|
| Rent | -10% $-802 | -5% $-701 | +0% $-599 | +5% $-498 | +10% $-397 |
| Rate | -1.0pp $-388 | -0.5pp $-493 | base $-599 | +0.5pp $-708 | +1.0pp $-819 |
UW: 25.0% down · 7.5% · 30yr · 1.5% tax · 5.0% vac · 8.0% maint · 8.0% mgmt
Financing live
Cash to close
- Down payment
- $104,975
- Closing costs
- $12,597
- Reserves months
- —
- Total cash needed
- —
Loan-product check · same deal, 3 products live
Conventional
25% down · 7.5% · 30yr
- Down + closing
- —
- Monthly P&I
- —
- Monthly cashflow
- —
- DSCR
- —
- Eligible?
- —
Personal DTI + credit; lowest rate.
DSCR
20% down · 8.5% · 30yr
- Down + closing
- —
- Monthly P&I
- —
- Monthly cashflow
- —
- DSCR
- —
- Eligible?
- —
No personal income docs; deal must DSCR.
Hard money
10% down · 12.0% · 12mo
- Down + closing
- —
- Monthly P&I
- —
- Monthly cashflow
- —
- DSCR
- —
- Eligible?
- —
Short-term bridge; refi at stabilization.
Rent comps 8 comps
| Address | Beds | Baths | Sqft | Rent | $/sqft | DOM | Units | Dist |
|---|---|---|---|---|---|---|---|---|
| 1061 Saint Julian Dr Chesapeake, VA | 4.0 | 2.0 | 1611 | $2,550 | $1.58 | 25d | 1 | 0.40mi |
| 2509 Smithfield Rd Portsmouth, VA | 3.0 | 2.5 | 1540 | $2,345 | $1.52 | 23d | 1 | 0.75mi |
| 134 Monmouth St Portsmouth, VA | 3.0 | 2.5 | 1440 | $2,450 | $1.70 | 45d | 1 | 0.95mi |
| 213 Monmouth St Portsmouth, VA | 3.0 | 2.5 | 1800 | $2,450 | $1.36 | 46d | 1 | 1.01mi |
| 10 Parkside Pl Portsmouth, VA | 3.0 | 2.0 | 1800 | $2,095 | $1.16 | 19d | 1 | 1.24mi |
| 35 Fairview Cir S Portsmouth, VA | 4.0 | 1.5 | 1462 | $2,100 | $1.44 | 14d | 1 | 1.28mi |
| 108 Marcy St Portsmouth, VA | 4.0 | 2.5 | 2100 | $2,500 | $1.19 | 45d | 1 | 1.31mi |
| 846 Drawbridge Dr Chesapeake, VA | 3.0 | 2.0 | 1400 | $2,600 | $1.86 | 25d | 1 | 1.47mi |
Listing history 9 events
-
2026-05-07status Under Contract
-
2026-04-28historical Active Under Contract
-
2026-04-21status Active
-
2026-03-11status Under Contract
-
2026-03-08historical Active Under Contract
-
2026-03-03$419,900 Active
-
2025-09-10soldstatus $190,000
-
1985-10-08soldstatus $69,900
-
1983-06-16soldstatus $58,900
ⓘ Source: listings_history table (triggers on properties + properties_extension) + one-shot
backfill from property_details.listing_events for pre-trigger history.
Tax reassessment forecast VA · Resets to sale price
- Current annual tax
- $3,000 · $250/mo
- Projected year-2 tax
- $3,443 · $287/mo
- Expected delta
- +$443/yr (+$37/mo · 14.8%)
ⓘ Screening estimate from a state-policy table — verify with the county assessor before closing.
Climate risk First Street
- Flood 4/10 Moderate FEMA zone X (unshaded) · 13% chance over 30 yrs
- Wildfire 1/10 Low
- Heat 9/10 Extreme 7 d/yr ≥106°F today · 16 d/yr by 30 yrs out
- Wind 8/10 Severe 80% chance of damaging wind over 30 yrs
- Air quality 5/10 Major 6 unhealthy d/yr today · 7 by 30 yrs out
Nearby sold comps map
Loading sold comps map…
Walkable amenities ~0.75 mi
Loading nearby amenities…
Taxation est. · year 1
- Rental income
- $30,800
- − Mortgage interest
- −$23,521
- − Property taxes
- −$3,000
- − Insurance
- −$2,100
- − Repairs & maintenance
- −$2,464
- − Management
- −$2,464
- − Depreciation
- −$12,215
- Taxable loss
- −$14,964
- Est. tax savings @ 24.0%
- +$3,591
- After-tax cash flow
- $-3,600/yr
For passive investors: Depreciation is non-cash, so a rental often shows a tax loss while cash-flowing — sheltering income. Rental losses are passive: they offset passive income freely, and up to $25,000/yr can offset ordinary (W-2) income if you actively participate and your MAGI is under $100k (phasing out to $0 by $150k); unused losses carry forward. On sale, claimed depreciation is recaptured at up to 25%, and gains may owe capital-gains tax (a 1031 exchange can defer both). Figures are a year-1 estimate at your 24.0% rate — not tax advice; consult a CPA.
Schools (NCES district)
- District
- Chesapeake City Public School District
- NCES district ID
- 5100810
- Math proficiency
- 58% ▼ -29.00%
- Reading proficiency
- 74% ▼ -7.00%
- Median HH income
- $69,356
- Composite
- 57.84/100
- National rank
- #1047
- State rank
- #31 of 131 in VA
Livability — Chesapeake
- Score
- 70/100
- State rank
- #236
- US rank
- #7942
Category grades
Schools grade is shown separately in the Schools card above.
Census & demographics
- Census place
- Chesapeake, VA
- County
- Chesapeake City · 253,091 people
- City population
- 253,091
- Metro
- Virginia Beach-Norfolk-Newport News, VA-NC
- Population (ZIP)
- 43,043
- Household income
- $108,730
- Rent vs Own
- Severe rent burden
- 699.0
Population outlook (Chesapeake County) Hauer SSP2
- Today (2025)
- 263,804 people
- By 2030
- 276,798 · +4.9%
- By 2040
- 299,906 · +13.7%
- By 2050
- 318,284 · +20.7%
- By 2075
- 362,137 · +37.3%
- By 2100
- 372,225 · +41.1%
Race, ethnicity, and origin ACS 2023
- Neighborhood character
- Diverse neighborhood (Simpson 0.62)
- Race & ethnicity
- White 54% Black 27% Two or more races 11% Hispanic / Latino 8% Asian 3%
- Hispanic origin (detail)
- Mexican 2% Puerto Rican 4%
- Common ancestry
- Italian 3% Romanian 2% Slovak 2%
- Foreign-born
- 5% · Canada, South Korea, Jamaica
- Languages at home
- 93% English-only · Spanish 4% Tagalog/Filipino 1% Other Indo-European 1%
Political lean MEDSL · Chesapeake
- 2024 margin
- Toss-up / Even · D 51.3% · R 47.5% · Other 1.2%
- 2008→2024 swing
- +2.5pp toward D · 2008: 1.3pp · 2024: 3.8pp
- All cycles
- 2024: D+3.8 2020: D+6.5 2016: R+1.3 2012: D+1.1 2008: D+1.3
Not yet ingested
- Civics
- —
Market trends
- HPI YoY
- ▼ -86.09%
- Current HPI
- 309.6925
- Rent YoY
- ▲ 6.13%
- Metro
- Virginia Beach-Norfolk-Newport News, VA-NC
- State GDP YoY
- ▲ 2.40%
- F500 in state
- 50
Industry mix (Fortune 500 HQ in VA)
| Industry | F500 HQs | Revenue |
|---|---|---|
| Aerospace / Defense | 4 | $236B |
|
||
| Technology / Defense | 3 | $32B |
|
||
| Financial Services | 2 | $176B |
|
||
| Utilities | 2 | $27B |
|
||
| Insurance | 2 | $25B |
|
||
| Technology | 2 | $15B |
|
||
Price history
+612.9% since first listed9 events — show timeline
- 2026-05-07 Pending — REINMLS
- 2026-04-28 Contingent — REINMLS
- 2026-04-21 Relisted — REINMLS
- 2026-03-11 Pending — REINMLS
- 2026-03-08 Contingent — REINMLS
- 2026-03-03 Listed $419,900 REINMLS
- 2025-09-10 Sold (Public Records) $190,000 Public Records
- 1985-10-08 Sold (Public Records) $69,900 Public Records
- 1983-06-16 Sold (Public Records) $58,900 Public Records
Property tax history
+2.7%/yrLatest (2025): $3,000 · +1.3% YoY. Source: county tax records.
Cash-flow waterfall
monthlySold comps — $/sqft
last 12 mo · ≤1 miLoading sold comps…