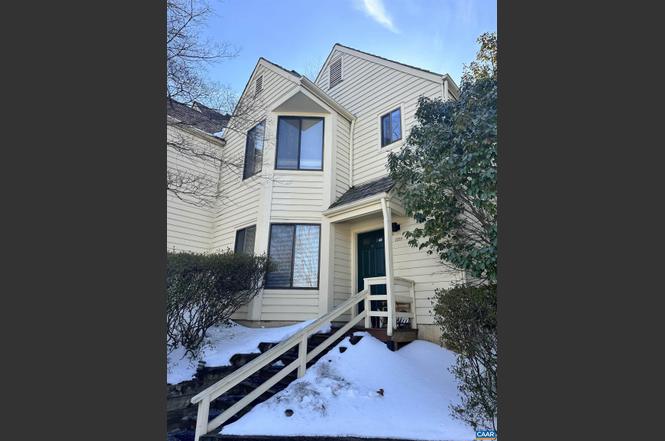
1209 Chatham Rdg · Charlottesville, VA
Flood risk 1/10 · Minimal
- FEMA flood zone
- X (unshaded)
- Chance of flooding over 30 yrs
- 0.0%
- Est. flood insurance / yr
- $473 – $860
Fire risk 4/10 · Minor
- Est. fire insurance / yr
- $666 – $1,236
Heat risk 6/10 · Moderate
- Hot days now (above 103°F)
- 7 days/yr
- Hot days in 30 yrs
- 17 days/yr
Wind risk 2/10 · Minimal
- Chance of severe wind over 30 yrs
- 2.0%
Air-quality risk 1/10 · Minimal
- Unhealthy air days now
- 0 days/yr
- Unhealthy air days in 30 yrs
- 0 days/yr
Risk factors via First Street. Map © Google.
Why this score? — see what drove the F grade
The composite is a weighted blend of 9 inputs, each scored 0–100. Each bar is that input's sub-score; the figure is the points it added to the 100-point composite (weight × sub-score).
- Cash flow +6.6/30.0
- Schools +6.2/10.0
- ARV discount +5.8/15.0
- Livability +4.2/5.0
- Rent growth +3.2/5.0
- Condition / age +2.5/5.0
- 1% rule +1.7/10.0
- DSCR +0.8/10.0
- Appreciation +0.0/10.0
$289,900
🖨 Deal sheet (PDF) 📄 Offer letter ✓ Due diligence
Listing remarks
Ideally located just minutes from the University of Virginia, downtown Charlottesville, UVA Medical Center, and major shopping and dining, 1209 Chatham Ridge offers exceptional convenience in a highly desirable community. The Chatham Ridge community offers easy access to Route 29, I-64, local parks and trails, and Charlottesville’s vibrant cultural scene. Just nearby, Penn Park offers over 100 acres of recreational amenities, including walking and biking trails, tennis courts, athletic fields, playgrounds, a dog park, picnic areas, and scenic river access along the Rivanna. The well-maintained, two-level home includes a fireplace and a private terrace with a patio, great for entertain
Key facts
- Tennis courts
- Easy access to i-64
- Athletic fields
Tags
Neighborhood map
What this means for you Summary
Snapshot
- This is a 2-bed/2.5-bath single-family listed at $290k.
Deal economics
- At list price, monthly cash flow is $-481 ($-6k/yr) — negative.
- To cash-flow at today's rent, offer at most $205k (29.3% below list).
- To meet the 1% rule (rent ≥ 1% of price), the offer needs to be $195k (32.7% below list).
- Recommended offer: $195k (32.7% below list) — sets the bar for 1% rule.
- Cap rate 4.3% vs local median 2.9% in Charlottesville — top-decile yield for the area; either an underpriced asset or a hidden risk that comps aren't pricing in. Stress-test before assuming the spread holds.
Location & tenants
- Location reads 84/100 on livability (#27 in VA, #707 nationally) — a professional / high-income tenant draw. Strengths: schools A+, amenities A+, commute A+; Watch: cost of living D, crime D-.
- Albemarle County Public School District (rural): math 66% / reading 77% proficiency, ranked #14 of 131 in VA (top 11%) — strong family-tenant draw, lease renewals of 3-5y typical.
- Market conditions: Rents rising (+2.8%/yr); 387 active listings in the ZIP; 15 comparable units currently listed for rent nearby; rentals at typical pace (median 22d on market — plan ~3-4 weeks tenant-placement turnaround); solid renter incomes; 810 units permitted in Albemarle County in 2024 (188 in 5+ unit buildings).
Forward outlook
- Local home prices are declining (-3.0%/yr); year-one equity from $2k of loan paydown is wiped out by about $9k of value loss. Plan a longer hold.
- Albemarle County population projected at +24% by 2050 — long-run rental-demand tailwind backs the buy-and-hold thesis.
Negotiation context
- It's been on market 91 days — a 9% lower offer ($264k) is reasonable based on typical stale-listing flexibility.
- 2 sale attempts since 23y ago with the ask held roughly flat each time — persistent listings suggest the price (not the market) is what's stuck; bring a comps-based counter.
- Current owner paid $156k; list at $290k implies a 86% gain — meaningful room to come down on a strong offer.
Risks & watch-outs
- Climate carrying-cost: extreme-heat days projected 7→17/yr by 2055 (HVAC capex compounding) — expect insurance premiums to compound above CPI over the hold.
Questions for the listing agent
- What do current leases actually rent for vs. the listed asking? Can we see a recent rent roll and the last 12 months of T-12 income?
- It's been on market 91 days. Have you received any prior offers? Is the seller open to a 33% concession, seller financing, or rate buy-down credit?
- What does the HOA fee cover, when was the last increase, and are there any pending special assessments or reserve-fund shortfalls?
- Why hasn't it sold? Are there any deal-killer items the seller is aware of (foundation, flood, title, zoning, code violations)?
- Is there a deadline driving the sale (1031 exchange, divorce, estate, relocation)? That informs how much negotiation room exists.
- Schools are A-rated — typically a magnet for longer-tenancy family renters. What's the average tenant stay here, and is there a school-zone premium baked into asking?
- Crime grade is D in this area — have there been break-ins, vandalism, or insurance claims at this property in the last 3 years? What carrier currently insures it and at what premium?
- The area grade is low — what's the realistic commute time and amenity access for the typical tenant pool here? Any planned neighborhood developments (good or bad) we should know about?
- What's the average days-on-market for RENTAL listings here right now (not sales)? A rising rental-DOM trend means longer vacancies and softer asking-rent achievability than the comps imply.
- What's the recent tenant-quality profile in this submarket — average credit score on applications, eviction rate, late-payment / NSF rate, and stable-employment percentage? A property-management company in the area should have these aggregated.
- How much new for-sale + rental construction is in the pipeline within 1–3 miles? Heavy new supply typically softens prices + rents 12–24 months out; constrained supply supports both.
Investment metrics
- 1% rule
- 0.67% ✗
- Cap rate
- 4.30%
- Cash-on-cash
- -7.11%
- DSCR
- 0.68
- GRM
- 12.4
CMA / ARV
- ARV (median comp)
- $279,164
- List price
- $289,900
- Delta
- 3.85%
- Verdict
- FAIR
- Comps
- 20 within 1.0 mi
Show comp detail 2 sales within ~0.75 mi
| Address | Dist | Beds/Ba | Sqft | Sold | Price | $/sf | Match |
|---|---|---|---|---|---|---|---|
| 540 Woodmont Dr | 0.35mi | 3/2.0 (+1) | 1,200 (+2%) | 5mo | $438,000 | $365 | 68 |
| 1211 Holmes Ave | 0.65mi | 3/1.5 (+1) | 1,000 (-15%) | 4mo | $314,500 | $315 | 33 |
Match score weights: distance 35% · size 25% · config 20% · recency 20%. Top-matched comps best support the ARV.
Projected returns pro-forma
-3.0% appreciation · 2.82% rent growth · sell at horizon
- IRR
- -28.8%
- Equity multiple
- 0.04×
- Total profit
- $-77,935
- Equity at exit
- $43,225
- IRR
- -29.3%
- Equity multiple
- -0.34×
- Total profit
- $-108,603
- Equity at exit
- $25,065
Cash invested: $81,172 (down + closing). Projections, not guarantees.
Landlord ↔ Tenant lean methodology
- Overall (STATE)
- 55 Moderately Landlord-Leaning
- State Virginia
- 55 Moderately Landlord-Leaning · D+2
- County
- — inherits STATE
- City
- — inherits STATE
ZIP-level market 22901
- Rents YoY
- 2.8%
- Active inventory
- 387
- Price-to-rent
- 12.4×
Monthly cashflow live
- Estimated rent
- $1,950 high interval (Pro) →
- Mortgage (P&I)
- −$1,520
- Tax from tax record
- −$214 /mo · $2,566/yr
- Insurance
- −$121
- HOA
- −$167
- Vacancy / Maint / Mgmt
- −$410
- Net cashflow
- $-481
Break-even live
Sensitivity live
| Price | -10% $-317 | -5% $-399 | +0% $-481 | +5% $-563 | +10% $-645 |
|---|---|---|---|---|---|
| Rent | -10% $-635 | -5% $-558 | +0% $-481 | +5% $-404 | +10% $-327 |
| Rate | -1.0pp $-335 | -0.5pp $-407 | base $-481 | +0.5pp $-556 | +1.0pp $-633 |
UW: 25.0% down · 7.5% · 30yr · 1.5% tax · 5.0% vac · 8.0% maint · 8.0% mgmt
Financing live
Cash to close
- Down payment
- $72,475
- Closing costs
- $8,697
- Reserves months
- —
- Total cash needed
- —
Loan-product check · same deal, 3 products live
Conventional
25% down · 7.5% · 30yr
- Down + closing
- —
- Monthly P&I
- —
- Monthly cashflow
- —
- DSCR
- —
- Eligible?
- —
Personal DTI + credit; lowest rate.
DSCR
20% down · 8.5% · 30yr
- Down + closing
- —
- Monthly P&I
- —
- Monthly cashflow
- —
- DSCR
- —
- Eligible?
- —
No personal income docs; deal must DSCR.
Hard money
10% down · 12.0% · 12mo
- Down + closing
- —
- Monthly P&I
- —
- Monthly cashflow
- —
- DSCR
- —
- Eligible?
- —
Short-term bridge; refi at stabilization.
Rent comps 15 comps
| Address | Beds | Baths | Sqft | Rent | $/sqft | DOM | Units | Dist |
|---|---|---|---|---|---|---|---|---|
| 1248 Clifden Grn Charlottesville, VA | 2.0 | 1.5 | 1120 | $1,940 | $1.73 | 44d | 1 | 0.26mi |
| 7010 Bo St Charlottesville, VA | 3.0 | 1.0–2.0 | 998 | $2,889 | $2.89 | 14d | 205 | 0.35mi |
| 4 Rockbrook Dr Charlottesville, VA | 1.0 | 1.0 | 1000 | $1,600 | $1.60 | 22d | 1 | 0.46mi |
| 200 Reserve Blvd Charlottesville, VA | 1.0–3.0 | 1.0–2.5 | 1230 | $2,605 | $2.12 | 14d | 49 | 0.97mi |
| 875 Fountain Ct Unit Multiple Units Charlottesville, VA | 2.0 | 1.0 | 900 | $1,625 | $1.81 | 22d | 1 | 1.01mi |
| 875 Fountain Ct Unit Multiple Units Charlottesville, VA | 2.0 | 1.0 | 900 | $1,625 | $1.81 | 44d | 1 | 1.01mi |
| 900 Fountain Ct Charlottesville, VA | 2.0 | 1.0 | 877 | $1,550 | $1.77 | 14d | 1 | 1.02mi |
| 1033 Saint Clair Ave Charlottesville, VA | 3.0 | 1.0 | 912 | $2,550 | $2.80 | 22d | 1 | 1.02mi |
| 835 Fountain Ct Unit B Charlottesville, VA | 2.0 | 1.0 | 900 | $1,625 | $1.81 | 44d | 1 | 1.04mi |
| 835 Fountain Ct Unit B Charlottesville, VA | 2.0 | 1.0 | 900 | $1,625 | $1.81 | 22d | 1 | 1.04mi |
| 840 Fountain Ct Unit A Charlottesville, VA | 2.0 | 1.0 | 900 | $1,625 | $1.81 | 14d | 1 | 1.05mi |
| 840 Fountain Ct Unit D Charlottesville, VA | 2.0 | 1.0 | 900 | $1,625 | $1.81 | 44d | 1 | 1.05mi |
| 1220 Smith St Charlottesville, VA | 2.0 | 1.0 | 735 | $1,425 | $1.94 | 22d | 1 | 1.12mi |
| 901 River Rd Charlottesville, VA | 1.0–2.0 | 1.0–2.0 | 935 | $2,235 | $2.39 | 14d | 12 | 1.35mi |
| 1000 Old Brook Rd Charlottesville, VA | 1.0–3.0 | 1.0–2.0 | 951 | $1,759 | $1.85 | 14d | 30 | 1.45mi |
HOA detail
- Monthly dues
- $167 · $2,004/yr
- Likely covers
- landscaping
Listing history 9 events
-
2026-06-21days on market $289,900 Active 91 DOM
-
2026-06-19days on market $289,900 Active 89 DOM
-
2026-06-18days on market $289,900 Active 88 DOM
-
2026-06-17days on market $289,900 Active 87 DOM
-
2026-06-16days on market $289,900 Active 86 DOM
-
2026-06-15statusdays on market $289,900 Active 85 DOM
-
2026-02-23$289,900 Active
-
2003-08-21soldstatus $156,000
-
2003-07-02$157,000
ⓘ Source: listings_history table (triggers on properties + properties_extension) + one-shot
backfill from property_details.listing_events for pre-trigger history.
Tax reassessment forecast VA · Resets to sale price
- Current annual tax
- $2,566 · $214/mo
- Projected year-2 tax
- $2,566 · $214/mo
- Expected delta
- $0/yr ($0/mo · 0.0%)
ⓘ Screening estimate from a state-policy table — verify with the county assessor before closing.
Climate risk First Street
- Flood 1/10 Low FEMA zone X (unshaded) · 0% chance over 30 yrs
- Wildfire 4/10 Moderate
- Heat 6/10 Major 7 d/yr ≥103°F today · 17 d/yr by 30 yrs out
- Wind 2/10 Low 2% chance of damaging wind over 30 yrs
- Air quality 1/10 Low 0 unhealthy d/yr today · 0 by 30 yrs out
Nearby sold comps map
Loading sold comps map…
Walkable amenities ~0.75 mi
Loading nearby amenities…
Taxation est. · year 1
- Rental income
- $23,403
- − Mortgage interest
- −$16,239
- − Property taxes
- −$2,566
- − Insurance
- −$1,450
- − Repairs & maintenance
- −$1,872
- − Management
- −$1,872
- − HOA
- −$2,004
- − Depreciation
- −$8,433
- Taxable loss
- −$11,033
- Est. tax savings @ 24.0%
- +$2,648
- After-tax cash flow
- $-3,126/yr
For passive investors: Depreciation is non-cash, so a rental often shows a tax loss while cash-flowing — sheltering income. Rental losses are passive: they offset passive income freely, and up to $25,000/yr can offset ordinary (W-2) income if you actively participate and your MAGI is under $100k (phasing out to $0 by $150k); unused losses carry forward. On sale, claimed depreciation is recaptured at up to 25%, and gains may owe capital-gains tax (a 1031 exchange can defer both). Figures are a year-1 estimate at your 24.0% rate — not tax advice; consult a CPA.
Schools (NCES district)
- District
- Albemarle County Public School District
- NCES district ID
- 5100090
- Math proficiency
- 66% ▼ -16.00%
- Reading proficiency
- 77% ▼ -2.00%
- Median HH income
- $67,851
- Composite
- 62.28/100
- National rank
- #698
- State rank
- #14 of 131 in VA
Livability — Charlottesville
- Score
- 84/100
- State rank
- #27
- US rank
- #707
Category grades
Schools grade is shown separately in the Schools card above.
Census & demographics
- County
- Albemarle County · 129,350 people
- City population
- 120,202
- Metro
- Charlottesville, VA
- Population (ZIP)
- 37,237
- Household income
- $92,145
- Rent vs Own
- Severe rent burden
- 2109.0
Population outlook (Albemarle County) Hauer SSP2
- Today (2025)
- 119,403 people
- By 2030
- 125,829 · +5.4%
- By 2040
- 137,705 · +15.3%
- By 2050
- 148,058 · +24.0%
- By 2075
- 172,223 · +44.2%
- By 2100
- 185,628 · +55.5%
Race, ethnicity, and origin ACS 2023
- Neighborhood character
- Predominantly White (70%)
- Race & ethnicity
- White 70% Black 12% Hispanic / Latino 9% Two or more races 6% Asian 5%
- Hispanic origin (detail)
- Mexican 1%
- Common ancestry
- Romanian 3% Slovak 3% Lithuanian 2%
- Foreign-born
- 12% · Canada, China, South Korea
- Languages at home
- 84% English-only · Spanish 8% Other Indo-European 2% Other Asian/Pacific 1%
Political lean MEDSL · Albemarle
- 2024 margin
- Solid D (+34.1) · D 66.3% · R 32.2% · Other 1.4%
- 2008→2024 swing
- +16.1pp toward D · 2008: 18.0pp · 2024: 34.1pp
- All cycles
- 2024: D+34.1 2020: D+33.5 2016: D+25.1 2012: D+12.0 2008: D+18.0
Not yet ingested
- Civics
- —
Market trends
- HPI YoY
- ▼ -341.65%
- Current HPI
- 279.3342
- Rent YoY
- ▲ 2.82%
- Metro
- Charlottesville, VA
- State GDP YoY
- ▲ 2.40%
- F500 in state
- 50
Industry mix (Fortune 500 HQ in VA)
| Industry | F500 HQs | Revenue |
|---|---|---|
| Aerospace / Defense | 4 | $236B |
|
||
| Technology / Defense | 3 | $32B |
|
||
| Financial Services | 2 | $176B |
|
||
| Utilities | 2 | $27B |
|
||
| Insurance | 2 | $25B |
|
||
| Technology | 2 | $15B |
|
||
Price history
+84.6% since first listed3 events — show timeline
- 2026-02-23 Listed $289,900 CAAR
- 2003-08-21 Sold (Public Records) $156,000 Public Records
- 2003-07-02 Listed $157,000 CAAR
Property tax history
+6.7%/yrLatest (2025): $2,566 · +14.2% YoY. Source: county tax records.
Cash-flow waterfall
monthlySold comps — $/sqft
last 12 mo · ≤1 miLoading sold comps…