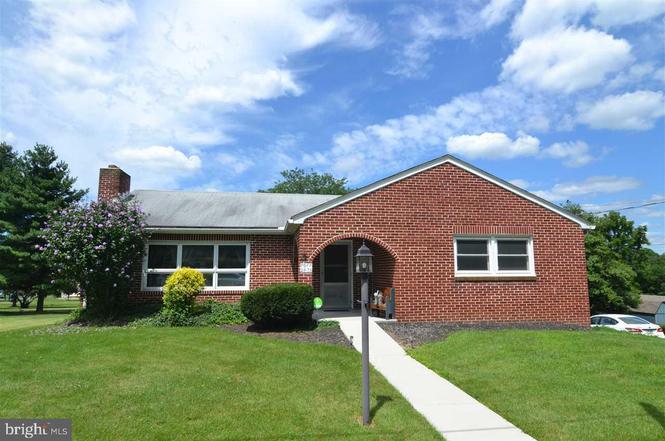
2075 Winding Rd · Shiloh, PA
Flood risk 1/10 · Minimal
- FEMA flood zone
- X (unshaded)
- Chance of flooding over 30 yrs
- 0.0%
- Est. flood insurance / yr
- $473 – $860
Fire risk 1/10 · Minimal
- Est. fire insurance / yr
- $511 – $949
Heat risk 5/10 · Moderate
- Hot days now (above 103°F)
- 7 days/yr
- Hot days in 30 yrs
- 15 days/yr
Wind risk 4/10 · Minor
- Chance of severe wind over 30 yrs
- 11.0%
Air-quality risk 3/10 · Minor
- Unhealthy air days now
- 2 days/yr
- Unhealthy air days in 30 yrs
- 4 days/yr
Risk factors via First Street. Map © Google.
Why this score? — see what drove the D grade
The composite is a weighted blend of 9 inputs, each scored 0–100. Each bar is that input's sub-score; the figure is the points it added to the 100-point composite (weight × sub-score).
- ARV discount +14.5/15.0
- Cash flow +11.5/30.0
- Livability +3.8/5.0
- 1% rule +3.6/10.0
- DSCR +3.4/10.0
- Schools +3.2/10.0
- Rent growth +2.5/5.0
- Condition / age +2.5/5.0
- Appreciation +0.0/10.0
$230,000
🖨 Deal sheet (PDF) 📄 Offer letter ✓ Due diligence
Listing remarks MLS
Fantastic opportunity to own this lovely Brick Rancher in quaint neighborhood in West York. . Two parcels, total 0.69 acre. 3BR 1 Bath, LR has wood Fireplace and all hardwood floors under carpets. Finished family room in lower level, Covered deck off kitchen, freshly painted, new sidewalk put in last year, Large shed. Wonderful yard! CAC & gas hot water baseboard heat. Workshop & Laundry Rm. 2nd lot behind the house was just surveyed, it is staked
Key facts
- 0.69 acre lot
- Garage
- Built 1957
Neighborhood map
What this means for you Summary
Snapshot
- This is a 3-bed/1.0-bath single-family listed at $230k.
Deal economics
- At list price, monthly cash flow is $-74 ($-893/yr) — negative.
- To cash-flow at today's rent, offer at most $217k (5.7% below list).
- To meet the 1% rule (rent ≥ 1% of price), the offer needs to be $197k (14.3% below list).
- Recommended offer: $197k (14.3% below list) — sets the bar for 1% rule.
- Cap rate 5.9% vs local median 3.9% in Shiloh — top-decile yield for the area; either an underpriced asset or a hidden risk that comps aren't pricing in. Stress-test before assuming the spread holds.
Location & tenants
- Location reads 76/100 on livability (#414 in PA, #3,776 nationally) — a middle-class / working-renter tenant base. Strengths: cost of living A+, housing A+, health & safety A+; Watch: amenities F, commute F.
- West York Area SD (suburban): math 29% / reading 45% proficiency, ranked #379 of 539 in PA (top 70%) — families likely to look elsewhere, expect single-tenant / working-renter base with shorter leases.
- Zoned schools: Trimmer El Sch (math 29% / reading 46%, grade F, #997 of 1,518 statewide, top 66%, 415 students, 57% FRL); West York Area Ms (math 19% / reading 44%, grade F, #367 of 512 statewide, top 73%, 675 students, 53% FRL); West York Area Hs (math 57% / reading 30%, grade F, #213 of 437 statewide, top 49%, 869 students, 49% FRL) — zoned schools average 53% FRL vs 37% district-wide (16 pts higher); higher-poverty schools than district average — tighter screening recommended.
- Market conditions: 147 active listings in the ZIP; 2 comparable units currently listed for rent nearby; solid renter incomes; 1,328 units permitted in York County in 2024 (338 in 5+ unit buildings).
Forward outlook
- Local home prices are declining (-3.0%/yr); year-one equity from $2k of loan paydown is wiped out by about $7k of value loss. Plan a longer hold.
Negotiation context
- Only 8 days on market — expect competitive offers; lowballing is unlikely to land.
- 3 sale attempts since 11y ago with the ask held roughly flat each time — persistent listings suggest the price (not the market) is what's stuck; bring a comps-based counter.
- Current owner paid $140k; list at $230k implies a 64% gain — meaningful room to come down on a strong offer.
Risks & watch-outs
- Watch-outs: built in 1957 — expect roof / HVAC / electrical / plumbing capex.
- Climate carrying-cost: extreme-heat days projected 7→15/yr by 2055 (HVAC capex compounding) — expect insurance premiums to compound above CPI over the hold.
Questions for the listing agent
- What do current leases actually rent for vs. the listed asking? Can we see a recent rent roll and the last 12 months of T-12 income?
- Built in 1957 — when were the roof, HVAC, electrical panel, plumbing, and water heater last replaced?
- Is there a deadline driving the sale (1031 exchange, divorce, estate, relocation)? That informs how much negotiation room exists.
- The area grade is low — what's the realistic commute time and amenity access for the typical tenant pool here? Any planned neighborhood developments (good or bad) we should know about?
- What's the average days-on-market for RENTAL listings here right now (not sales)? A rising rental-DOM trend means longer vacancies and softer asking-rent achievability than the comps imply.
- What's the recent tenant-quality profile in this submarket — average credit score on applications, eviction rate, late-payment / NSF rate, and stable-employment percentage? A property-management company in the area should have these aggregated.
- How much new for-sale + rental construction is in the pipeline within 1–3 miles? Heavy new supply typically softens prices + rents 12–24 months out; constrained supply supports both.
Investment metrics
- 1% rule
- 0.86% ✗
- Cap rate
- 5.90%
- Cash-on-cash
- -1.39%
- DSCR
- 0.94
- GRM
- 9.7
CMA / ARV
- ARV (on-the-fly)
- $272,020
- Comps found
- 11
Show comp detail 11 sales within ~0.75 mi
| Address | Dist | Beds/Ba | Sqft | Sold | Price | $/sf | Match |
|---|---|---|---|---|---|---|---|
| 1879 Trolley Rd | 0.22mi | 3/2.0 | 1,323 (-1%) | 8mo | $269,000 | $203 | 77 |
| 2440 Brougher Ln | 0.65mi | 3/1.5 | 1,344 (+0%) | 4mo | $209,500 | $156 | 63 |
| 2370 Loucks Rd | 0.57mi | 3/1.5 | 1,276 (-5%) | 3mo | $290,550 | $228 | 61 |
| 1721 Spring St | 0.03mi | 3/1.0 | 1,152 (-14%) | 17mo | $235,000 | $204 | 61 |
| 2270 Seneca Dr | 0.53mi | 3/2.0 | 1,418 (+6%) | 5mo | $291,000 | $205 | 58 |
| 2333 Loucks Rd | 0.48mi | 3/2.0 | 1,518 (+13%) | 2mo | $324,900 | $214 | 49 |
| 2228 Heather Rd | 0.47mi | 3/2.0 | 1,536 (+15%) | 2mo | $309,000 | $201 | 48 |
| 2474 Kotur Ave | 0.72mi | 3/1.5 | 1,493 (+11%) | 10mo | $259,900 | $174 | 37 |
| 2095 Elim St | 0.62mi | 2/1.0 (-1) | 1,168 (-13%) | 21mo | $239,900 | $205 | 27 |
| 2368 Heather Rd | 0.62mi | 3/2.0 | 1,536 (+15%) | 19mo | $274,900 | $179 | 27 |
| 1830 Hayward Rd | 0.60mi | 2/1.5 (-1) | 1,532 (+14%) | 18mo | $244,500 | $160 | 26 |
Match score weights: distance 35% · size 25% · config 20% · recency 20%. Top-matched comps best support the ARV.
Projected returns pro-forma
-3.0% appreciation · 3.0% rent growth · sell at horizon
- IRR
- -18.6%
- Equity multiple
- 0.35×
- Total profit
- $-41,951
- Equity at exit
- $34,294
- IRR
- -10.9%
- Equity multiple
- 0.34×
- Total profit
- $-42,404
- Equity at exit
- $19,886
Cash invested: $64,400 (down + closing). Projections, not guarantees.
Landlord ↔ Tenant lean methodology
- Overall (STATE)
- 62 Landlord-Friendly
- State Pennsylvania
- 62 Landlord-Friendly · EVEN
- County
- — inherits STATE
- City
- — inherits STATE
ZIP-level market 17408
- Home prices YoY
- -26.6%
- Active inventory
- 147
- Price-to-rent
- 9.7×
Monthly cashflow live
- Estimated rent
- $1,971 medium interval (Pro) →
- Mortgage (P&I)
- −$1,206
- Tax from tax record
- −$330 /mo · $3,956/yr
- Insurance
- −$96
- HOA
- −$0
- Vacancy / Maint / Mgmt
- −$414
- Net cashflow
- $-74
Break-even live
Sensitivity live
| Price | -10% $56 | -5% $-9 | +0% $-74 | +5% $-139 | +10% $-205 |
|---|---|---|---|---|---|
| Rent | -10% $-230 | -5% $-152 | +0% $-74 | +5% $3 | +10% $81 |
| Rate | -1.0pp $41 | -0.5pp $-16 | base $-74 | +0.5pp $-134 | +1.0pp $-195 |
UW: 25.0% down · 7.5% · 30yr · 1.5% tax · 5.0% vac · 8.0% maint · 8.0% mgmt
Financing live
Cash to close
- Down payment
- $57,500
- Closing costs
- $6,900
- Reserves months
- —
- Total cash needed
- —
Loan-product check · same deal, 3 products live
Conventional
25% down · 7.5% · 30yr
- Down + closing
- —
- Monthly P&I
- —
- Monthly cashflow
- —
- DSCR
- —
- Eligible?
- —
Personal DTI + credit; lowest rate.
DSCR
20% down · 8.5% · 30yr
- Down + closing
- —
- Monthly P&I
- —
- Monthly cashflow
- —
- DSCR
- —
- Eligible?
- —
No personal income docs; deal must DSCR.
Hard money
10% down · 12.0% · 12mo
- Down + closing
- —
- Monthly P&I
- —
- Monthly cashflow
- —
- DSCR
- —
- Eligible?
- —
Short-term bridge; refi at stabilization.
Rent comps 2 comps
| Address | Beds | Baths | Sqft | Rent | $/sqft | DOM | Units | Dist |
|---|---|---|---|---|---|---|---|---|
| 1800 Kenneth Rd York, PA | 1.0–3.0 | 1.0–2.0 | 898 | $1,925 | $2.14 | 15d | 21 | 0.61mi |
| 200 Weldon Dr York, PA | 1.0–2.0 | 1.0–2.0 | 993 | $1,800 | $1.81 | 15d | 10 | 1.39mi |
Listing history 10 events
-
2026-02-10status Pending
-
2026-01-21historical Active Under Contract
-
2026-01-14$230,000 Active
-
2026-01-13historical $230,000
-
2016-02-16soldstatus $140,000
-
2016-02-12soldstatus $140,000 463-char remark
Show marketing remark (463 chars)
Fantastic opportunity to own this lovely Brick Rancher in quaint neighborhood in West York. . Two parcels, total 0.69 acre. 3BR 1 Bath, LR has wood Fireplace and all hardwood floors under carpets. Finished family room in lower level, Covered deck off kitchen, freshly painted, new sidewalk put in last year, Large shed. Wonderful yard! CAC & gas hot water baseboard heat. Workshop & Laundry Rm. 2nd lot behind the house was just surveyed, it is staked
-
2016-01-28historical
-
2016-01-05historical 463-char remark
Show marketing remark (463 chars)
Fantastic opportunity to own this lovely Brick Rancher in quaint neighborhood in West York. . Two parcels, total 0.69 acre. 3BR 1 Bath, LR has wood Fireplace and all hardwood floors under carpets. Finished family room in lower level, Covered deck off kitchen, freshly painted, new sidewalk put in last year, Large shed. Wonderful yard! CAC & gas hot water baseboard heat. Workshop & Laundry Rm. 2nd lot behind the house was just surveyed, it is staked
-
2015-12-02$144,900 463-char remark
Show marketing remark (463 chars)
Fantastic opportunity to own this lovely Brick Rancher in quaint neighborhood in West York. . Two parcels, total 0.69 acre. 3BR 1 Bath, LR has wood Fireplace and all hardwood floors under carpets. Finished family room in lower level, Covered deck off kitchen, freshly painted, new sidewalk put in last year, Large shed. Wonderful yard! CAC & gas hot water baseboard heat. Workshop & Laundry Rm. 2nd lot behind the house was just surveyed, it is staked
-
2015-07-28$144,900
ⓘ Source: listings_history table (triggers on properties + properties_extension) + one-shot
backfill from property_details.listing_events for pre-trigger history.
Tax reassessment forecast PA · Partial reset (capped growth)
- Current annual tax
- $3,956 · $330/mo
- Projected year-2 tax
- $3,956 · $330/mo
- Expected delta
- $0/yr ($0/mo · 0.0%)
ⓘ Screening estimate from a state-policy table — verify with the county assessor before closing.
Climate risk First Street
- Flood 1/10 Low FEMA zone X (unshaded) · 0% chance over 30 yrs
- Wildfire 1/10 Low
- Heat 5/10 Major 7 d/yr ≥103°F today · 15 d/yr by 30 yrs out
- Wind 4/10 Moderate 11% chance of damaging wind over 30 yrs
- Air quality 3/10 Moderate 2 unhealthy d/yr today · 4 by 30 yrs out
Nearby sold comps map
Loading sold comps map…
Walkable amenities ~0.75 mi
Loading nearby amenities…
Taxation est. · year 1
- Rental income
- $23,654
- − Mortgage interest
- −$12,884
- − Property taxes
- −$3,956
- − Insurance
- −$1,150
- − Repairs & maintenance
- −$1,892
- − Management
- −$1,892
- − Depreciation
- −$6,691
- Taxable loss
- −$4,811
- Est. tax savings @ 24.0%
- +$1,155
- After-tax cash flow
- $262/yr
For passive investors: Depreciation is non-cash, so a rental often shows a tax loss while cash-flowing — sheltering income. Rental losses are passive: they offset passive income freely, and up to $25,000/yr can offset ordinary (W-2) income if you actively participate and your MAGI is under $100k (phasing out to $0 by $150k); unused losses carry forward. On sale, claimed depreciation is recaptured at up to 25%, and gains may owe capital-gains tax (a 1031 exchange can defer both). Figures are a year-1 estimate at your 24.0% rate — not tax advice; consult a CPA.
Schools (NCES district)
- District
- West York Area SD
- NCES district ID
- 4225980
- Math proficiency
- 29% ▼ -8.00%
- Reading proficiency
- 45% ▼ -12.00%
- Median HH income
- $54,375
- Composite
- 32.36/100
- National rank
- #5736
- State rank
- #379 of 539 in PA
Livability — Shiloh
- Score
- 76/100
- State rank
- #414
- US rank
- #3776
Category grades
Schools grade is shown separately in the Schools card above.
Census & demographics
- Census place
- Shiloh, PA
- County
- York County · 278,806 people
- Metro
- York-Hanover, PA
- Population (ZIP)
- 25,431
- Household income
- $94,565
- Rent vs Own
- Severe rent burden
- 435.0
Population outlook (York County) Hauer SSP2
- Today (2025)
- 454,205 people
- By 2030
- 457,407 · +0.7%
- By 2040
- 457,529 · +0.7%
- By 2050
- 448,261 · -1.3%
- By 2075
- 427,388 · -5.9%
- By 2100
- 384,218 · -15.4%
Race, ethnicity, and origin ACS 2023
- Neighborhood character
- Predominantly White (78%)
- Race & ethnicity
- White 78% Hispanic / Latino 8% Two or more races 6% Black 5% Asian 4%
- Hispanic origin (detail)
- Mexican 1% Puerto Rican 6%
- Common ancestry
- Romanian 2% Slovak 2% Italian 1%
- Foreign-born
- 5% · Canada, Vietnam
- Languages at home
- 89% English-only · Spanish 6% Other Indo-European 2% Vietnamese 1%
Political lean MEDSL · York
- 2024 margin
- Strong R (+25.3) · D 36.9% · R 62.1%
- 2008→2024 swing
- -11.7pp toward R · 2008: -13.6pp · 2024: -25.3pp
- All cycles
- 2024: R+25.3 2020: R+24.6 2016: R+29.3 2012: R+21.2 2008: R+13.6
Not yet ingested
- Civics
- —
Market trends
- HPI YoY
- ▼ -86.74%
- Current HPI
- 239.5179
- Rent YoY
- —
- Metro
- York-Hanover, PA
- State GDP YoY
- ▲ 1.68%
- F500 in state
- 34
Industry mix (Fortune 500 HQ in PA)
| Industry | F500 HQs | Revenue |
|---|---|---|
| Healthcare | 2 | $309B |
|
||
| Insurance | 2 | $27B |
|
||
| Telecommunications / Media | 1 | $124B |
|
||
| Industrial Distribution | 1 | $22B |
|
||
| Financial Services | 1 | $20B |
|
||
| Chemicals / Materials | 1 | $18B |
|
||
Price history
+58.7% since first listed10 events — show timeline
- 2026-02-10 Pending — BRIGHT MLS
- 2026-01-21 Contingent — BRIGHT MLS
- 2026-01-14 Listed $230,000 BRIGHT MLS
- 2026-01-13 Coming Soon $230,000 BRIGHT MLS
- 2016-02-16 Sold (Public Records) $140,000 Public Records
- 2016-02-12 Sold (MLS) $140,000 BRIGHT MLS
- 2016-01-28 Listing Removed — BRIGHT MLS
- 2016-01-05 Listing Removed — BRIGHT MLS
- 2015-12-02 Listed $144,900 BRIGHT MLS
- 2015-07-28 Listed $144,900 BRIGHT MLS
Property tax history
+2.6%/yrLatest (2025): $3,956 · +2.6% YoY. Source: county tax records.
Cash-flow waterfall
monthlySold comps — $/sqft
last 12 mo · ≤1 miLoading sold comps…