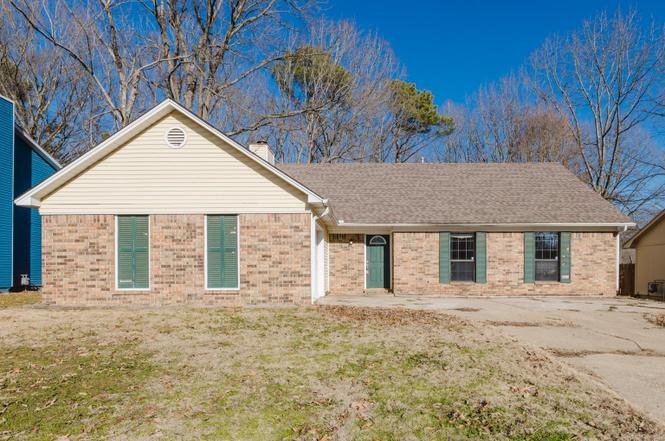
2306 Chelsea Dr · Bryant, AR
Flood risk 1/10 · Minimal
- FEMA flood zone
- X (unshaded)
- Chance of flooding over 30 yrs
- 0.0%
- Est. flood insurance / yr
- $507 – $1,088
Fire risk 3/10 · Minor
- Est. fire insurance / yr
- $1,499 – $2,785
Heat risk 6/10 · Moderate
- Hot days now (above 110°F)
- 7 days/yr
- Hot days in 30 yrs
- 19 days/yr
Wind risk 4/10 · Minor
- Chance of severe wind over 30 yrs
- 10.0%
Air-quality risk 2/10 · Minimal
- Unhealthy air days now
- 0 days/yr
- Unhealthy air days in 30 yrs
- 1 days/yr
Risk factors via First Street. Map © Google.
Why this score? — see what drove the C grade
The composite is a weighted blend of 9 inputs, each scored 0–100. Each bar is that input's sub-score; the figure is the points it added to the 100-point composite (weight × sub-score).
- Cash flow +20.9/30.0
- ARV discount +12.2/15.0
- DSCR +6.6/10.0
- 1% rule +4.9/10.0
- Schools +4.2/10.0
- Livability +3.7/5.0
- Rent growth +2.5/5.0
- Condition / age +2.5/5.0
- Appreciation +0.0/10.0
$160,000
🖨 Deal sheet 📄 Offer letter ✓ Due diligence
Listing remarks MLS
Completely renovated 3 bed/2 bath, 1,284sf home in Bryant: new granite counters, subway tile backsplash, under-cabinet lighting, all new stnlss steel appliances, recessed lighting in updated kitchen. New deck/firepit. New water-proof luxury vinyl Rustic Oak laminate throughout house. Both full bathrooms updated. Level yard with privacy fence. Single-car garage with automatic opener. Central Heat/AC, Gas-fireplace, brick and vinyl siding. New (30-yr architectural shingle) roof 2019, new HVAC 2015.
Key facts
- Granite countertops
- Fenced-in yard
- 8,712 sq ft lot
Tags
Property features AI
Exterior
- Parking: 2-car garage
- Utilities: Public sewer; Public water; Municipal electric (Entergy); Natural gas
- Home design: Single-family property
- Construction: Architectural shingle roof; Slab foundation
- Exterior features: Brick and metal/vinyl siding exterior; Paved road access; Level lot in a subdivision; Inside city limits
Interior
- Kitchen: Free-standing stove; Gas range; Microwave; Dishwasher
- Flooring: Laminate flooring; Luxury vinyl flooring
- Bathrooms: 2 full bathrooms
- Heating & cooling: Central gas heat; Central electric cooling
- Interior features: Laminate and luxury vinyl flooring; Gas-starter fireplace
- Laundry & utility: Laundry room
Neighborhood map
What this means for you Summary
Snapshot
- This is a 3-bed/2.0-bath single-family listed at $160k.
Deal economics
- At list price, monthly cash flow is $222 ($3k/yr) — positive.
- The deal already cash-flows at list — no discount required.
- To meet the 1% rule (rent ≥ 1% of price), the offer needs to be $158k (0.9% below list).
- Recommended offer: $158k (0.9% below list) — sets the bar for 1% rule.
- Cap rate 8.0% vs local median 3.9% in Bryant — top-decile yield for the area; either an underpriced asset or a hidden risk that comps aren't pricing in. Stress-test before assuming the spread holds.
Location & tenants
- Location reads 74/100 on livability (#16 in AR, #4,487 nationally) — a middle-class / working-renter tenant base. Strengths: cost of living A+, housing A+, health & safety A+; Watch: amenities F, commute F.
- Bryant School District (suburban): math 49% / reading 48% proficiency, ranked #16 of 238 in AR (top 7%) — families likely to look elsewhere, expect single-tenant / working-renter base with shorter leases.
- Market conditions: 97 active listings in the ZIP; 7 comparable units currently listed for rent nearby; rentals at typical pace (median 21d on market — plan ~3-4 weeks tenant-placement turnaround); 446 units permitted in Saline County in 2024 (0 in 5+ unit buildings).
Forward outlook
- Local home prices are declining (-3.0%/yr); year-one equity from $1k of loan paydown is wiped out by about $5k of value loss. Plan a longer hold.
- Saline County population projected at +39% by 2050 — long-run rental-demand tailwind backs the buy-and-hold thesis.
Negotiation context
- Only 2 days on market — expect competitive offers; lowballing is unlikely to land.
- 8 sale attempts since 7y ago with the ask held roughly flat each time — persistent listings suggest the price (not the market) is what's stuck; bring a comps-based counter.
- Current owner paid $124k; 30% above their basis — modest negotiation headroom, anchor on the comps not their cost.
Risks & watch-outs
- Climate carrying-cost: extreme-heat days projected 7→19/yr by 2055 (HVAC capex compounding) — expect insurance premiums to compound above CPI over the hold.
Questions for the listing agent
- Is there a deadline driving the sale (1031 exchange, divorce, estate, relocation)? That informs how much negotiation room exists.
- Schools are B-rated — typically a magnet for longer-tenancy family renters. What's the average tenant stay here, and is there a school-zone premium baked into asking?
- What's the average days-on-market for RENTAL listings here right now (not sales)? A rising rental-DOM trend means longer vacancies and softer asking-rent achievability than the comps imply.
- What's the recent tenant-quality profile in this submarket — average credit score on applications, eviction rate, late-payment / NSF rate, and stable-employment percentage? A property-management company in the area should have these aggregated.
- How much new for-sale + rental construction is in the pipeline within 1–3 miles? Heavy new supply typically softens prices + rents 12–24 months out; constrained supply supports both.
Investment metrics
- 1% rule
- 0.99% ✗
- Cap rate
- 7.96%
- Cash-on-cash
- 5.95%
- DSCR
- 1.26
- GRM
- 8.4
CMA / ARV
- ARV (on-the-fly)
- $178,476
- Comps found
- 12
Show comp detail 12 sales within ~0.75 mi
| Address | Dist | Beds/Ba | Sqft | Sold | Price | $/sf | Match |
|---|---|---|---|---|---|---|---|
| 2302 Chelsea Dr | 0.01mi | 3/2.0 | 1,251 (-3%) | 6mo | $140,000 | $112 | 90 |
| 2309 Chelsea Dr | 0.04mi | 3/2.0 | 1,300 (+1%) | 10mo | $173,000 | $133 | 88 |
| 701 Pattywood Dr | 0.09mi | 3/2.0 | 1,376 (+7%) | 2mo | $155,000 | $113 | 82 |
| 2313 Chelsea Dr | 0.04mi | 3/2.0 | 1,328 (+3%) | 21mo | $179,000 | $135 | 74 |
| 2208 Amber Cv | 0.07mi | 3/2.0 | 1,398 (+9%) | 12mo | $199,800 | $143 | 72 |
| 2400 Pattywood Dr | 0.08mi | 3/2.0 | 1,364 (+6%) | 21mo | $190,000 | $139 | 68 |
| 2500 Carywood Dr | 0.11mi | 3/1.5 | 1,092 (-15%) | 2mo | $182,000 | $167 | 66 |
| 2321 Chelsea Dr | 0.07mi | 3/2.0 | 1,467 (+14%) | 10mo | $195,000 | $133 | 65 |
| 2620 Mills Park Dr | 0.21mi | 2/2.0 (-1) | 1,220 (-5%) | 20mo | $147,500 | $121 | 60 |
| 2106 Raintree Dr | 0.26mi | 3/2.0 | 1,437 (+12%) | 9mo | $209,900 | $146 | 60 |
| 2700 Carywood Dr | 0.22mi | 3/1.5 | 1,128 (-12%) | 14mo | $167,000 | $148 | 56 |
| 2210 Cherry Creek Cir | 0.71mi | 3/2.0 | 1,258 (-2%) | 13mo | $202,000 | $161 | 53 |
Match score weights: distance 35% · size 25% · config 20% · recency 20%. Top-matched comps best support the ARV.
Projected returns pro-forma
-3.0% appreciation · 3.0% rent growth · sell at horizon
- IRR
- -7.1%
- Equity multiple
- 0.74×
- Total profit
- $-11,801
- Equity at exit
- $23,857
- IRR
- 2.4%
- Equity multiple
- 1.18×
- Total profit
- $7,851
- Equity at exit
- $13,834
Cash invested: $44,800 (down + closing). Projections, not guarantees.
Landlord ↔ Tenant lean methodology
- Overall (STATE)
- 92 Strongly Landlord-Friendly
- State Arkansas
- 92 Strongly Landlord-Friendly · R+14
- County
- — inherits STATE
- City
- — inherits STATE
ZIP-level market 72022
- Home prices YoY
- -16.5%
- Active inventory
- 97
- Price-to-rent
- 8.4×
Monthly cashflow live
- Estimated rent
- $1,585 high interval (Pro) →
- Mortgage (P&I)
- −$839
- Tax from tax record
- −$124 /mo · $1,491/yr
- Insurance
- −$67
- HOA
- −$0
- Vacancy / Maint / Mgmt
- −$333
- Net cashflow
- $222
Break-even live
UW: 25.0% down · 7.5% · 30yr · 1.5% tax · 5.0% vac · 8.0% maint · 8.0% mgmt
Financing live
Cash to close
- Down payment
- $40,000
- Closing costs
- $4,800
- Reserves months
- —
- Total cash needed
- —
Loan-product check · same deal, 3 products live
Conventional
25% down · 7.5% · 30yr
- Down + closing
- —
- Monthly P&I
- —
- Monthly cashflow
- —
- DSCR
- —
- Eligible?
- —
Personal DTI + credit; lowest rate.
DSCR
20% down · 8.5% · 30yr
- Down + closing
- —
- Monthly P&I
- —
- Monthly cashflow
- —
- DSCR
- —
- Eligible?
- —
No personal income docs; deal must DSCR.
Hard money
10% down · 12.0% · 12mo
- Down + closing
- —
- Monthly P&I
- —
- Monthly cashflow
- —
- DSCR
- —
- Eligible?
- —
Short-term bridge; refi at stabilization.
Rent comps 7 comps
| Address | Beds | Baths | Sqft | Rent | $/sqft | DOM | Units | Dist |
|---|---|---|---|---|---|---|---|---|
| 1810 Melba Cir Unit 2 Bryant, AR | 3.0 | 2.0 | 1200 | $1,395 | $1.16 | 14d | 1 | 0.69mi |
| 3420 Garden Club Dr Bryant, AR | 3.0 | 2.0 | 1497 | $1,950 | $1.30 | 14d | 1 | 0.80mi |
| 2310 Kellybrook Bryant, AR | 3.0 | 2.0 | 1592 | $1,595 | $1.00 | 21d | 1 | 1.21mi |
| 2311 Mystic Pt Bryant, AR | 3.0 | 2.0 | 1516 | $1,650 | $1.09 | 23d | 1 | 1.23mi |
| 1612 Waldron Cv Bryant, AR | 3.0 | 2.5 | 1824 | $1,786 | $0.98 | 23d | 1 | 1.29mi |
| 1916 Brandon Cv Bryant, AR | 2.0–3.0 | 2.0 | 1160 | $1,385 | $1.19 | 14d | 1 | 1.38mi |
| 308 NE 2nd St Bryant, AR | 3.0 | 1.5 | 1032 | $1,300 | $1.26 | 23d | 1 | 1.41mi |
Listing history 4 events
-
2026-06-18status $160,000 Under Contract 2 DOM
-
2026-06-18days on market $160,000 New Listing 2 DOM
-
2026-06-16remarks 698-char remark
-
2026-06-16$160,000 New Listing 1 DOM
ⓘ Source: listings_history table (triggers on properties + properties_extension) + one-shot
backfill from property_details.listing_events for pre-trigger history.
Tax reassessment forecast AR · Resets to sale price
- Current annual tax
- $1,491 · $124/mo
- Projected year-2 tax
- $1,491 · $124/mo
- Expected delta
- $0/yr ($0/mo · 0.0%)
ⓘ Screening estimate from a state-policy table — verify with the county assessor before closing.
Climate risk First Street
- Flood 1/10 Low FEMA zone X (unshaded) · 0% chance over 30 yrs
- Wildfire 3/10 Moderate
- Heat 6/10 Major 7 d/yr ≥110°F today · 19 d/yr by 30 yrs out
- Wind 4/10 Moderate 10% chance of damaging wind over 30 yrs
- Air quality 2/10 Low 0 unhealthy d/yr today · 1 by 30 yrs out
Nearby sold comps map
Loading sold comps map…
Walkable amenities ~0.75 mi
Loading nearby amenities…
Taxation est. · year 1
- Rental income
- $19,019
- − Mortgage interest
- −$8,962
- − Property taxes
- −$1,491
- − Insurance
- −$800
- − Repairs & maintenance
- −$1,522
- − Management
- −$1,522
- − Depreciation
- −$4,655
- Taxable income
- $68
- Est. tax owed @ 24.0%
- −$16
- After-tax cash flow
- $2,649/yr
For passive investors: Depreciation is non-cash, so a rental often shows a tax loss while cash-flowing — sheltering income. Rental losses are passive: they offset passive income freely, and up to $25,000/yr can offset ordinary (W-2) income if you actively participate and your MAGI is under $100k (phasing out to $0 by $150k); unused losses carry forward. On sale, claimed depreciation is recaptured at up to 25%, and gains may owe capital-gains tax (a 1031 exchange can defer both). Figures are a year-1 estimate at your 24.0% rate — not tax advice; consult a CPA.
Schools (NCES district)
- District
- Bryant School District
- NCES district ID
- 0503690
- Math proficiency
- 49% ▼ -13.00%
- Reading proficiency
- 48% ▼ -8.00%
- Median HH income
- $57,578
- Composite
- 42.28/100
- National rank
- #3266
- State rank
- #16 of 238 in AR
Livability — Bryant
- Score
- 74/100
- State rank
- #16
- US rank
- #4487
Category grades
Schools grade is shown separately in the Schools card above.
Census & demographics
- Census place
- Bryant, AR
- City population
- 18,350
- Population (ZIP)
- 18,350
Population outlook (Saline County) Hauer SSP2
- Today (2025)
- 140,141 people
- By 2030
- 151,233 · +7.9%
- By 2040
- 173,100 · +23.5%
- By 2050
- 194,368 · +38.7%
- By 2075
- 245,295 · +75.0%
- By 2100
- 279,117 · +99.2%
Race, ethnicity, and origin ACS 2023
- Neighborhood character
- Predominantly White (75%)
- Race & ethnicity
- White 75% Black 13% Two or more races 7% Hispanic / Latino 4% Asian 2%
- Common ancestry
- Slovak 1% Lithuanian 1% Romanian 1%
- Foreign-born
- 3% · Canada, South Korea
- Languages at home
- 94% English-only · Spanish 4% Korean 1% Other Indo-European 1%
Political lean MEDSL · Saline
- 2024 margin
- Solid R (+40.1) · D 28.8% · R 69.0% · Other 2.2%
- 2008→2024 swing
- +0.8pp no change · 2008: -41.0pp · 2024: -40.1pp
- All cycles
- 2024: R+40.1 2020: R+41.2 2016: R+43.5 2012: R+42.7 2008: R+41.0
Not yet ingested
- Civics
- —
Market trends
- HPI YoY
- ▼ -42.32%
- Current HPI
- 213.5119
- Rent YoY
- —
- Metro
- —
- State GDP YoY
- ▲ 3.80%
- F500 in state
- 10
Industry mix (Fortune 500 HQ in AR)
| Industry | F500 HQs | Revenue |
|---|---|---|
| Retail | 1 | $681B |
|
||
| Food / Agriculture | 1 | $53B |
|
||
| Retail / Energy | 1 | $22B |
|
||
| Transportation / Logistics | 1 | $12B |
|
||
| Energy | 1 | $4B |
|
||
Price history
+40.4% since first listed23 events — show timeline
- 2026-06-16 Listed $160,000 CARMLS
- 2025-03-26 Rental Removed $1,400 CARMLS
- 2025-03-21 Listing Removed — CARMLS
- 2025-03-08 Listed for Rent $1,400 CARMLS
- 2025-03-08 Rental Removed $1,400 APPFOLIO
- 2025-03-07 Listed for Rent $1,400 APPFOLIO
- 2025-02-10 Price Changed $169,000 CARMLS
- 2025-01-23 Listed $179,000 CARMLS
- 2023-11-17 Rental Removed $1,400 APPFOLIO
- 2023-11-10 Listed for Rent $1,400 APPFOLIO
- 2019-06-27 Sold (Public Records) $123,500 Public Records
- 2019-06-21 Pending — CARMLS
- 2019-06-21 Sold (MLS) $123,500 CARMLS
- 2019-05-16 Contingent — CARMLS
- 2019-05-08 Listed $131,600 CARMLS
- 2019-04-26 Listing Removed — CARMLS
- 2019-04-18 Price Changed $127,600 CARMLS
- 2019-04-13 Price Changed $128,800 CARMLS
- 2019-03-30 Price Changed $133,800 CARMLS
- 2019-03-12 Relisted — CARMLS
- 2019-02-18 Contingent — CARMLS
- 2019-02-15 Listed $135,900 CARMLS
- 2005-12-27 Sold (Public Records) $114,000 Public Records
Property tax history
+6.4%/yrLatest (2025): $1,491 · +0.0% YoY. Source: county tax records.
Cash-flow waterfall
monthlySold comps — $/sqft
last 12 mo · ≤1 miLoading sold comps…