 Multi-family
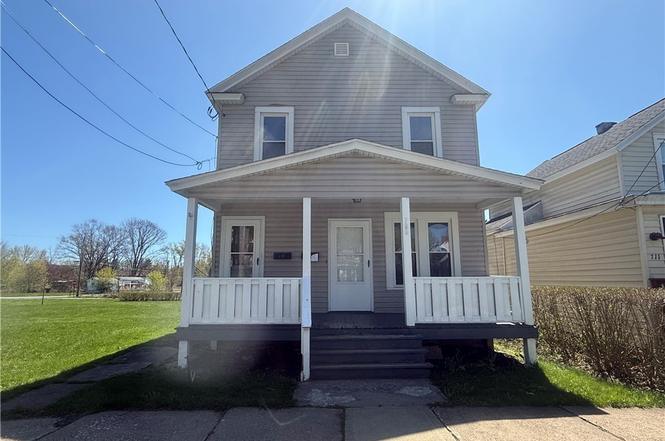
709 S James St · Rome, NY
Flood risk 8/10 · Major
- FEMA flood zone
- X (unshaded)
- Chance of flooding over 30 yrs
- 0.99%
- Est. flood insurance / yr
- $473 – $860
Fire risk 1/10 · Minimal
- Est. fire insurance / yr
- $691 – $1,283
Heat risk 3/10 · Minor
- Hot days now (above 94°F)
- 7 days/yr
- Hot days in 30 yrs
- 17 days/yr
Wind risk 1/10 · Minimal
- Chance of severe wind over 30 yrs
- 0.0%
Air-quality risk 2/10 · Minimal
- Unhealthy air days now
- 0 days/yr
- Unhealthy air days in 30 yrs
- 1 days/yr
Risk factors via First Street. Map © Google.
Why this score? — see what drove the B- grade
The composite is a weighted blend of 9 inputs, each scored 0–100. Each bar is that input's sub-score; the figure is the points it added to the 100-point composite (weight × sub-score).
- Cash flow +30.0/30.0
- 1% rule +10.0/10.0
- DSCR +10.0/10.0
- ARV discount +7.5/15.0
- Schools +3.5/10.0
- Livability +3.2/5.0
- Rent growth +2.5/5.0
- Condition / age +2.5/5.0
- Appreciation +0.0/10.0
$119,900
🖨 Deal sheet (PDF) 📄 Offer letter ✓ Due diligence
Multi-family units
County records classify this as Multi-Family (2-4 Unit). Listing-text estimate: 1 unit. estimate disagrees with records
Listing remarks
Welcome to 709 S James St—a rare Rome opportunity sitting pretty on a triple lot totaling . 36 acres with tons of potential and plenty of room to grow! This two-unit multifamily is perfect for investors, owner-occupants, or anyone looking to build long-term wealth with steady rental income. The upstairs unit offers 3 bedrooms, 1 full bath and downstairs unit 2 bedroom / 1 bath both with laundry hookups! With separate utilities, this property is truly investor-friendly, making management simpler and returns stronger. Outside, the oversized yard spans all three lots—room for gardens, future projects, or just a whole lot of elbow room. And don’t miss the large 2-stall deta
Key facts
- Separate utilities
- Oversized yard
- Two-unit multifamily
Tags
Property features AI
Finance
- Financial info: Owner pays water and trash collection; Rent includes water and trash collection; Operating expenses may include accounting, legal, snow removal, trash, and water/sewer
Exterior
- Parking: 2-car garage; Paved parking, multiple spaces available
- Utilities: Electricity connected; Public water connected; Sewer connected
- Home design: Multi-unit property with 2 total units; 2-story building; Resale property
- Construction: Vinyl siding; Asphalt roof
- Exterior features: Deck
Interior
- Kitchen: Eat-in kitchen; Gas water heater
- Bedrooms: One unit with 3 bedrooms; One unit with 2 bedrooms
- Flooring: Carpet; Laminate; Varies
- Bathrooms: Two full bathrooms total (one full bath in each unit)
- Heating & cooling: Gas forced-air heating
- Interior features: Walk-out basement; Eat-in kitchen (in at least one unit); Formal dining room (in at least one unit); Living room; Porch
- Laundry & utility: Laundry in-unit (both units)
Neighborhood map
What this means for you Summary
Snapshot
- This is a 5-bed/2.0-bath multifamily listed at $120k.
Deal economics
- At list price, monthly cash flow is $549 ($7k/yr) — positive.
- The deal already cash-flows at list — no discount required.
- Meets the 1% rule at list price ($2k rent vs $120k).
- Recommended offer: $109k (9.0% below list) — sets the bar for market timing.
- Cap rate 12.3% vs local median 5.6% in Rome — top-decile yield for the area; either an underpriced asset or a hidden risk that comps aren't pricing in. Stress-test before assuming the spread holds.
Location & tenants
- Location reads 64/100 on livability (#722 in NY) — a middle-class / working-renter tenant base. Strengths: cost of living A+, housing A+; Watch: health & safety C-, amenities F, commute F.
- Rome City School District (town): math 35% / reading 46% proficiency, ranked #516 of 590 in NY (top 88%) — families likely to look elsewhere, expect single-tenant / working-renter base with shorter leases.
- Zoned schools: Bellamy Elementary School (math 8% / reading 22%, grade F, #2,024 of 2,108 statewide, top 97%, 567 students, 75% FRL); Lyndon H Strough Middle School (math 20% / reading 40%, grade F, #539 of 729 statewide, top 74%, 829 students, 59% FRL); Rome Free Academy (math 85% / reading 98%, grade A+, #201 of 1,100 statewide, top 18%, 1,511 students, 51% FRL).
- Market conditions: 278 active listings in the ZIP; 204 units permitted in Oneida County in 2024 (68 in 5+ unit buildings).
Forward outlook
- Local home prices are declining (-3.0%/yr); year-one equity from $829 of loan paydown is wiped out by about $4k of value loss. Plan a longer hold.
- Oneida County population projected at -12% by 2050 — secular population decline; favor cash flow + early exit over multi-decade hold.
- At projected returns (-3.0% appreciation + 3.0% rent growth), your $34k cash investment doubles in ~7 years — after that, you're playing with house money.
Negotiation context
- It's been on market 114 days — a 9% lower offer ($109k) is reasonable based on typical stale-listing flexibility.
- 2 sale attempts with the ask held roughly flat each time — persistent listings suggest the price (not the market) is what's stuck; bring a comps-based counter.
- Current owner paid $30k; list at $120k implies a 300% gain — meaningful room to come down on a strong offer.
Risks & watch-outs
- Watch-outs: flood insurance adds $56/mo; built in 1882 — expect roof / HVAC / electrical / plumbing capex.
- Climate carrying-cost: severe flood risk — expect insurance premiums to compound above CPI over the hold.
Questions for the listing agent
- It's been on market 114 days. Have you received any prior offers? Is the seller open to a 9% concession, seller financing, or rate buy-down credit?
- Built in 1882 — when were the roof, HVAC, electrical panel, plumbing, and water heater last replaced?
- What's the actual annual flood-insurance premium (NFIP or private), and is the property in a SFHA with mandatory coverage?
- Why hasn't it sold? Are there any deal-killer items the seller is aware of (foundation, flood, title, zoning, code violations)?
- Is there a deadline driving the sale (1031 exchange, divorce, estate, relocation)? That informs how much negotiation room exists.
- Schools are F-rated, which usually means shorter tenancies and higher turnover. Who's the typical renter profile here, and what's been the actual vacancy rate?
- What's the average days-on-market for RENTAL listings here right now (not sales)? A rising rental-DOM trend means longer vacancies and softer asking-rent achievability than the comps imply.
- What's the recent tenant-quality profile in this submarket — average credit score on applications, eviction rate, late-payment / NSF rate, and stable-employment percentage? A property-management company in the area should have these aggregated.
- How much new apartment / multifamily construction is in the pipeline within 1–3 miles? Heavy new supply (>2% of stock underway) typically softens rents 12–24 months out; light construction supports rent growth.
Investment metrics
- 1% rule
- 1.51% ✓
- Cap rate
- 12.35%
- Cash-on-cash
- 21.62%
- DSCR
- 1.96
- GRM
- 5.5
CMA / ARV
No comps found within radius.
Projected returns pro-forma
-3.0% appreciation · 3.0% rent growth · sell at horizon
- IRR
- 11.7%
- Equity multiple
- 1.46×
- Total profit
- $15,609
- Equity at exit
- $17,877
- IRR
- 20.7%
- Equity multiple
- 2.75×
- Total profit
- $58,870
- Equity at exit
- $10,367
Cash invested: $33,572 (down + closing). Projections, not guarantees.
Landlord ↔ Tenant lean methodology
- Overall (STATE)
- 15 Strongly Tenant-Friendly
- State New York
- 15 Strongly Tenant-Friendly · D+10
- County
- — inherits STATE
- City
- — inherits STATE
ZIP-level market 13440
- Home prices YoY
- -8.0%
- Active inventory
- 278
- Price-to-rent
- 11.1×
Monthly cashflow live
- Estimated rent
- $1,808 medium interval (Pro) →
- Mortgage (P&I)
- −$629
- Tax from tax record
- −$145 /mo · $1,738/yr
- Insurance
- −$50
- Flood insurance flood zone
- −$56 /mo · $666/yr
- HOA
- −$0
- Vacancy / Maint / Mgmt
- −$380
- Net cashflow
- $549
Break-even live
Sensitivity live
| Price | -10% $617 | -5% $583 | +0% $549 | +5% $515 | +10% $481 |
|---|---|---|---|---|---|
| Rent | -10% $406 | -5% $478 | +0% $549 | +5% $621 | +10% $692 |
| Rate | -1.0pp $610 | -0.5pp $580 | base $549 | +0.5pp $518 | +1.0pp $487 |
2-unit breakdown (identical units grouped — click to expand)
| Units | Beds | Baths | Est. rent |
|---|---|---|---|
| 1× unit | 3 | 1 | $904 |
| 1× unit | 2 | 1 | $904 |
| Total (2 units) | $1,808 | ||
UW: 25.0% down · 7.5% · 30yr · 1.5% tax · 5.0% vac · 8.0% maint · 8.0% mgmt
Financing live
Cash to close
- Down payment
- $29,975
- Closing costs
- $3,597
- Reserves months
- —
- Total cash needed
- —
Loan-product check · same deal, 3 products live
Conventional
25% down · 7.5% · 30yr
- Down + closing
- —
- Monthly P&I
- —
- Monthly cashflow
- —
- DSCR
- —
- Eligible?
- —
Personal DTI + credit; lowest rate.
DSCR
20% down · 8.5% · 30yr
- Down + closing
- —
- Monthly P&I
- —
- Monthly cashflow
- —
- DSCR
- —
- Eligible?
- —
No personal income docs; deal must DSCR.
Hard money
10% down · 12.0% · 12mo
- Down + closing
- —
- Monthly P&I
- —
- Monthly cashflow
- —
- DSCR
- —
- Eligible?
- —
Short-term bridge; refi at stabilization.
Listing history 8 events
-
2026-05-17status Pending
-
2026-05-06historical Active Under Contract
-
2026-04-30status Pending
-
2026-04-22status Active
-
2026-03-08status Pending
-
2026-02-09historical Active Under Contract
-
2025-12-02$119,900 Active
-
1998-12-29soldstatus $30,000
ⓘ Source: listings_history table (triggers on properties + properties_extension) + one-shot
backfill from property_details.listing_events for pre-trigger history.
Tax reassessment forecast NY · Partial reset (capped growth)
- Current annual tax
- $1,738 · $145/mo
- Projected year-2 tax
- $1,882 · $157/mo
- Expected delta
- +$144/yr (+$12/mo · 8.3%)
ⓘ Screening estimate from a state-policy table — verify with the county assessor before closing.
Climate risk First Street
- Flood 8/10 Severe FEMA zone X (unshaded) · 99% chance over 30 yrs
- Wildfire 1/10 Low
- Heat 3/10 Moderate 7 d/yr ≥94°F today · 17 d/yr by 30 yrs out
- Wind 1/10 Low 0% chance of damaging wind over 30 yrs
- Air quality 2/10 Low 0 unhealthy d/yr today · 1 by 30 yrs out
Nearby sold comps map
Loading sold comps map…
Walkable amenities ~0.75 mi
Loading nearby amenities…
Taxation est. · year 1
- Rental income
- $21,696
- − Mortgage interest
- −$6,716
- − Property taxes
- −$1,738
- − Insurance
- −$1,266
- − Repairs & maintenance
- −$1,736
- − Management
- −$1,736
- − Depreciation
- −$3,488
- Taxable income
- $5,016
- Est. tax owed @ 24.0%
- −$1,204
- After-tax cash flow
- $5,387/yr
For passive investors: Depreciation is non-cash, so a rental often shows a tax loss while cash-flowing — sheltering income. Rental losses are passive: they offset passive income freely, and up to $25,000/yr can offset ordinary (W-2) income if you actively participate and your MAGI is under $100k (phasing out to $0 by $150k); unused losses carry forward. On sale, claimed depreciation is recaptured at up to 25%, and gains may owe capital-gains tax (a 1031 exchange can defer both). Figures are a year-1 estimate at your 24.0% rate — not tax advice; consult a CPA.
Schools (NCES district)
- District
- Rome City School District
- NCES district ID
- 3624900
- Math proficiency
- 35% ▼ -4.00%
- Reading proficiency
- 46% ▲ 10.00%
- Median HH income
- $46,406
- Composite
- 34.52/100
- National rank
- #5178
- State rank
- #516 of 590 in NY
Livability — Rome
- Score
- 64/100
- State rank
- #722
- US rank
- #13676
Category grades
Schools grade is shown separately in the Schools card above.
Census & demographics
- Census place
- Rome, NY
- City population
- 41,418
- Population (ZIP)
- 41,273
Population outlook (Oneida County) Hauer SSP2
- Today (2025)
- 225,223 people
- By 2030
- 220,384 · -2.1%
- By 2040
- 209,071 · -7.2%
- By 2050
- 197,920 · -12.1%
- By 2075
- 175,541 · -22.1%
- By 2100
- 148,491 · -34.1%
Race, ethnicity, and origin ACS 2023
- Neighborhood character
- Predominantly White (82%)
- Race & ethnicity
- White 82% Hispanic / Latino 7% Two or more races 6% Black 4% Asian 1%
- Hispanic origin (detail)
- Mexican 1% Puerto Rican 4%
- Common ancestry
- Romanian 9% Lithuanian 4% Slovak 1%
- Foreign-born
- 3% · Canada, China
- Languages at home
- 94% English-only · Spanish 3% Other Indo-European 1%
Political lean MEDSL · Oneida
- 2024 margin
- Strong R (+21.3) · D 39.4% · R 60.6%
- 2008→2024 swing
- -15.2pp toward R · 2008: -6.1pp · 2024: -21.3pp
- All cycles
- 2024: R+21.3 2020: R+15.5 2016: R+21.1 2012: R+5.3 2008: R+6.1
Not yet ingested
- Civics
- —
Market trends
- HPI YoY
- ▼ -29.58%
- Current HPI
- 339.3589
- Rent YoY
- —
- Metro
- —
- State GDP YoY
- ▲ 2.60%
- F500 in state
- 92
Industry mix (Fortune 500 HQ in NY)
| Industry | F500 HQs | Revenue |
|---|---|---|
| Financial Services | 10 | $950B |
|
||
| Consumer Goods | 9 | $162B |
|
||
| Insurance | 4 | $225B |
|
||
| Telecommunications | 2 | $144B |
|
||
| Pharmaceuticals | 2 | $112B |
|
||
| Media / Entertainment | 2 | $69B |
|
||
Price history
+299.7% since first listed8 events — show timeline
- 2026-05-17 Pending — CNYIS
- 2026-05-06 Contingent — CNYIS
- 2026-04-30 Pending — CNYIS
- 2026-04-22 Relisted — CNYIS
- 2026-03-08 Pending — CNYIS
- 2026-02-09 Contingent — CNYIS
- 2025-12-02 Listed $119,900 CNYIS
- 1998-12-29 Sold (Public Records) $30,000 Public Records
Property tax history
+1.7%/yrLatest (2025): $1,738 · +0.3% YoY. Source: county tax records.
Cash-flow waterfall
monthlySold comps — $/sqft
last 12 mo · ≤1 miLoading sold comps…