 Multi-family
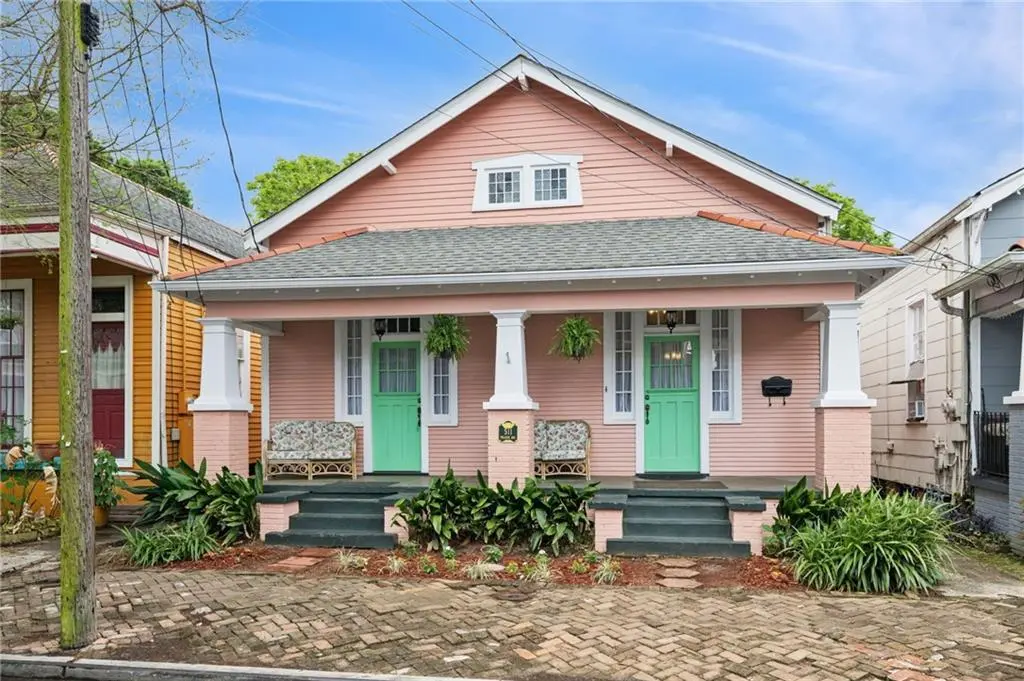
511 13 Pelican Ave · New Orleans, LA
Flood risk No data
- FEMA flood zone
- —
- Chance of flooding over 30 yrs
- —
- Est. flood insurance / yr
- —
Fire risk No data
- Est. fire insurance / yr
- —
Heat risk No data
- Hot days now (above threshold)
- —
- Hot days in 30 yrs
- —
Wind risk No data
- Chance of severe wind over 30 yrs
- —
Air-quality risk No data
- Unhealthy air days now
- —
- Unhealthy air days in 30 yrs
- —
Risk factors via First Street. Map © Google.
Why this score? — see what drove the D- grade
The composite is a weighted blend of 9 inputs, each scored 0–100. Each bar is that input's sub-score; the figure is the points it added to the 100-point composite (weight × sub-score).
- Cash flow +14.8/30.0
- DSCR +4.5/10.0
- 1% rule +4.1/10.0
- Livability +4.0/5.0
- Condition / age +4.0/5.0
- Rent growth +2.3/5.0
- ARV discount +1.7/15.0
- Schools +1.6/10.0
- Appreciation +0.0/10.0
$345,000
🖨 Deal sheet 📄 Offer letter ✓ Due diligence
Multi-family units
County records classify this as Multi-Family (2-4 Unit). Listing-text estimate: 1 unit. estimate disagrees with records
Listing remarks
If you thought finding an affordable, adorable multi-family home in a stellar location was mission impossible meet 511-513 Pelican Street. This darling double with a big front porch gives major curb appeal! The front unit offers two spacious bedrooms that are separate from the social areas of the home which is fab for entertaining. The high ceilings, and wood floors serve the old house charm and the kitchen offers granite countertops and comes with all appliances. The back unit is so cozy with a galley style kitchen, and one bedroom. The versatility of this home really allows for flexibility to suit many needs- it's great for an owner occupant who wants to generate rental income, or to have
Key facts
- Big front porch
- Fenced back yard
- Artist studio
Tags
Property features AI
Finance
- Financial info: Two-unit property; Tenant pays electricity and gas; owner pays water; Unit 513 reported rent $1,000/month; Unit 511 area listed (no rent shown)
Exterior
- Utilities: Public water; Public sewer
- Home design: Single-story building; Raised foundation; Roof replaced in 2021; Shingle roof
- Construction: HardiPlank and wood siding exterior
- Exterior features: Fenced yard; Porch
Interior
- Bedrooms: Unit 513: 1 bedroom; Unit 511: 2 bedrooms
- Bathrooms: 2 full bathrooms total (each unit has 1 full bathroom)
- Heating & cooling: Central heating; Central air conditioning
- Interior features: Very good overall condition; Porch
Neighborhood map
What this means for you Summary
Snapshot
- This is a 3-bed/2.0-bath multifamily listed at $345k. Condition is rated good.
Deal economics
- At list price, monthly cash flow is $97 ($1k/yr) — positive.
- The deal already cash-flows at list — no discount required.
- To meet the 1% rule (rent ≥ 1% of price), the offer needs to be $314k (9.0% below list).
- Recommended offer: $314k (9.0% below list) — sets the bar for 1% rule.
- Cap rate 6.6% vs local median 4.4% in New Orleans — top-decile yield for the area; either an underpriced asset or a hidden risk that comps aren't pricing in. Stress-test before assuming the spread holds.
Location & tenants
- Location reads 81/100 on livability (#3 in LA, #1,383 nationally) — a professional / high-income tenant draw. Strengths: amenities A+, commute A+, health & safety A+; Watch: crime C-, employment D.
- Orleans Parish (urban): math 11% / reading 27% proficiency, ranked #69 of 98 in LA (top 70%) — low school quality limits family demand, transient renter base, plan for 1-2y turnover; 68% free/reduced lunch — lower-income household profile, screen leases tightly.
- Market conditions: Rents soft (-0.7%/yr); 265 active listings in the ZIP; 40 comparable units currently listed for rent nearby; rentals at typical pace (median 24d on market — plan ~3-4 weeks tenant-placement turnaround); 42% of comp listings sitting > 30 days — soft ceiling on asking rent; lower-income renter base — watch delinquency; 710 units permitted in Orleans Parish in 2024 (244 in 5+ unit buildings).
- At $3,141/mo this rent would consume 87% of the median local household income ($43k/yr) (locally 2240% of renters already pay >50% of income on rent) — very limited rent-growth headroom before tenants either downsize or default.
Forward outlook
- Local home prices are declining (-3.0%/yr); year-one equity from $2k of loan paydown is wiped out by about $10k of value loss. Plan a longer hold.
- Orleans County population projected at +61% by 2050 — long-run rental-demand tailwind backs the buy-and-hold thesis.
Negotiation context
- It's been on market 37 days — a 3% lower offer ($335k) is reasonable based on typical stale-listing flexibility.
Risks & watch-outs
- Watch-outs: built in 1925 — expect roof / HVAC / electrical / plumbing capex.
Questions for the listing agent
- It's been on market 37 days. Have you received any prior offers? Is the seller open to a 9% concession, seller financing, or rate buy-down credit?
- Built in 1925 — when were the roof, HVAC, electrical panel, plumbing, and water heater last replaced?
- Is there a deadline driving the sale (1031 exchange, divorce, estate, relocation)? That informs how much negotiation room exists.
- The area grade is low — what's the realistic commute time and amenity access for the typical tenant pool here? Any planned neighborhood developments (good or bad) we should know about?
- What's the average days-on-market for RENTAL listings here right now (not sales)? A rising rental-DOM trend means longer vacancies and softer asking-rent achievability than the comps imply.
- What's the recent tenant-quality profile in this submarket — average credit score on applications, eviction rate, late-payment / NSF rate, and stable-employment percentage? A property-management company in the area should have these aggregated.
- How much new apartment / multifamily construction is in the pipeline within 1–3 miles? Heavy new supply (>2% of stock underway) typically softens rents 12–24 months out; light construction supports rent growth.
Investment metrics
- 1% rule
- 0.91% ✗
- Cap rate
- 6.63%
- Cash-on-cash
- 1.21%
- DSCR
- 1.05
- GRM
- 9.2
CMA / ARV
- ARV (on-the-fly)
- $305,472
- Comps found
- 12
Show comp detail 12 sales within ~0.75 mi
| Address | Dist | Beds/Ba | Sqft | Sold | Price | $/sf | Match |
|---|---|---|---|---|---|---|---|
| 511 13 Pelican Ave | 0.00mi | 3/2.0 | 1,776 (0%) | 1mo | $345,000 | $194 | 100 |
| 505 07 Seguin St | 0.14mi | 4/2.0 (+1) | 1,657 (-7%) | 10mo | $299,000 | $180 | 69 |
| 904 06 Vallette St | 0.46mi | 4/2.0 (+1) | 1,788 (+1%) | 4mo | $165,000 | $92 | 69 |
| 538-40 Verret St | 0.27mi | 4/2.0 (+1) | 1,716 (-3%) | 12mo | $349,000 | $203 | 67 |
| 618-20 Seguin St | 0.22mi | 4/4.0 (+1) | 1,649 (-7%) | 13mo | $392,800 | $238 | 54 |
| 838-840 Elmira Ave | 0.55mi | 4/4.0 (+1) | 1,858 (+5%) | 1mo | $219,000 | $118 | 52 |
| 321 Diana St | 0.48mi | 4/2.0 (+1) | 1,634 (-8%) | 8mo | $216,600 | $133 | 52 |
| 627-629 Seguin St | 0.21mi | 4/2.0 (+1) | 2,040 (+15%) | 18mo | $349,900 | $172 | 45 |
| 909 - 911 Atlantic Ave | 0.64mi | 4/2.0 (+1) | 1,784 (+0%) | 23mo | $95,000 | $53 | 45 |
| 427 29 Seguin St | 0.11mi | 4/4.0 (+1) | 2,024 (+14%) | 22mo | $325,000 | $161 | 40 |
| 219 Lavergne St | 0.25mi | 4/2.0 (+1) | 2,040 (+15%) | 24mo | $390,000 | $191 | 39 |
| 505 Newton St | 0.45mi | 4/3.5 (+1) | 1,979 (+11%) | 18mo | $95,000 | $48 | 34 |
Match score weights: distance 35% · size 25% · config 20% · recency 20%. Top-matched comps best support the ARV.
Projected returns pro-forma
-3.0% appreciation · 0.0% rent growth · sell at horizon
- IRR
- -17.8%
- Equity multiple
- 0.39×
- Total profit
- $-58,873
- Equity at exit
- $51,441
- IRR
- -17.1%
- Equity multiple
- 0.19×
- Total profit
- $-78,678
- Equity at exit
- $29,829
Cash invested: $96,600 (down + closing). Projections, not guarantees.
Landlord ↔ Tenant lean methodology
- Overall (STATE)
- 90 Strongly Landlord-Friendly
- State Louisiana
- 90 Strongly Landlord-Friendly · R+12
- County
- — inherits STATE
- City
- — inherits STATE
ZIP-level market 70114
- Rents YoY
- -0.7%
- Active inventory
- 265
- Price-to-rent
- 18.0×
Monthly cashflow live
- Estimated rent
- $3,141 high interval (Pro) →
- Mortgage (P&I)
- −$1,809
- Tax est. 1.5%
- −$431 /mo · $5,175/yr
- Insurance
- −$144
- HOA
- −$0
- Vacancy / Maint / Mgmt
- −$660
- Net cashflow
- $97
Break-even live
2-unit breakdown (identical units grouped — click to expand)
| Units | Beds | Baths | Est. rent |
|---|---|---|---|
| 1× unit | 2 | 1 | $1,593 |
| 1× unit | 1 | 1 | $1,549 |
| Total (2 units) | $3,141 | ||
UW: 25.0% down · 7.5% · 30yr · 1.5% tax · 5.0% vac · 8.0% maint · 8.0% mgmt
Financing live
Cash to close
- Down payment
- $86,250
- Closing costs
- $10,350
- Reserves months
- —
- Total cash needed
- —
Loan-product check · same deal, 3 products live
Conventional
25% down · 7.5% · 30yr
- Down + closing
- —
- Monthly P&I
- —
- Monthly cashflow
- —
- DSCR
- —
- Eligible?
- —
Personal DTI + credit; lowest rate.
DSCR
20% down · 8.5% · 30yr
- Down + closing
- —
- Monthly P&I
- —
- Monthly cashflow
- —
- DSCR
- —
- Eligible?
- —
No personal income docs; deal must DSCR.
Hard money
10% down · 12.0% · 12mo
- Down + closing
- —
- Monthly P&I
- —
- Monthly cashflow
- —
- DSCR
- —
- Eligible?
- —
Short-term bridge; refi at stabilization.
Rent comps 40 comps
| Address | Beds | Baths | Sqft | Rent | $/sqft | DOM | Units | Dist |
|---|---|---|---|---|---|---|---|---|
| 323 Morgan St Unit C New Orleans, LA | 2.0 | 2.0 | 2000 | $3,200 | $1.60 | 43d | 1 | 0.26mi |
| 323 Morgan St New Orleans, LA | 2.0 | 2.5 | 2000 | $3,600 | $1.80 | 17d | 1 | 0.26mi |
| 323 Morgan St Apt E New Orleans, LA | 2.0 | 2.5 | 2000 | $3,600 | $1.80 | 43d | 1 | 0.26mi |
| 323 Morgan St Unit G New Orleans, LA | 2.0 | 2.5 | 1700 | $2,500 | $1.47 | 43d | 1 | 0.26mi |
| 249 Vallette St New Orleans, LA | 4.0 | 2.0 | 1734 | $2,500 | $1.44 | 16d | 1 | 0.39mi |
| 433 Homer St Unit 1 New Orleans, LA | 4.0 | 2.0 | 1570 | $1,850 | $1.18 | 23d | 1 | 0.39mi |
| 119 Vallette St New Orleans, LA | 3.0 | 2.5 | 1500 | $2,100 | $1.40 | 23d | 1 | 0.43mi |
| 729 Elmira Ave New Orleans, LA | 4.0 | 2.0 | 2000 | $2,000 | $1.00 | 16d | 1 | 0.51mi |
| 336 Elmira Ave New Orleans, LA | 3.0 | 1.0 | 1250 | $1,825 | $1.46 | 23d | 1 | 0.51mi |
| 2 Canal St #2008 New Orleans, LA | 2.0 | 2.5 | 1533 | $9,000 | $5.87 | 2d | 1 | 0.53mi |
| 2 Canal St #2008 New Orleans, LA | 2.0 | 2.5 | 1533 | $9,300 | $6.07 | 16d | 1 | 0.53mi |
| 527 Atlantic Ave New Orleans, LA | 3.0 | 2.0 | 1800 | $2,050 | $1.14 | 23d | 1 | 0.58mi |
| 543 Atlantic Ave New Orleans, LA | 2.0 | 2.5 | 1430 | $2,200 | $1.54 | 23d | 1 | 0.59mi |
| 535 Decatur St Unit 3 New Orleans, LA | 3.0 | 2.0 | 1600 | $2,800 | $1.75 | 11d | 1 | 0.62mi |
| 811 Decatur St Unit 3 New Orleans, LA | 2.0 | 2.0 | 1230 | $2,800 | $2.28 | 43d | 1 | 0.63mi |
| 807 Decatur St #2 New Orleans, LA | 2.0 | 1.5 | 1325 | $3,600 | $2.72 | 43d | 1 | 0.63mi |
| 515 Saint Ann St Unit 3 New Orleans, LA | 3.0 | 2.0 | 1644 | $3,600 | $2.19 | 44d | 1 | 0.65mi |
| 915 Decatur St Unit F New Orleans, LA | 2.0 | 2.0 | 1500 | $2,175 | $1.45 | 23d | 1 | 0.65mi |
| 232 Decatur St Unit 3D New Orleans, LA | 2.0 | 2.0 | 1268 | $2,900 | $2.29 | 43d | 1 | 0.66mi |
| 527 Saint Ann St Unit 3 New Orleans, LA | 3.0 | 2.0 | 1687 | $3,500 | $2.07 | 43d | 1 | 0.66mi |
| 215 Decatur St Unit 405 New Orleans, LA | 2.0 | 2.5 | 1650 | $3,450 | $2.09 | 43d | 1 | 0.70mi |
| 910 Chartres St Unit 3B New Orleans, LA | 2.0 | 2.0 | 1388 | $3,100 | $2.23 | 23d | 1 | 0.70mi |
| 751 Chartres St New Orleans, LA | 2.0–3.0 | 2.0 | 1461 | $3,450 | $2.36 | 43d | 1 | 0.71mi |
| 531 Bienville St Unit 3 New Orleans, LA | 2.0 | 2.0 | 1239 | $3,700 | $2.99 | 23d | 1 | 0.71mi |
| 324 Chartres St Unit B New Orleans, LA | 2.0 | 2.0 | 1750 | $2,250 | $1.29 | 17d | 1 | 0.72mi |
| 700 S Peters St #316 New Orleans, LA | 2.0 | 2.0 | 1250 | $3,250 | $2.60 | 43d | 1 | 0.74mi |
| 431 Gravier St Ste 4 New Orleans, LA | 3.0 | 2.0 | 2100 | $3,700 | $1.76 | 43d | 1 | 0.74mi |
| 431 Gravier St Unit 2 New Orleans, LA | 2.0 | 2.0 | 2100 | $4,000 | $1.90 | 43d | 1 | 0.74mi |
| 433 Gravier St Unit 1 New Orleans, LA | 2.0 | 2.0 | 1400 | $4,000 | $2.86 | 43d | 1 | 0.74mi |
| 627 St Peter New Orleans, LA | 2.0 | 2.5 | 2174 | $5,500 | $2.53 | 23d | 1 | 0.74mi |
| 824 Royal St Unit G New Orleans, LA | 2.0 | 2.0 | 2080 | $3,300 | $1.59 | 43d | 1 | 0.76mi |
| 841 Royal St Unit 3A New Orleans, LA | 2.0 | 2.0 | 1266 | $3,995 | $3.16 | 43d | 1 | 0.78mi |
| 400 Park Blvd Unit A New Orleans, LA | 4.0 | 1.5 | 1275 | $2,200 | $1.73 | 23d | 1 | 0.79mi |
| 513 Park Blvd New Orleans, LA | 3.0 | 2.0 | 1600 | $2,300 | $1.44 | 3d | 1 | 0.85mi |
| 734 Ursulines Ave New Orleans, LA | 3.0 | 2.0 | 1340 | $2,800 | $2.09 | 43d | 1 | 0.87mi |
| 840 Tchoupitoulas St #201 New Orleans, LA | 2.0 | 2.0 | 1298 | $5,000 | $3.85 | 3d | 1 | 0.87mi |
| 840 Tchoupitoulas St #201 New Orleans, LA | 2.0 | 2.0 | 1298 | $5,000 | $3.85 | 16d | 1 | 0.87mi |
| 807 Whitney Ave Unit 1 New Orleans, LA | 3.0 | 2.0 | 1262 | $1,500 | $1.19 | 3d | 1 | 0.89mi |
| 522 Montegut St New Orleans, LA | 1.0–2.0 | 1.0–2.0 | 1256 | $3,500 | $2.79 | 2d | 12 | 0.90mi |
| 810 Bienville St New Orleans, LA | 1.0–3.0 | 1.0–2.0 | 995 | $2,688 | $2.70 | 3d | 9 | 0.91mi |
Listing history 3 events
-
2026-05-14status Pending
-
2026-04-11historical Active Under Contract
-
2026-04-07$345,000 Active
ⓘ Source: listings_history table (triggers on properties + properties_extension) + one-shot
backfill from property_details.listing_events for pre-trigger history.
Nearby sold comps map
Loading sold comps map…
Walkable amenities ~0.75 mi
Loading nearby amenities…
Taxation est. · year 1
- Rental income
- $37,692
- − Mortgage interest
- −$19,325
- − Property taxes
- −$5,175
- − Insurance
- −$1,725
- − Repairs & maintenance
- −$3,015
- − Management
- −$3,015
- − Depreciation
- −$10,036
- Taxable loss
- −$4,600
- Est. tax savings @ 24.0%
- +$1,104
- After-tax cash flow
- $2,270/yr
For passive investors: Depreciation is non-cash, so a rental often shows a tax loss while cash-flowing — sheltering income. Rental losses are passive: they offset passive income freely, and up to $25,000/yr can offset ordinary (W-2) income if you actively participate and your MAGI is under $100k (phasing out to $0 by $150k); unused losses carry forward. On sale, claimed depreciation is recaptured at up to 25%, and gains may owe capital-gains tax (a 1031 exchange can defer both). Figures are a year-1 estimate at your 24.0% rate — not tax advice; consult a CPA.
Condition & rehab AI · 12 photos
This charming double home with a big front porch offers two spacious bedrooms and a cozy back unit. The home is in good condition with no major repairs needed, making it a great investment for both resale and rental.
Value-add opportunities
- Both Paint exterior — Enhances curb appeal and resale value
- Both Replace ceiling fans — Improves aesthetics and energy efficiency
- Both Replace kitchen faucet — Enhances functionality and resale value
Renovation cost estimate screening
Value-add ROI direction
- Both Paint exterior — Enhances curb appeal and resale value ↑
- Both Replace ceiling fans — Improves aesthetics and energy efficiency ↑
- Both Replace kitchen faucet — Enhances functionality and resale value ↑
ⓘ Cost ranges are severity-bucket heuristics (US national rule-of-thumb). Get contractor quotes + a written scope before underwriting a rehab budget.
Schools (NCES district)
- District
- Orleans Parish
- NCES district ID
- 2201170
- Math proficiency
- 11% ▼ -52.00%
- Reading proficiency
- 27% ▼ -46.00%
- Median HH income
- $37,011
- Composite
- 15.78/100
- National rank
- #9271
- State rank
- #69 of 98 in LA
Livability — New Orleans
- Score
- 81/100
- State rank
- #3
- US rank
- #1383
Category grades
Schools grade is shown separately in the Schools card above.
Census & demographics
- Census place
- New Orleans, LA
- County
- Orleans Parish · 338,817 people
- City population
- 338,817
- Metro
- New Orleans-Metairie, LA
- Population (ZIP)
- 22,659
- Household income
- $43,493
- Rent vs Own
- Severe rent burden
- 2240.0
Population outlook (Orleans County) Hauer SSP2
- Today (2025)
- 513,025 people
- By 2030
- 575,781 · +12.2%
- By 2040
- 700,174 · +36.5%
- By 2050
- 826,541 · +61.1%
- By 2075
- 1,123,374 · +119.0%
- By 2100
- 1,355,609 · +164.2%
Race, ethnicity, and origin ACS 2023
- Neighborhood character
- Predominantly Black (72%)
- Race & ethnicity
- Black 72% White 16% Hispanic / Latino 8% Two or more races 5%
- Hispanic origin (detail)
- Mexican 2% Puerto Rican 1%
- Common ancestry
- Lithuanian 3% Slovak 1% Italian 1%
- Foreign-born
- 5% · Canada
- Languages at home
- 91% English-only · Spanish 6% French/Haitian/Cajun 2% Other Indo-European 1%
Political lean MEDSL · Orleans
- 2024 margin
- Solid D (+67.0) · D 82.2% · R 15.2% · Other 2.7%
- 2008→2024 swing
- +6.7pp toward D · 2008: 60.3pp · 2024: 67.0pp
- All cycles
- 2024: D+67.0 2020: D+68.2 2016: D+66.2 2012: D+62.5 2008: D+60.3
Not yet ingested
- Civics
- —
Market trends
- HPI YoY
- ▼ -98.56%
- Current HPI
- 149.0172
- Rent YoY
- ▼ -0.72%
- Metro
- New Orleans-Metairie, LA
- State GDP YoY
- ▲ 3.29%
- F500 in state
- 10
Industry mix (Fortune 500 HQ in LA)
| Industry | F500 HQs | Revenue |
|---|---|---|
| Telecommunications | 2 | $23B |
|
||
| Utilities | 1 | $12B |
|
||
| Wholesale / Distribution | 1 | $5B |
|
||
| Advertising | 1 | $2B |
|
||
Price history
3 events — show timeline
- 2026-05-14 Pending — GSREIN
- 2026-04-11 Contingent — GSREIN
- 2026-04-07 Listed $345,000 GSREIN
Cash-flow waterfall
monthlySold comps — $/sqft
last 12 mo · ≤1 miLoading sold comps…