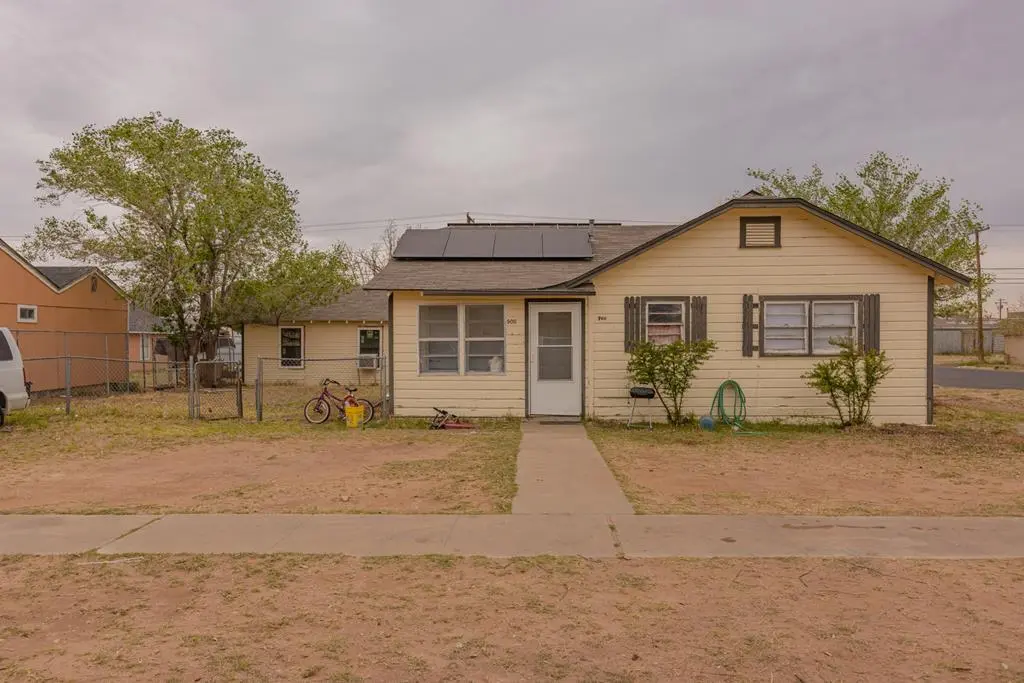
900 N Dotsy Ave · Odessa, TX
Flood risk 1/10 · Minimal
- FEMA flood zone
- X (unshaded)
- Chance of flooding over 30 yrs
- 0.0%
- Est. flood insurance / yr
- $507 – $1,088
Fire risk 2/10 · Minimal
- Est. fire insurance / yr
- $1,222 – $2,270
Heat risk 6/10 · Moderate
- Hot days now (above 102°F)
- 7 days/yr
- Hot days in 30 yrs
- 22 days/yr
Wind risk 2/10 · Minimal
- Chance of severe wind over 30 yrs
- 2.0%
Air-quality risk 1/10 · Minimal
- Unhealthy air days now
- 0 days/yr
- Unhealthy air days in 30 yrs
- 0 days/yr
Risk factors via First Street. Map © Google.
Why this score? — see what drove the C- grade
The composite is a weighted blend of 9 inputs, each scored 0–100. Each bar is that input's sub-score; the figure is the points it added to the 100-point composite (weight × sub-score).
- Cash flow +24.8/30.0
- DSCR +8.1/10.0
- 1% rule +7.1/10.0
- Livability +3.8/5.0
- Rent growth +2.5/5.0
- Condition / age +2.5/5.0
- Schools +2.2/10.0
- ARV discount +0.0/15.0
- Appreciation +0.0/10.0
$145,000
🖨 Deal sheet 📄 Offer letter ✓ Due diligence
Listing remarks MLS
Two homes on one lot. Front home is 2 bedrooms/1bathroom. Back house is a one bedroom/one bathroom. Both homes are on the same meters and landlord pays all utilities. Front house is currently leased at 1400 and back house is leased at 900 per month. Per seller-gas, water, and sewer lines all recently updated. Recent paint inside and outside on front home
Key facts
- Two homes on one lot
- 0.26 acre lot
- Garage
Tags
Neighborhood map
What this means for you Summary
Snapshot
- This is a 2-bed/1.0-bath single-family listed at $145k.
Deal economics
- At list price, monthly cash flow is $309 ($4k/yr) — positive.
- The deal already cash-flows at list — no discount required.
- Meets the 1% rule at list price ($2k rent vs $145k).
- Recommended offer: $132k (9.0% below list) — sets the bar for market timing.
Location & tenants
- Location reads 75/100 on livability (#132 in TX, #3,928 nationally) — a middle-class / working-renter tenant base. Strengths: cost of living A+, housing A+, health & safety A+; Watch: commute D+, amenities D, schools F.
- Ector County ISD (urban): math 22% / reading 27% proficiency, ranked #707 of 826 in TX (top 86%) — low school quality limits family demand, transient renter base, plan for 1-2y turnover.
- Market conditions: 122 active listings in the ZIP; 19 comparable units currently listed for rent nearby; rentals at typical pace (median 21d on market — plan ~3-4 weeks tenant-placement turnaround); 47% of comp listings sitting > 30 days — soft ceiling on asking rent; 1,004 units permitted in Ector County in 2024 (0 in 5+ unit buildings).
- This rent runs 37% of the median local income ($57k/yr) — at the standard rent-burdened threshold; future hikes will face affordability resistance.
Forward outlook
- Local home prices are declining (-3.0%/yr); year-one equity from $1k of loan paydown is wiped out by about $4k of value loss. Plan a longer hold.
- Ector County population projected at +78% by 2050 — long-run rental-demand tailwind backs the buy-and-hold thesis.
Negotiation context
- It's been on market 106 days — a 9% lower offer ($132k) is reasonable based on typical stale-listing flexibility.
- 3 sale attempts since 11y ago; this cycle's ask has dropped $10k (6%) from the opening price — seller is motivated, your offer sets the floor, not the list.
Risks & watch-outs
- Watch-outs: built in 1947 — expect roof / HVAC / electrical / plumbing capex.
- Climate carrying-cost: extreme-heat days projected 7→22/yr by 2055 (HVAC capex compounding) — expect insurance premiums to compound above CPI over the hold.
Questions for the listing agent
- It's been on market 106 days. Have you received any prior offers? Is the seller open to a 9% concession, seller financing, or rate buy-down credit?
- Built in 1947 — when were the roof, HVAC, electrical panel, plumbing, and water heater last replaced?
- Why hasn't it sold? Are there any deal-killer items the seller is aware of (foundation, flood, title, zoning, code violations)?
- Is there a deadline driving the sale (1031 exchange, divorce, estate, relocation)? That informs how much negotiation room exists.
- Schools are F-rated, which usually means shorter tenancies and higher turnover. Who's the typical renter profile here, and what's been the actual vacancy rate?
- What's the average days-on-market for RENTAL listings here right now (not sales)? A rising rental-DOM trend means longer vacancies and softer asking-rent achievability than the comps imply.
- What's the recent tenant-quality profile in this submarket — average credit score on applications, eviction rate, late-payment / NSF rate, and stable-employment percentage? A property-management company in the area should have these aggregated.
- How much new for-sale + rental construction is in the pipeline within 1–3 miles? Heavy new supply typically softens prices + rents 12–24 months out; constrained supply supports both.
Investment metrics
- 1% rule
- 1.21% ✓
- Cap rate
- 8.85%
- Cash-on-cash
- 9.12%
- DSCR
- 1.41
- GRM
- 6.9
CMA / ARV
- ARV (median comp)
- $107,313
- List price
- $145,000
- Delta
- 35.12%
- Verdict
- OVERPRICED
- Comps
- 2 within 1.0 mi
Show comp detail 1 sale within ~0.75 mi
| Address | Dist | Beds/Ba | Sqft | Sold | Price | $/sf | Match |
|---|---|---|---|---|---|---|---|
| 1100 N Washington Ave | 0.26mi | 2/3.0 | 1,233 (+12%) | 19mo | $165,000 | $134 | 44 |
Match score weights: distance 35% · size 25% · config 20% · recency 20%. Top-matched comps best support the ARV.
Projected returns pro-forma
-3.0% appreciation · 3.0% rent growth · sell at horizon
- IRR
- -2.5%
- Equity multiple
- 0.91×
- Total profit
- $-3,763
- Equity at exit
- $21,620
- IRR
- 7.3%
- Equity multiple
- 1.55×
- Total profit
- $22,336
- Equity at exit
- $12,537
Cash invested: $40,600 (down + closing). Projections, not guarantees.
Landlord ↔ Tenant lean methodology
- Overall (STATE)
- 87 Strongly Landlord-Friendly
- State Texas
- 87 Strongly Landlord-Friendly · R+5
- County
- — inherits STATE
- City
- — inherits STATE
ZIP-level market 79763
- Active inventory
- 122
- Price-to-rent
- 6.9×
Monthly cashflow live
- Estimated rent
- $1,756 high interval (Pro) →
- Mortgage (P&I)
- −$760
- Tax from tax record
- −$258 /mo · $3,093/yr
- Insurance
- −$60
- HOA
- −$0
- Vacancy / Maint / Mgmt
- −$369
- Net cashflow
- $309
Break-even live
UW: 25.0% down · 7.5% · 30yr · 1.5% tax · 5.0% vac · 8.0% maint · 8.0% mgmt
Financing live
Cash to close
- Down payment
- $36,250
- Closing costs
- $4,350
- Reserves months
- —
- Total cash needed
- —
Loan-product check · same deal, 3 products live
Conventional
25% down · 7.5% · 30yr
- Down + closing
- —
- Monthly P&I
- —
- Monthly cashflow
- —
- DSCR
- —
- Eligible?
- —
Personal DTI + credit; lowest rate.
DSCR
20% down · 8.5% · 30yr
- Down + closing
- —
- Monthly P&I
- —
- Monthly cashflow
- —
- DSCR
- —
- Eligible?
- —
No personal income docs; deal must DSCR.
Hard money
10% down · 12.0% · 12mo
- Down + closing
- —
- Monthly P&I
- —
- Monthly cashflow
- —
- DSCR
- —
- Eligible?
- —
Short-term bridge; refi at stabilization.
Rent comps 19 comps
| Address | Beds | Baths | Sqft | Rent | $/sqft | DOM | Units | Dist |
|---|---|---|---|---|---|---|---|---|
| 1322 N Lincoln Ave Odessa, TX | 3.0 | 1.0 | 1218 | $2,200 | $1.81 | 43d | 1 | 0.52mi |
| 1322 N Lincoln Ave Odessa, TX | 3.0 | 1.0 | 1218 | $2,100 | $1.72 | 20d | 1 | 0.52mi |
| 715 N Kelly Ave Odessa, TX | 2.0 | 1.0 | 1170 | $2,000 | $1.71 | 20d | 1 | 0.54mi |
| 1604 N Sam Houston Ave Odessa, TX | 2.0 | 1.0 | 1142 | $2,000 | $1.75 | 43d | 1 | 0.64mi |
| 200 Santa Rita Dr Odessa, TX | 3.0 | 2.0 | 1438 | $2,400 | $1.67 | 43d | 1 | 0.68mi |
| 1315 N Jackson Ave Odessa, TX | 3.0 | 2.0 | 1216 | $1,500 | $1.23 | 13d | 1 | 0.71mi |
| 1501 N Texas Ave Unit A Odessa, TX | 2.0 | 1.0 | 925 | $1,450 | $1.57 | 13d | 1 | 0.72mi |
| 401 Lasseter Ave Odessa, TX | 1.0 | 1.0 | 900 | $950 | $1.06 | 20d | 1 | 0.75mi |
| 1101 W 19th St Unit 1 Odessa, TX | 1.0 | 1.0 | 700 | $1,000 | $1.43 | 43d | 1 | 0.86mi |
| 1015 Milburn Ave Unit A2CBUILDING A Odessa, TX | 3.0 | 1.0 | 895 | $1,450 | $1.62 | 20d | 1 | 0.99mi |
| 1015 Milburn Ave Unit A1DBuilding A Odessa, TX | 3.0 | 1.0 | 895 | $1,500 | $1.68 | 13d | 1 | 0.99mi |
| 1220 Adams Ave Unit 3 Odessa, TX | 3.0 | 1.0 | 895 | $1,450 | $1.62 | 43d | 1 | 1.00mi |
| 1215 Milburn Ave Unit J1TBUILDING J Odessa, TX | 3.0 | 1.0 | 895 | $1,500 | $1.68 | 43d | 1 | 1.01mi |
| 1215 Milburn Ave Unit J2VBUILDING J Odessa, TX | 3.0 | 1.0 | 895 | $1,450 | $1.62 | 43d | 1 | 1.02mi |
| 1219 Milburn Ave Unit K2YBUILDING K Odessa, TX | 3.0 | 1.0 | 895 | $1,500 | $1.68 | 43d | 1 | 1.02mi |
| 1318 Harless Ave Odessa, TX | 2.0 | 1.5 | 1200 | $1,600 | $1.33 | 20d | 1 | 1.28mi |
| 1322 Harless Ave Unit 1 Odessa, TX | 2.0 | 1.5 | 1200 | $1,700 | $1.42 | 43d | 1 | 1.29mi |
| 2439 W 15th St Odessa, TX | 3.0 | 2.0 | 1175 | $1,500 | $1.28 | 13d | 1 | 1.31mi |
| 2 Star Cir Odessa, TX | 3.0 | 2.0 | 1377 | $2,200 | $1.60 | 13d | 1 | 1.49mi |
Listing history 15 events
-
2026-06-10days on market $145,000 Active 106 DOM
-
2026-06-09days on market $145,000 Active 105 DOM
-
2026-06-08days on market $145,000 Active 104 DOM
-
2026-06-07pricedays on market $145,000 Active 103 DOM
-
2026-06-03days on market $155,000 Active 98 DOM
-
2026-06-01days on market $155,000 Active 97 DOM
-
2026-05-31days on market $155,000 Active 96 DOM
-
2026-05-30days on market $155,000 Active 95 DOM
-
2026-02-24$155,000 Active 356-char remark
Show marketing remark (356 chars)
Two homes on one lot. Front home is 2 bedrooms/1bathroom. Back house is a one bedroom/one bathroom. Both homes are on the same meters and landlord pays all utilities. Front house is currently leased at 1400 and back house is leased at 900 per month. Per seller-gas, water, and sewer lines all recently updated. Recent paint inside and outside on front home
-
2026-02-20historical $1,425
-
2026-02-18$1,425
-
2015-12-02soldstatus
-
2015-11-30soldstatus 388-char remark
Show marketing remark (388 chars)
TWO HOME ON A LOT. FRONT HOUSE IS A 2 BEDROOM-1 BATH AND HAS NEW CARPET IN BEDROOMS AND LIVING ROOM. AND RECENT LINOLEUM IN KITCHEN AND BATHROOM HAS REFRIGERATED AIR AND CENTROL HEAT. NEW FRONT DOOR AND FRESH PAINT. SHOWS WELL. BACK HOUSE IS A 1BEDROOM AND 1 BATH AND LIVING ROOM SMALL KITCHEN WITH REFRIGERATOR AND STOVE AND RENT FOR $ 750 PER MONTHS AND LANDLORD PAYS FOR ALL UTILITIES.
-
2015-09-25$110,000 388-char remark
Show marketing remark (388 chars)
TWO HOME ON A LOT. FRONT HOUSE IS A 2 BEDROOM-1 BATH AND HAS NEW CARPET IN BEDROOMS AND LIVING ROOM. AND RECENT LINOLEUM IN KITCHEN AND BATHROOM HAS REFRIGERATED AIR AND CENTROL HEAT. NEW FRONT DOOR AND FRESH PAINT. SHOWS WELL. BACK HOUSE IS A 1BEDROOM AND 1 BATH AND LIVING ROOM SMALL KITCHEN WITH REFRIGERATOR AND STOVE AND RENT FOR $ 750 PER MONTHS AND LANDLORD PAYS FOR ALL UTILITIES.
-
1991-08-01soldstatus
ⓘ Source: listings_history table (triggers on properties + properties_extension) + one-shot
backfill from property_details.listing_events for pre-trigger history.
Tax reassessment forecast TX · Resets to sale price
- Current annual tax
- $3,093 · $258/mo
- Projected year-2 tax
- $3,093 · $258/mo
- Expected delta
- $0/yr ($0/mo · 0.0%)
ⓘ Screening estimate from a state-policy table — verify with the county assessor before closing.
Climate risk First Street
- Flood 1/10 Low FEMA zone X (unshaded) · 0% chance over 30 yrs
- Wildfire 2/10 Low
- Heat 6/10 Major 7 d/yr ≥102°F today · 22 d/yr by 30 yrs out
- Wind 2/10 Low 2% chance of damaging wind over 30 yrs
- Air quality 1/10 Low 0 unhealthy d/yr today · 0 by 30 yrs out
Nearby sold comps map
Loading sold comps map…
Walkable amenities ~0.75 mi
Loading nearby amenities…
Taxation est. · year 1
- Rental income
- $21,071
- − Mortgage interest
- −$8,122
- − Property taxes
- −$3,093
- − Insurance
- −$725
- − Repairs & maintenance
- −$1,686
- − Management
- −$1,686
- − Depreciation
- −$4,218
- Taxable income
- $1,542
- Est. tax owed @ 24.0%
- −$370
- After-tax cash flow
- $3,334/yr
For passive investors: Depreciation is non-cash, so a rental often shows a tax loss while cash-flowing — sheltering income. Rental losses are passive: they offset passive income freely, and up to $25,000/yr can offset ordinary (W-2) income if you actively participate and your MAGI is under $100k (phasing out to $0 by $150k); unused losses carry forward. On sale, claimed depreciation is recaptured at up to 25%, and gains may owe capital-gains tax (a 1031 exchange can defer both). Figures are a year-1 estimate at your 24.0% rate — not tax advice; consult a CPA.
Schools (NCES district)
- District
- Ector County ISD
- NCES district ID
- 4818000
- Math proficiency
- 22% ▼ -9.00%
- Reading proficiency
- 27% ▼ -4.00%
- Median HH income
- $52,740
- Composite
- 21.89/100
- National rank
- #8233
- State rank
- #707 of 826 in TX
Livability — Odessa
- Score
- 75/100
- State rank
- #132
- US rank
- #3928
Category grades
Schools grade is shown separately in the Schools card above.
Census & demographics
- Census place
- Odessa, TX
- County
- Ector County · 131,169 people
- City population
- 131,169
- Metro
- Odessa, TX
- Population (ZIP)
- 35,174
- Household income
- $56,877
- Rent vs Own
- Severe rent burden
- 842.0
Population outlook (Ector County) Hauer SSP2
- Today (2025)
- 212,765 people
- By 2030
- 241,962 · +13.7%
- By 2040
- 306,582 · +44.1%
- By 2050
- 379,755 · +78.5%
- By 2075
- 568,991 · +167.4%
- By 2100
- 709,829 · +233.6%
Race, ethnicity, and origin ACS 2023
- Neighborhood character
- Predominantly Hispanic (76%)
- Race & ethnicity
- Hispanic / Latino 76% Two or more races 24% White 19% Black 2%
- Hispanic origin (detail)
- Mexican 72%
- Common ancestry
- Lithuanian 1% Slovak 1%
- Foreign-born
- 22% · Canada
- Languages at home
- 39% English-only · Spanish 60%
Political lean MEDSL · Ector
- 2024 margin
- Solid R (+52.9) · D 23.2% · R 76.1%
- 2008→2024 swing
- -4.9pp toward R · 2008: -48.0pp · 2024: -52.9pp
- All cycles
- 2024: R+52.9 2020: R+47.8 2016: R+40.6 2012: R+48.9 2008: R+48.0
Not yet ingested
- Civics
- —
Market trends
- HPI YoY
- ▼ -213.81%
- Current HPI
- 254.9773
- Rent YoY
- —
- Metro
- Odessa, TX
- State GDP YoY
- ▲ 3.95%
- F500 in state
- 110
Industry mix (Fortune 500 HQ in TX)
| Industry | F500 HQs | Revenue |
|---|---|---|
| Energy | 16 | $1,198B |
|
||
| Technology | 5 | $198B |
|
||
| Engineering / Construction | 4 | $72B |
|
||
| Energy Services | 3 | $60B |
|
||
| Utilities | 3 | $41B |
|
||
| Healthcare | 2 | $330B |
|
||
Price history
+40.9% since first listed7 events — show timeline
- 2026-02-24 Listed $155,000 ODMLS
- 2026-02-20 Rental Removed $1,425 ODMLS
- 2026-02-18 Listed for Rent $1,425 ODMLS
- 2015-12-02 Sold (Public Records) — Public Records
- 2015-11-30 Sold (MLS) — ODMLS
- 2015-09-25 Listed $110,000 ODMLS
- 1991-08-01 Sold (Public Records) — Public Records
Property tax history
+7.4%/yrLatest (2025): $3,093 · +15.5% YoY. Source: county tax records.
Cash-flow waterfall
monthlySold comps — $/sqft
last 12 mo · ≤1 miLoading sold comps…