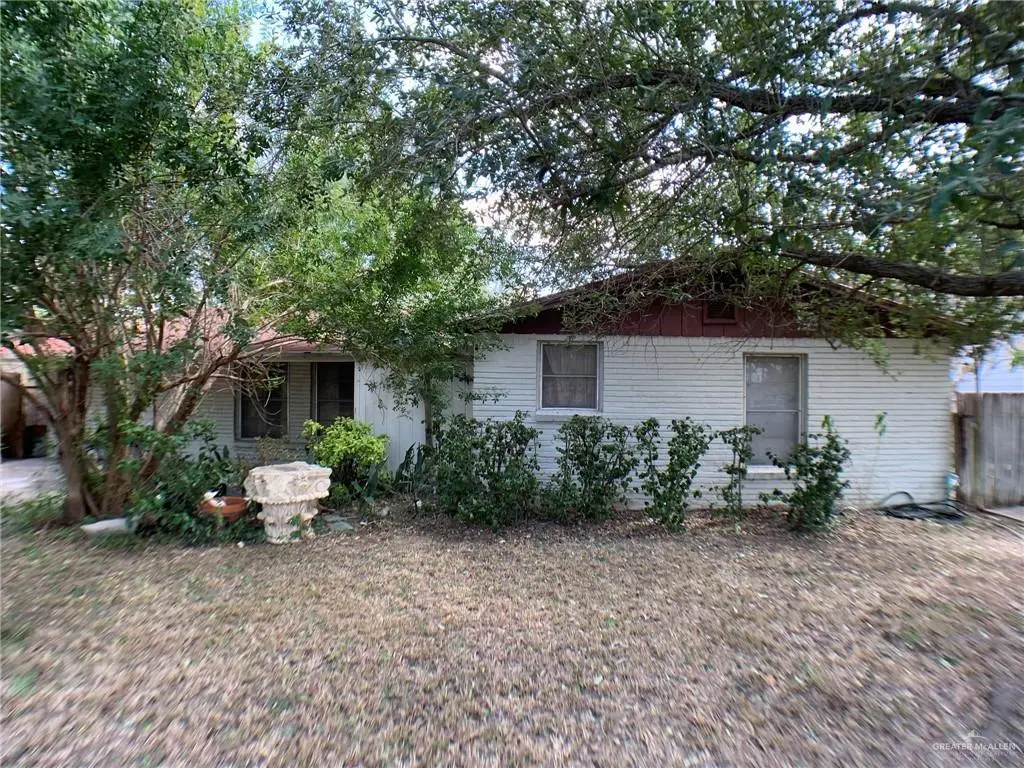
817 E Parkwood Dr · Harlingen, TX
Flood risk 1/10 · Minimal
- FEMA flood zone
- X (unshaded)
- Chance of flooding over 30 yrs
- 0.0%
- Est. flood insurance / yr
- $507 – $1,088
Fire risk 4/10 · Minor
- Est. fire insurance / yr
- $1,222 – $2,270
Heat risk 9/10 · Severe
- Hot days now (above 110°F)
- 7 days/yr
- Hot days in 30 yrs
- 25 days/yr
Wind risk 8/10 · Major
- Chance of severe wind over 30 yrs
- 99.0%
Air-quality risk 1/10 · Minimal
- Unhealthy air days now
- 0 days/yr
- Unhealthy air days in 30 yrs
- 0 days/yr
Risk factors via First Street. Map © Google.
Why this score? — see what drove the B- grade
The composite is a weighted blend of 9 inputs, each scored 0–100. Each bar is that input's sub-score; the figure is the points it added to the 100-point composite (weight × sub-score).
- Cash flow +30.0/30.0
- 1% rule +10.0/10.0
- DSCR +10.0/10.0
- ARV discount +7.5/15.0
- Livability +3.7/5.0
- Rent growth +3.4/5.0
- Schools +2.5/10.0
- Condition / age +2.5/5.0
- Appreciation +0.0/10.0
$89,000
🖨 Deal sheet 📄 Offer letter ✓ Due diligence
Listing remarks MLS
Investor opportunity. Property has known foundation issues, will need a new roof, and requires full interior and exterior updates. Sold as-is. Not suitable for FHA or VA financing. Ideal for investors or cash buyers looking for a value-add renovation project. Buyer to verify all information, condition, and repair estimates. Schedule your showing today before it's gone.
Key facts
- 9,646 sq ft lot
- Built 1952
- Listed 179 days
Neighborhood map
What this means for you Summary
Snapshot
- This is a 4-bed/2.0-bath single-family listed at $89k.
Deal economics
- At list price, monthly cash flow is $413 ($5k/yr) — positive.
- The deal already cash-flows at list — no discount required.
- Meets the 1% rule at list price ($1k rent vs $89k).
- Recommended offer: $78k (12.0% below list) — sets the bar for market timing.
- Cap rate 11.9% vs local median 3.8% in Harlingen — top-decile yield for the area; either an underpriced asset or a hidden risk that comps aren't pricing in. Stress-test before assuming the spread holds.
Location & tenants
- Location reads 73/100 on livability (#217 in TX) — a middle-class / working-renter tenant base. Strengths: amenities A+, cost of living A+, housing A+; Watch: crime C-, schools D+, commute F.
- Harlingen CISD (urban): math 25% / reading 35% proficiency, ranked #647 of 826 in TX (top 78%) — families likely to look elsewhere, expect single-tenant / working-renter base with shorter leases; 74% free/reduced lunch — lower-income household profile, screen leases tightly.
- Market conditions: Rents rising (+3.5%/yr); 465 active listings in the ZIP; 28 comparable units currently listed for rent nearby; rentals lingering (median 44d on market — plan ~5-8 weeks vacancy on turnover, expect pricing pressure); 54% of comp listings sitting > 30 days — soft ceiling on asking rent; 2,326 units permitted in Cameron County in 2024 (503 in 5+ unit buildings).
- This rent runs 35% of the median local income ($49k/yr) — at the standard rent-burdened threshold; future hikes will face affordability resistance.
Forward outlook
- Local home prices are declining (-3.0%/yr); year-one equity from $615 of loan paydown is wiped out by about $3k of value loss. Plan a longer hold.
- Cameron County population projected at +3% by 2050 — modest demand growth; plan on rents tracking national, not racing it.
- At projected returns (-3.0% appreciation + 3.5% rent growth), your $25k cash investment doubles in ~6 years — after that, you're playing with house money.
Negotiation context
- It's been on market 179 days — a 12% lower offer ($78k) is reasonable based on typical stale-listing flexibility.
- 2 sale attempts; this cycle's ask has dropped $60k (40%) from the opening price — seller is motivated, your offer sets the floor, not the list.
Risks & watch-outs
- Watch-outs: property tax is 3.0% of price; built in 1952 — expect roof / HVAC / electrical / plumbing capex.
- Climate carrying-cost: severe wind risk, 99% chance of damaging wind over 30y; extreme-heat days projected 7→25/yr by 2055 (HVAC capex compounding) — expect insurance premiums to compound above CPI over the hold.
Questions for the listing agent
- It's been on market 179 days. Have you received any prior offers? Is the seller open to a 12% concession, seller financing, or rate buy-down credit?
- Built in 1952 — when were the roof, HVAC, electrical panel, plumbing, and water heater last replaced?
- Property tax is high relative to price — has the assessment been appealed recently, and will the sale trigger a re-assessment?
- Why hasn't it sold? Are there any deal-killer items the seller is aware of (foundation, flood, title, zoning, code violations)?
- Is there a deadline driving the sale (1031 exchange, divorce, estate, relocation)? That informs how much negotiation room exists.
- Schools are D-rated, which usually means shorter tenancies and higher turnover. Who's the typical renter profile here, and what's been the actual vacancy rate?
- What's the average days-on-market for RENTAL listings here right now (not sales)? A rising rental-DOM trend means longer vacancies and softer asking-rent achievability than the comps imply.
- What's the recent tenant-quality profile in this submarket — average credit score on applications, eviction rate, late-payment / NSF rate, and stable-employment percentage? A property-management company in the area should have these aggregated.
- How much new for-sale + rental construction is in the pipeline within 1–3 miles? Heavy new supply typically softens prices + rents 12–24 months out; constrained supply supports both.
Investment metrics
- 1% rule
- 1.62% ✓
- Cap rate
- 11.87%
- Cash-on-cash
- 19.91%
- DSCR
- 1.89
- GRM
- 5.1
CMA / ARV
- ARV (median comp)
- $180,564
- List price
- $89,000
- Delta
- -47.39%
- Verdict
- UNDERPRICED
- Comps
- 20 within 1.0 mi
Show comp detail 6 sales within ~0.75 mi
| Address | Dist | Beds/Ba | Sqft | Sold | Price | $/sf | Match |
|---|---|---|---|---|---|---|---|
| 1913 Laurel Dr | 0.08mi | 3/2.0 (-1) | 1,672 (-1%) | 4mo | $209,900 | $126 | 87 |
| 1647 Hamilton St | 0.52mi | 3/1.5 (-1) | 1,629 (-3%) | 11mo | $130,000 | $80 | 54 |
| 208 Parkview Cir | 0.46mi | 3/2.0 (-1) | 1,505 (-11%) | 13mo | $235,000 | $156 | 45 |
| 1110 E Polk Ave | 0.66mi | 4/1.5 | 1,761 (+4%) | 21mo | $199,900 | $114 | 43 |
| 2114 Lisa Ann Ave | 0.75mi | 3/2.0 (-1) | 1,528 (-9%) | 12mo | $190,000 | $124 | 34 |
| 1200 E Pierce Ave | 0.58mi | 3/1.5 (-1) | 1,454 (-14%) | 18mo | $165,000 | $113 | 28 |
Match score weights: distance 35% · size 25% · config 20% · recency 20%. Top-matched comps best support the ARV.
Projected returns pro-forma
-3.0% appreciation · 3.45% rent growth · sell at horizon
- IRR
- 12.7%
- Equity multiple
- 1.51×
- Total profit
- $12,657
- Equity at exit
- $13,270
- IRR
- 22.0%
- Equity multiple
- 2.93×
- Total profit
- $48,016
- Equity at exit
- $7,695
Cash invested: $24,920 (down + closing). Projections, not guarantees.
Landlord ↔ Tenant lean methodology
- Overall (STATE)
- 87 Strongly Landlord-Friendly
- State Texas
- 87 Strongly Landlord-Friendly · R+5
- County
- — inherits STATE
- City
- — inherits STATE
ZIP-level market 78550
- Rents YoY
- 3.5%
- Active inventory
- 465
- Price-to-rent
- 5.1×
Monthly cashflow live
- Estimated rent
- $1,444 high interval (Pro) →
- Mortgage (P&I)
- −$467
- Tax from tax record
- −$224 /mo · $2,684/yr
- Insurance
- −$37
- HOA
- −$0
- Vacancy / Maint / Mgmt
- −$303
- Net cashflow
- $413
Break-even live
UW: 25.0% down · 7.5% · 30yr · 1.5% tax · 5.0% vac · 8.0% maint · 8.0% mgmt
Financing live
Cash to close
- Down payment
- $22,250
- Closing costs
- $2,670
- Reserves months
- —
- Total cash needed
- —
Loan-product check · same deal, 3 products live
Conventional
25% down · 7.5% · 30yr
- Down + closing
- —
- Monthly P&I
- —
- Monthly cashflow
- —
- DSCR
- —
- Eligible?
- —
Personal DTI + credit; lowest rate.
DSCR
20% down · 8.5% · 30yr
- Down + closing
- —
- Monthly P&I
- —
- Monthly cashflow
- —
- DSCR
- —
- Eligible?
- —
No personal income docs; deal must DSCR.
Hard money
10% down · 12.0% · 12mo
- Down + closing
- —
- Monthly P&I
- —
- Monthly cashflow
- —
- DSCR
- —
- Eligible?
- —
Short-term bridge; refi at stabilization.
Rent comps 28 comps
| Address | Beds | Baths | Sqft | Rent | $/sqft | DOM | Units | Dist |
|---|---|---|---|---|---|---|---|---|
| 1902 E Tyler Ave Harlingen, TX | 2.0–3.0 | 1.0–2.0 | 1007 | $1,060 | $1.05 | 13d | 6 | 0.24mi |
| 2612 E Harrison Ave Unit 4 Harlingen, TX | 3.0 | 2.0 | 1118 | $1,225 | $1.10 | 43d | 1 | 0.51mi |
| 2405 E Van Buren Ave Harlingen, TX | 3.0 | 1.0 | 1370 | $1,350 | $0.99 | 43d | 1 | 0.53mi |
| 2708 E Harrison Ave Unit 2 Harlingen, TX | 3.0 | 2.0 | 1118 | $1,225 | $1.10 | 43d | 1 | 0.54mi |
| 2712 E Harrison Ave Unit 4 Harlingen, TX | 3.0 | 2.0 | 1118 | $1,225 | $1.10 | 43d | 1 | 0.55mi |
| 2209 E Jackson St Harlingen, TX | 4.0 | 2.0 | 1356 | $1,250 | $0.92 | 43d | 1 | 0.57mi |
| 2014 E Monroe Ave Harlingen, TX | 3.0 | 1.0 | 1148 | $1,350 | $1.18 | 21d | 1 | 0.59mi |
| 2805 E Harrison Ave Apt 4 Harlingen, TX | 3.0 | 2.0 | 1118 | $1,225 | $1.10 | 21d | 1 | 0.62mi |
| 2809 E Harrison Ave Unit 2 Harlingen, TX | 3.0 | 2.0 | 1118 | $1,225 | $1.10 | 43d | 1 | 0.62mi |
| 1809 Pease St Unit B Harlingen, TX | 3.0 | 2.0 | 1442 | $2,500 | $1.73 | 43d | 1 | 0.62mi |
| 1501 Sam Houston Dr Harlingen, TX | 3.0 | 1.5 | 1216 | $1,004 | $0.83 | 44d | 1 | 0.75mi |
| 2821 Lotus St Harlingen, TX | 3.0 | 2.0 | 1946 | $1,900 | $0.98 | 43d | 1 | 0.80mi |
| 1802 E Washington Ave Unit 44 Harlingen, TX | 3.0 | 2.0 | 1056 | $1,050 | $0.99 | 13d | 1 | 0.85mi |
| 1802 E Washington Ave Unit 94 Harlingen, TX | 3.0 | 2.0 | 1056 | $825 | $0.78 | 13d | 1 | 0.85mi |
| 1802 E Washington Ave Harlingen, TX | 1.0–3.0 | 1.0–2.0 | 848 | $1,050 | $1.24 | 21d | 1 | 0.88mi |
| 2813 Quail Run St Unit A Harlingen, TX | 3.0 | 2.5 | 1450 | $1,450 | $1.00 | 43d | 1 | 0.93mi |
| 2906 Treasure Hills Blvd Unit C Harlingen, TX | 3.0 | 2.0 | 1220 | $1,250 | $1.02 | 21d | 1 | 0.97mi |
| 1600 Clinton St Unit 1 Harlingen, TX | 3.0 | 2.0 | 1050 | $1,495 | $1.42 | 43d | 1 | 1.03mi |
| 1604 Clinton St Unit 1 Harlingen, TX | 3.0 | 2.0 | 1050 | $1,495 | $1.42 | 43d | 1 | 1.03mi |
| 1802 Bobcat Ln Harlingen, TX | 3.0 | 2.0 | 1100 | $1,450 | $1.32 | 13d | 1 | 1.07mi |
| 2802 Austrian Pine Ct Harlingen, TX | 3.0 | 2.0 | 1614 | $1,650 | $1.02 | 13d | 1 | 1.10mi |
| 1827 Pheasant Dr Harlingen, TX | 3.0 | 2.5 | 1307 | $1,650 | $1.26 | 13d | 1 | 1.10mi |
| 2901 Haine Dr Harlingen, TX | 3.0 | 2.0 | 1111 | $1,389 | $1.25 | 13d | 1 | 1.25mi |
| 3701 N Arroyo Park Ln Unit 2 Harlingen, TX | 3.0 | 2.5 | 1400 | $1,400 | $1.00 | 13d | 1 | 1.27mi |
| 3701 N Arroyo Park Ln #1 Harlingen, TX | 4.0 | 3.5 | 1700 | $1,500 | $0.88 | 13d | 1 | 1.27mi |
| 3509 N Arroyo Park Ln Unit B Harlingen, TX | 3.0 | 2.0 | 1244 | $1,450 | $1.17 | 43d | 1 | 1.28mi |
| 813 W Arroyo Park Ln Apt B Harlingen, TX | 3.0 | 2.5 | 1200 | $1,300 | $1.08 | 43d | 1 | 1.32mi |
| 1813 Lazy Lake Dr Harlingen, TX | 3.0 | 2.0 | 1836 | $2,400 | $1.31 | 43d | 1 | 1.36mi |
Listing history 9 events
-
2026-06-01pricestatusdays on market $89,000 Pending 179 DOM
-
2026-05-31days on market $95,000 Active 165 DOM
-
2026-05-30days on market $95,000 Active 164 DOM
-
2026-04-29status Pending 371-char remark
Show marketing remark (371 chars)
Investor opportunity. Property has known foundation issues, will need a new roof, and requires full interior and exterior updates. Sold as-is. Not suitable for FHA or VA financing. Ideal for investors or cash buyers looking for a value-add renovation project. Buyer to verify all information, condition, and repair estimates. Schedule your showing today before it's gone.
-
2026-04-17price $89,000 371-char remark
Show marketing remark (371 chars)
Investor opportunity. Property has known foundation issues, will need a new roof, and requires full interior and exterior updates. Sold as-is. Not suitable for FHA or VA financing. Ideal for investors or cash buyers looking for a value-add renovation project. Buyer to verify all information, condition, and repair estimates. Schedule your showing today before it's gone.
-
2026-01-29price $95,000 371-char remark
Show marketing remark (377 chars)
Investor opportunity. Property has known foundation issues, will need a new roof, and requires full interior and exterior updates. Sold as-is. Not suitable for FHA or VA financing. Ideal for investors or cash buyers looking for a value-add renovation project. Buyer to verify all information, condition, and repair estimates. Schedule your showing today before it’s gone.
-
2026-01-29price $95,000 377-char remark
Show marketing remark (377 chars)
Investor opportunity. Property has known foundation issues, will need a new roof, and requires full interior and exterior updates. Sold as-is. Not suitable for FHA or VA financing. Ideal for investors or cash buyers looking for a value-add renovation project. Buyer to verify all information, condition, and repair estimates. Schedule your showing today before it’s gone.
-
2025-12-17$149,000 Active 377-char remark
Show marketing remark (377 chars)
Investor opportunity. Property has known foundation issues, will need a new roof, and requires full interior and exterior updates. Sold as-is. Not suitable for FHA or VA financing. Ideal for investors or cash buyers looking for a value-add renovation project. Buyer to verify all information, condition, and repair estimates. Schedule your showing today before it’s gone.
-
2025-11-01$149,900 Active 371-char remark
Show marketing remark (371 chars)
Investor opportunity. Property has known foundation issues, will need a new roof, and requires full interior and exterior updates. Sold as-is. Not suitable for FHA or VA financing. Ideal for investors or cash buyers looking for a value-add renovation project. Buyer to verify all information, condition, and repair estimates. Schedule your showing today before it's gone.
ⓘ Source: listings_history table (triggers on properties + properties_extension) + one-shot
backfill from property_details.listing_events for pre-trigger history.
Tax reassessment forecast TX · Resets to sale price
- Current annual tax
- $2,684 · $224/mo
- Projected year-2 tax
- $2,684 · $224/mo
- Expected delta
- $0/yr ($0/mo · 0.0%)
ⓘ Screening estimate from a state-policy table — verify with the county assessor before closing.
Climate risk First Street
- Flood 1/10 Low FEMA zone X (unshaded) · 0% chance over 30 yrs
- Wildfire 4/10 Moderate
- Heat 9/10 Extreme 7 d/yr ≥110°F today · 25 d/yr by 30 yrs out
- Wind 8/10 Severe 99% chance of damaging wind over 30 yrs
- Air quality 1/10 Low 0 unhealthy d/yr today · 0 by 30 yrs out
Nearby sold comps map
Loading sold comps map…
Walkable amenities ~0.75 mi
Loading nearby amenities…
Taxation est. · year 1
- Rental income
- $17,330
- − Mortgage interest
- −$4,985
- − Property taxes
- −$2,684
- − Insurance
- −$445
- − Repairs & maintenance
- −$1,386
- − Management
- −$1,386
- − Depreciation
- −$2,589
- Taxable income
- $3,854
- Est. tax owed @ 24.0%
- −$925
- After-tax cash flow
- $4,036/yr
For passive investors: Depreciation is non-cash, so a rental often shows a tax loss while cash-flowing — sheltering income. Rental losses are passive: they offset passive income freely, and up to $25,000/yr can offset ordinary (W-2) income if you actively participate and your MAGI is under $100k (phasing out to $0 by $150k); unused losses carry forward. On sale, claimed depreciation is recaptured at up to 25%, and gains may owe capital-gains tax (a 1031 exchange can defer both). Figures are a year-1 estimate at your 24.0% rate — not tax advice; consult a CPA.
Schools (NCES district)
- District
- Harlingen CISD
- NCES district ID
- 4822530
- Math proficiency
- 25% ▼ -28.00%
- Reading proficiency
- 35% ▼ -11.00%
- Median HH income
- $37,182
- Composite
- 24.94/100
- National rank
- #7566
- State rank
- #647 of 826 in TX
Livability — Harlingen
- Score
- 73/100
- State rank
- #217
- US rank
- #5347
Category grades
Schools grade is shown separately in the Schools card above.
Census & demographics
- Census place
- Harlingen, TX
- County
- Cameron County · 310,734 people
- City population
- 95,667
- Metro
- Brownsville-Harlingen, TX
- Population (ZIP)
- 53,335
- Household income
- $49,007
- Rent vs Own
- Severe rent burden
- 2251.0
Population outlook (Cameron County) Hauer SSP2
- Today (2025)
- 441,603 people
- By 2030
- 448,113 · +1.5%
- By 2040
- 456,385 · +3.3%
- By 2050
- 456,294 · +3.3%
- By 2075
- 423,851 · -4.0%
- By 2100
- 342,787 · -22.4%
Race, ethnicity, and origin ACS 2023
- Neighborhood character
- Predominantly Hispanic (83%)
- Race & ethnicity
- Hispanic / Latino 83% Two or more races 29% White 14% Black 1%
- Hispanic origin (detail)
- Mexican 76%
- Common ancestry
- Italian 1% Lithuanian 1%
- Foreign-born
- 14% · Canada
- Languages at home
- 51% English-only · Spanish 48%
Political lean MEDSL · Cameron
- 2024 margin
- Lean R (+5.8) · D 46.7% · R 52.5%
- 2008→2024 swing
- -34.6pp toward R · 2008: 28.8pp · 2024: -5.8pp
- All cycles
- 2024: R+5.8 2020: D+13.2 2016: D+32.5 2012: D+32.4 2008: D+28.8
Not yet ingested
- Civics
- —
Market trends
- HPI YoY
- ▼ -142.60%
- Current HPI
- 167.7038
- Rent YoY
- ▲ 3.45%
- Metro
- Brownsville-Harlingen, TX
- State GDP YoY
- ▲ 3.95%
- F500 in state
- 110
Industry mix (Fortune 500 HQ in TX)
| Industry | F500 HQs | Revenue |
|---|---|---|
| Energy | 16 | $1,198B |
|
||
| Technology | 5 | $198B |
|
||
| Engineering / Construction | 4 | $72B |
|
||
| Energy Services | 3 | $60B |
|
||
| Utilities | 3 | $41B |
|
||
| Healthcare | 2 | $330B |
|
||
Price history
-40.6% since first listed6 events — show timeline
- 2026-04-29 Pending — RGVMLS
- 2026-04-17 Price Changed $89,000 RGVMLS
- 2026-01-29 Price Changed $95,000 RGVMLS
- 2026-01-29 Price Changed $95,000 MCALLENMLS
- 2025-12-17 Listed $149,000 MCALLENMLS
- 2025-11-01 Listed $149,900 RGVMLS
Property tax history
+2.8%/yrLatest (2025): $2,684 · -30.2% YoY. Source: county tax records.
Cash-flow waterfall
monthlySold comps — $/sqft
last 12 mo · ≤1 miLoading sold comps…