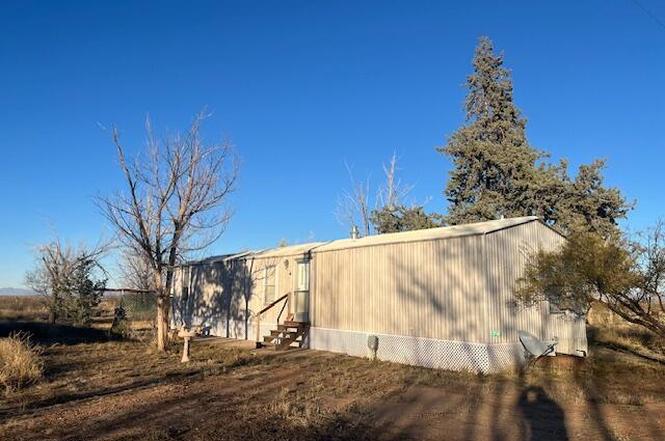
1171 E Desert Rose Dr · Sunsites, AZ
Flood risk 1/10 · Minimal
- FEMA flood zone
- X (unshaded)
- Chance of flooding over 30 yrs
- 0.0%
- Est. flood insurance / yr
- $507 – $1,088
Fire risk 7/10 · Major
- Est. fire insurance / yr
- $610 – $1,132
Heat risk 6/10 · Moderate
- Hot days now (above 99°F)
- 7 days/yr
- Hot days in 30 yrs
- 19 days/yr
Wind risk 1/10 · Minimal
- Chance of severe wind over 30 yrs
- —
Air-quality risk 1/10 · Minimal
- Unhealthy air days now
- 0 days/yr
- Unhealthy air days in 30 yrs
- 0 days/yr
Risk factors via First Street. Map © Google.
Why this score? — see what drove the B- grade
The composite is a weighted blend of 9 inputs, each scored 0–100. Each bar is that input's sub-score; the figure is the points it added to the 100-point composite (weight × sub-score).
- Cash flow +30.0/30.0
- 1% rule +10.0/10.0
- DSCR +10.0/10.0
- ARV discount +7.5/15.0
- Rent growth +2.5/5.0
- Livability +2.5/5.0
- Condition / age +2.5/5.0
- Schools +0.2/10.0
- Appreciation +0.0/10.0
$59,900
🖨 Deal sheet 📄 Offer letter ✓ Due diligence
Listing remarks
2001 CLAYTON SPIRIT III 14 x 64 SER#CLW016655TX Lot Rent of $180.00 includes water, sewage and trash. Park aproval required before purchase. Split bedroom plan, washer/dryer, water filtration system, Slab patio, carport and shed. Located in Pearce which is host to a Post Office, Library, Dollar General and restaurants.
Key facts
- Shed
- Washer dryer
- Slab patio
Tags
Property features AI
Exterior
- Parking: Detached covered carport (1 covered space, 1 carport space)
- Security: Smoke detector(s)
- Utilities: Sewer connected
- Home design: Manufactured home (Clayton Spirit III); One story
- Construction: Metal and membrane roof
- Exterior features: Slab patio/porch; Shrubs; Previously developed lot; Gravel road access (owner maintenance); Rented lot space
Interior
- Kitchen: Refrigerator; Electric range; Electric oven; Microwave
- Bedrooms: One-level home
- Flooring: Carpet; Laminate
- Bathrooms: 2 full bathrooms
- Heating & cooling: Forced air heating; Central air conditioning; Ceiling fans
- Interior features: Satellite dish; Smoke detector(s)
- Laundry & utility: Washer; Dryer
Neighborhood map
What this means for you Summary
Snapshot
- This is a 3-bed/2.0-bath manufactured listed at $60k.
Deal economics
- At list price, monthly cash flow is $480 ($6k/yr) — positive.
- The deal already cash-flows at list — no discount required.
- Meets the 1% rule at list price ($1k rent vs $60k).
- Recommended offer: $53k (12.0% below list) — sets the bar for market timing.
- Cap rate 15.9% vs local median 4.3% in Sunsites — top-decile yield for the area; either an underpriced asset or a hidden risk that comps aren't pricing in. Stress-test before assuming the spread holds.
Location & tenants
- Location reads: area grade B — affects rentability + tenant quality, not the cash-flow math above.
- Valley Union High School District (4190) (rural): math -3% / reading -3% proficiency, ranked #498 of 501 in AZ (top 99%) — low school quality limits family demand, transient renter base, plan for 1-2y turnover.
- Zoned schools: Valley Union High School (math 5% / reading 5%, grade F, #364 of 381 statewide, top 100%, 106 students, 49% FRL).
- Market conditions: 198 active listings in the ZIP; 437 units permitted in Cochise County in 2024 (6 in 5+ unit buildings).
Forward outlook
- Local home prices are declining (-3.0%/yr); year-one equity from $414 of loan paydown is wiped out by about $2k of value loss. Plan a longer hold.
- Cochise County population projected at -30% by 2050 — secular population decline; favor cash flow + early exit over multi-decade hold.
- At projected returns (-3.0% appreciation + 3.0% rent growth), your $17k cash investment doubles in ~4 years — after that, you're playing with house money.
Negotiation context
- It's been on market 124 days — a 12% lower offer ($53k) is reasonable based on typical stale-listing flexibility.
- 4 sale attempts with the ask held roughly flat each time — persistent listings suggest the price (not the market) is what's stuck; bring a comps-based counter.
Risks & watch-outs
- Climate carrying-cost: major wildfire risk; extreme-heat days projected 7→19/yr by 2055 (HVAC capex compounding) — expect insurance premiums to compound above CPI over the hold.
Questions for the listing agent
- It's been on market 124 days. Have you received any prior offers? Is the seller open to a 12% concession, seller financing, or rate buy-down credit?
- Why hasn't it sold? Are there any deal-killer items the seller is aware of (foundation, flood, title, zoning, code violations)?
- Is there a deadline driving the sale (1031 exchange, divorce, estate, relocation)? That informs how much negotiation room exists.
- What's the average days-on-market for RENTAL listings here right now (not sales)? A rising rental-DOM trend means longer vacancies and softer asking-rent achievability than the comps imply.
- What's the recent tenant-quality profile in this submarket — average credit score on applications, eviction rate, late-payment / NSF rate, and stable-employment percentage? A property-management company in the area should have these aggregated.
- How much new for-sale + rental construction is in the pipeline within 1–3 miles? Heavy new supply typically softens prices + rents 12–24 months out; constrained supply supports both.
Investment metrics
- 1% rule
- 1.89% ✓
- Cap rate
- 15.91%
- Cash-on-cash
- 34.36%
- DSCR
- 2.53
- GRM
- 4.4
CMA / ARV
No comps found within radius.
Projected returns pro-forma
-3.0% appreciation · 3.0% rent growth · sell at horizon
- IRR
- 29.8%
- Equity multiple
- 2.25×
- Total profit
- $20,901
- Equity at exit
- $8,931
- IRR
- 37.1%
- Equity multiple
- 4.44×
- Total profit
- $57,660
- Equity at exit
- $5,179
Cash invested: $16,772 (down + closing). Projections, not guarantees.
Landlord ↔ Tenant lean methodology
- Overall (STATE)
- 87 Strongly Landlord-Friendly
- State Arizona
- 87 Strongly Landlord-Friendly · R+3
- County
- — inherits STATE
- City
- — inherits STATE
ZIP-level market 85625
- Home prices YoY
- -16.5%
- Active inventory
- 198
- Price-to-rent
- 4.4×
Monthly cashflow live
- Estimated rent
- $1,132 medium interval (Pro) →
- Mortgage (P&I)
- −$314
- Tax est. 1.5%
- −$75 /mo · $898/yr
- Insurance
- −$25
- HOA
- −$0
- Vacancy / Maint / Mgmt
- −$238
- Net cashflow
- $480
Break-even live
UW: 25.0% down · 7.5% · 30yr · 1.5% tax · 5.0% vac · 8.0% maint · 8.0% mgmt
Financing live
Cash to close
- Down payment
- $14,975
- Closing costs
- $1,797
- Reserves months
- —
- Total cash needed
- —
Loan-product check · same deal, 3 products live
Conventional
25% down · 7.5% · 30yr
- Down + closing
- —
- Monthly P&I
- —
- Monthly cashflow
- —
- DSCR
- —
- Eligible?
- —
Personal DTI + credit; lowest rate.
DSCR
20% down · 8.5% · 30yr
- Down + closing
- —
- Monthly P&I
- —
- Monthly cashflow
- —
- DSCR
- —
- Eligible?
- —
No personal income docs; deal must DSCR.
Hard money
10% down · 12.0% · 12mo
- Down + closing
- —
- Monthly P&I
- —
- Monthly cashflow
- —
- DSCR
- —
- Eligible?
- —
Short-term bridge; refi at stabilization.
Listing history 28 events
-
2026-06-19days on market $59,900 Active 124 DOM
-
2026-06-18days on market $59,900 Active 123 DOM
-
2026-06-17days on market $59,900 Active 122 DOM
-
2026-06-16days on market $59,900 Active 121 DOM
-
2026-06-15days on market $59,900 Active 120 DOM
-
2026-06-14days on market $59,900 Active 118 DOM
-
2026-06-12days on market $59,900 Active 117 DOM
-
2026-06-09days on market $59,900 Active 114 DOM
-
2026-06-08days on market $59,900 Active 113 DOM
-
2026-06-07days on market $59,900 Active 112 DOM
-
2026-06-05days on market $59,900 Active 110 DOM
-
2026-06-04days on market $59,900 Active 108 DOM
-
2026-06-02days on market $59,900 Active 107 DOM
-
2026-06-01days on market $59,900 Active 106 DOM
-
2026-05-31days on market $59,900 Active 105 DOM
-
2026-05-31days on market $59,900 Active 104 DOM
-
2026-02-16$59,900 Active
-
2026-01-14$59,900 Active
-
2026-01-14historical
-
2025-12-22historical
-
2025-12-22historical
-
2025-09-19price $52,500
-
2025-08-13price $55,000
-
2025-08-12price $55,000
-
2025-05-07price $57,500
-
2025-05-06price $57,500
-
2025-02-10$70,000 Active
-
2025-02-10$70,000 Active
ⓘ Source: listings_history table (triggers on properties + properties_extension) + one-shot
backfill from property_details.listing_events for pre-trigger history.
Climate risk First Street
- Flood 1/10 Low FEMA zone X (unshaded) · 0% chance over 30 yrs
- Wildfire 7/10 Severe
- Heat 6/10 Major 7 d/yr ≥99°F today · 19 d/yr by 30 yrs out
- Wind 1/10 Low
- Air quality 1/10 Low 0 unhealthy d/yr today · 0 by 30 yrs out
Nearby sold comps map
Loading sold comps map…
Walkable amenities ~0.75 mi
Loading nearby amenities…
Taxation est. · year 1
- Rental income
- $13,584
- − Mortgage interest
- −$3,355
- − Property taxes
- −$898
- − Insurance
- −$300
- − Repairs & maintenance
- −$1,087
- − Management
- −$1,087
- − Depreciation
- −$1,743
- Taxable income
- $5,114
- Est. tax owed @ 24.0%
- −$1,227
- After-tax cash flow
- $4,536/yr
For passive investors: Depreciation is non-cash, so a rental often shows a tax loss while cash-flowing — sheltering income. Rental losses are passive: they offset passive income freely, and up to $25,000/yr can offset ordinary (W-2) income if you actively participate and your MAGI is under $100k (phasing out to $0 by $150k); unused losses carry forward. On sale, claimed depreciation is recaptured at up to 25%, and gains may owe capital-gains tax (a 1031 exchange can defer both). Figures are a year-1 estimate at your 24.0% rate — not tax advice; consult a CPA.
Schools (NCES district)
- District
- Valley Union High School District (4190)
- NCES district ID
- 0408910
- Math proficiency
- -3% ▬ 0.00%
- Reading proficiency
- -3% ▬ 0.00%
- Median HH income
- $41,046
- Composite
- 2.17/100
- National rank
- #15168
- State rank
- #498 of 501 in AZ
Livability — Sunsites
No livability data for this city. (Only ~50 U.S. cities are tracked.)
Census & demographics
- Population (ZIP)
- 1,959
Population outlook (Cochise County) Hauer SSP2
- Today (2025)
- 113,402 people
- By 2030
- 106,197 · -6.4%
- By 2040
- 92,166 · -18.7%
- By 2050
- 79,805 · -29.6%
- By 2075
- 56,831 · -49.9%
- By 2100
- 35,103 · -69.0%
Race, ethnicity, and origin ACS 2023
- Neighborhood character
- Predominantly White (89%)
- Race & ethnicity
- White 89% Hispanic / Latino 10% Two or more races 8%
- Hispanic origin (detail)
- Mexican 10%
- Common ancestry
- Lithuanian 5% Iranian 2% Portuguese 2%
- Foreign-born
- 4% · Canada
- Languages at home
- 87% English-only · Spanish 10% German/W. Germanic 3%
Political lean MEDSL · Cochise
- 2024 margin
- Strong R (+23.1) · D 37.8% · R 61.0% · Other 1.2%
- 2008→2024 swing
- -2.5pp toward R · 2008: -20.7pp · 2024: -23.1pp
- All cycles
- 2024: R+23.1 2020: R+19.6 2016: R+22.6 2012: R+24.0 2008: R+20.7
Not yet ingested
- Civics
- —
Market trends
- HPI YoY
- ▼ -30.79%
- Current HPI
- 156.1483
- Rent YoY
- —
- Metro
- —
- State GDP YoY
- ▲ 4.54%
- F500 in state
- 20
Industry mix (Fortune 500 HQ in AZ)
| Industry | F500 HQs | Revenue |
|---|---|---|
| Technology | 2 | $13B |
|
||
| Mining / Metals | 1 | $23B |
|
||
| Environmental Services | 1 | $16B |
|
||
| Metals / Steel | 1 | $14B |
|
||
| Technology Distribution | 1 | $9B |
|
||
| Homebuilding | 1 | $8B |
|
||
Price history
-14.4% since first listed12 events — show timeline
- 2026-02-16 Listed $59,900 MLSSAZ
- 2026-01-14 Listing Removed — MLSSAZ
- 2026-01-14 Listed $59,900 MLSSAZ
- 2025-12-22 Listing Removed — ARMLS
- 2025-12-22 Listing Removed — MLSSAZ
- 2025-09-19 Price Changed $52,500 MLSSAZ
- 2025-08-13 Price Changed $55,000 MLSSAZ
- 2025-08-12 Price Changed $55,000 ARMLS
- 2025-05-07 Price Changed $57,500 MLSSAZ
- 2025-05-06 Price Changed $57,500 ARMLS
- 2025-02-10 Listed $70,000 ARMLS
- 2025-02-10 Listed $70,000 MLSSAZ
Cash-flow waterfall
monthlySold comps — $/sqft
last 12 mo · ≤1 miLoading sold comps…