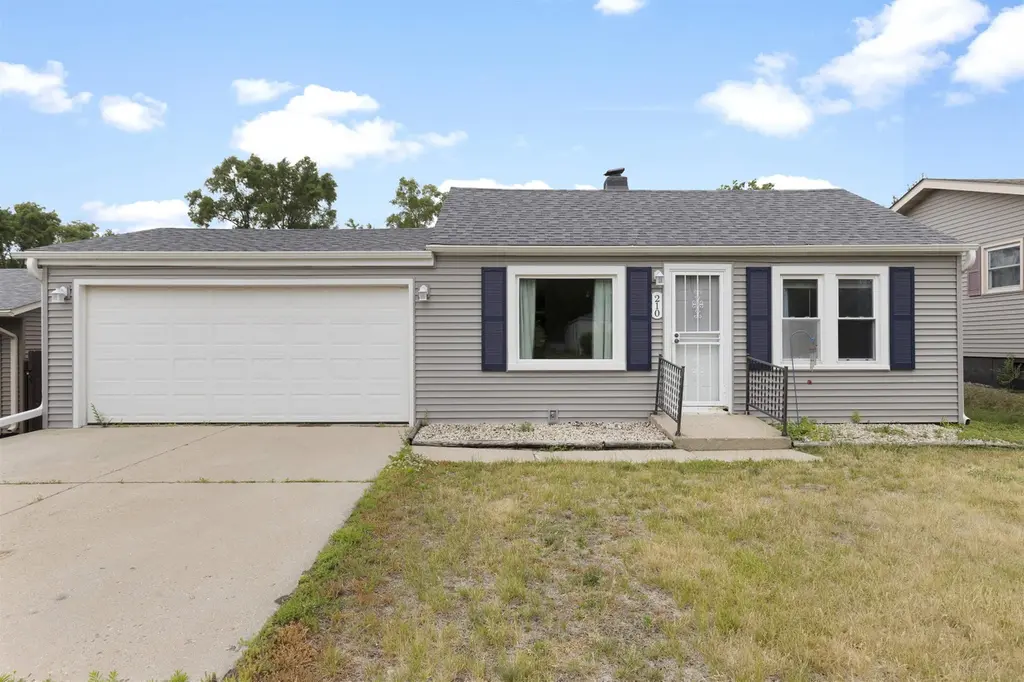
210 Wilson Ave · Machesney Park, IL
Flood risk 1/10 · Minimal
- FEMA flood zone
- X (unshaded)
- Chance of flooding over 30 yrs
- 0.0%
- Est. flood insurance / yr
- $473 – $860
Fire risk 1/10 · Minimal
- Est. fire insurance / yr
- $804 – $1,492
Heat risk 2/10 · Minimal
- Hot days now (above 101°F)
- 7 days/yr
- Hot days in 30 yrs
- 15 days/yr
Wind risk 2/10 · Minimal
- Chance of severe wind over 30 yrs
- —
Air-quality risk 2/10 · Minimal
- Unhealthy air days now
- 1 days/yr
- Unhealthy air days in 30 yrs
- 2 days/yr
Risk factors via First Street. Map © Google.
Why this score? — see what drove the B- grade
The composite is a weighted blend of 9 inputs, each scored 0–100. Each bar is that input's sub-score; the figure is the points it added to the 100-point composite (weight × sub-score).
- Cash flow +27.5/30.0
- ARV discount +15.0/15.0
- DSCR +9.7/10.0
- 1% rule +6.6/10.0
- Livability +3.7/5.0
- Rent growth +2.5/5.0
- Condition / age +2.5/5.0
- Schools +1.8/10.0
- Appreciation +0.0/10.0
$140,000
🖨 Deal sheet 📄 Offer letter ✓ Due diligence
Listing remarks
Charming home in Machesney Park. Two bedrooms with an updated bathroom. Living room and spacious family room offer plenty of natural light. A bonus finished area in the basement provides additional room for home office, recreation area or hobby space. Large fenced in yard. Major updates include new roof, siding, and gutters 2022. Needing TLC bring your decorating ideas and make this home your own!
Key facts
- Bonus finished area
- New siding
- New gutters
Tags
Property features AI
Finance
- Other: Annual tax information available
Exterior
- Parking: Attached 2-car garage
- Utilities: Public water; Public sewer
- Home design: Single Family Residence (house); Residential property
- Construction: Below-grade finished area (350)
- Exterior features: Shingle roof; Lot about 0.2 acres
Interior
- Kitchen: Gas cooktop; Microwave; Refrigerator
- Bathrooms: 1 full bathroom (main level)
- Heating & cooling: Forced air heating; Central air conditioning
- Interior features: Gas cooktop; Microwave; Refrigerator; Gas water heater; Partial basement
Neighborhood map
What this means for you Summary
Snapshot
- This is a 2-bed/1.0-bath single-family listed at $140k.
Deal economics
- At list price, monthly cash flow is $415 ($5k/yr) — positive.
- The deal already cash-flows at list — no discount required.
- Meets the 1% rule at list price ($2k rent vs $140k).
- Cap rate 9.8% vs local median 4.9% in Machesney Park — top-decile yield for the area; either an underpriced asset or a hidden risk that comps aren't pricing in. Stress-test before assuming the spread holds.
Location & tenants
- Location reads 74/100 on livability (#244 in IL, #4,425 nationally) — a middle-class / working-renter tenant base. Strengths: cost of living A+, housing A+, health & safety A+; Watch: amenities D+, commute F.
- Harlem UD 122 (suburban): math 17% / reading 23% proficiency, ranked #418 of 620 in IL (top 67%) — low school quality limits family demand, transient renter base, plan for 1-2y turnover.
- Zoned schools: Marquette Elem School (math 22% / reading 17%, grade F, #1,054 of 2,056 statewide, top 54%, 289 students, 0% FRL); Harlem High School (math 18% / reading 23%, grade F, #350 of 693 statewide, top 51%, 1,875 students, 0% FRL) — zoned schools average 0% FRL vs 45% district-wide (45 pts lower); this property's tenant base skews higher-income than the district average.
- Market conditions: 94 active listings in the ZIP; 3 comparable units currently listed for rent nearby; rentals leasing fast (median 13d on market — plan ~1-2 weeks tenant-placement turnaround); 285 units permitted in Winnebago County in 2024 (0 in 5+ unit buildings).
Forward outlook
- Local home prices are declining (-3.0%/yr); year-one equity from $968 of loan paydown is wiped out by about $4k of value loss. Plan a longer hold.
- Winnebago County population projected at -20% by 2050 — secular population decline; favor cash flow + early exit over multi-decade hold.
- At projected returns (-3.0% appreciation + 3.0% rent growth), your $39k cash investment doubles in ~9 years — after that, you're playing with house money.
Negotiation context
- Only 3 days on market — expect competitive offers; lowballing is unlikely to land.
- Current owner paid $62k; list at $140k implies a 124% gain — meaningful room to come down on a strong offer.
Risks & watch-outs
- Watch-outs: built in 1950 — expect roof / HVAC / electrical / plumbing capex.
Questions for the listing agent
- Built in 1950 — when were the roof, HVAC, electrical panel, plumbing, and water heater last replaced?
- Is there a deadline driving the sale (1031 exchange, divorce, estate, relocation)? That informs how much negotiation room exists.
- Schools are F-rated, which usually means shorter tenancies and higher turnover. Who's the typical renter profile here, and what's been the actual vacancy rate?
- What's the average days-on-market for RENTAL listings here right now (not sales)? A rising rental-DOM trend means longer vacancies and softer asking-rent achievability than the comps imply.
- What's the recent tenant-quality profile in this submarket — average credit score on applications, eviction rate, late-payment / NSF rate, and stable-employment percentage? A property-management company in the area should have these aggregated.
- How much new for-sale + rental construction is in the pipeline within 1–3 miles? Heavy new supply typically softens prices + rents 12–24 months out; constrained supply supports both.
Investment metrics
- 1% rule
- 1.16% ✓
- Cap rate
- 9.85%
- Cash-on-cash
- 12.70%
- DSCR
- 1.57
- GRM
- 7.2
CMA / ARV
- ARV (on-the-fly)
- $201,852
- Comps found
- 12
Show comp detail 12 sales within ~0.75 mi
| Address | Dist | Beds/Ba | Sqft | Sold | Price | $/sf | Match |
|---|---|---|---|---|---|---|---|
| 308 Gilbert Ter | 0.15mi | 3/1.0 (+1) | 1,149 (-8%) | 1mo | $135,000 | $117 | 74 |
| 506 Marquette Rd | 0.42mi | 3/2.0 (+1) | 1,204 (-3%) | 1mo | $197,500 | $164 | 65 |
| 555 Marquette Rd | 0.48mi | 2/1.0 | 1,200 (-4%) | 11mo | $156,000 | $130 | 62 |
| 7643 Rogers St | 0.68mi | 3/1.0 (+1) | 1,281 (+3%) | 2mo | $195,815 | $153 | 57 |
| 5165 Browns Beach Rd | 0.55mi | 2/2.5 | 1,340 (+8%) | 2mo | $261,000 | $195 | 54 |
| 8038 Ravere St | 0.55mi | 2/2.0 | 1,312 (+5%) | 10mo | $175,000 | $133 | 53 |
| 9931 Shore Dr | 0.47mi | 3/1.5 (+1) | 1,352 (+8%) | 5mo | $239,900 | $177 | 53 |
| 9511 Shore Dr | 0.59mi | 3/2.0 (+1) | 1,328 (+7%) | 3mo | $215,000 | $162 | 50 |
| 8334 Shore Dr | 0.48mi | 2/2.0 | 1,422 (+14%) | 7mo | $249,900 | $176 | 44 |
| 7637 Rogers St | 0.69mi | 3/2.5 (+1) | 1,143 (-8%) | 2mo | $205,000 | $179 | 41 |
| 428 Pershing Ave | 0.42mi | 3/2.0 (+1) | 1,426 (+14%) | 8mo | $150,000 | $105 | 40 |
| 8217 Ravere St | 0.57mi | 2/2.0 | 1,426 (+14%) | 6mo | $185,000 | $130 | 40 |
Match score weights: distance 35% · size 25% · config 20% · recency 20%. Top-matched comps best support the ARV.
Projected returns pro-forma
-3.0% appreciation · 3.0% rent growth · sell at horizon
- IRR
- 2.5%
- Equity multiple
- 1.09×
- Total profit
- $3,702
- Equity at exit
- $20,874
- IRR
- 12.0%
- Equity multiple
- 1.95×
- Total profit
- $37,109
- Equity at exit
- $12,105
Cash invested: $39,200 (down + closing). Projections, not guarantees.
Landlord ↔ Tenant lean methodology
- Overall (STATE)
- 43 Moderately Tenant-Leaning
- State Illinois
- 43 Moderately Tenant-Leaning · D+7
- County
- — inherits STATE
- City
- — inherits STATE
ZIP-level market 61115
- Home prices YoY
- -34.6%
- Active inventory
- 94
- Price-to-rent
- 7.2×
Monthly cashflow live
- Estimated rent
- $1,630 medium interval (Pro) →
- Mortgage (P&I)
- −$734
- Tax from tax record
- −$80 /mo · $964/yr
- Insurance
- −$58
- HOA
- −$0
- Vacancy / Maint / Mgmt
- −$342
- Net cashflow
- $415
Break-even live
UW: 25.0% down · 7.5% · 30yr · 1.5% tax · 5.0% vac · 8.0% maint · 8.0% mgmt
Financing live
Cash to close
- Down payment
- $35,000
- Closing costs
- $4,200
- Reserves months
- —
- Total cash needed
- —
Loan-product check · same deal, 3 products live
Conventional
25% down · 7.5% · 30yr
- Down + closing
- —
- Monthly P&I
- —
- Monthly cashflow
- —
- DSCR
- —
- Eligible?
- —
Personal DTI + credit; lowest rate.
DSCR
20% down · 8.5% · 30yr
- Down + closing
- —
- Monthly P&I
- —
- Monthly cashflow
- —
- DSCR
- —
- Eligible?
- —
No personal income docs; deal must DSCR.
Hard money
10% down · 12.0% · 12mo
- Down + closing
- —
- Monthly P&I
- —
- Monthly cashflow
- —
- DSCR
- —
- Eligible?
- —
Short-term bridge; refi at stabilization.
Rent comps 3 comps
| Address | Beds | Baths | Sqft | Rent | $/sqft | DOM | Units | Dist |
|---|---|---|---|---|---|---|---|---|
| 7705 Randy Rd Machesney Park, IL | 3.0 | 1.0 | 760 | $1,250 | $1.64 | 13d | 1 | 1.02mi |
| 1028 Minns Dr Unit 1028-D Machesney Park, IL | 3.0 | 2.0 | 1228 | $1,850 | $1.51 | 20d | 1 | 1.26mi |
| 1051 Minns Dr Unit 1051-3 Machesney Park, IL | 2.0 | 2.0 | 1208 | $1,700 | $1.41 | 13d | 1 | 1.26mi |
Listing history 5 events
-
2026-06-13status $140,000 Pending 3 DOM
-
2026-06-10days on market $140,000 Active 3 DOM
-
2026-06-09days on market $140,000 Active 2 DOM
-
2026-06-08remarks 400-char remark
-
2026-06-08$140,000 Active 1 DOM
ⓘ Source: listings_history table (triggers on properties + properties_extension) + one-shot
backfill from property_details.listing_events for pre-trigger history.
Tax reassessment forecast IL · Partial reset (capped growth)
- Current annual tax
- $964 · $80/mo
- Projected year-2 tax
- $2,071 · $173/mo
- Expected delta
- +$1,107/yr (+$92/mo · 114.8%)
ⓘ Screening estimate from a state-policy table — verify with the county assessor before closing.
Climate risk First Street
- Flood 1/10 Low FEMA zone X (unshaded) · 0% chance over 30 yrs
- Wildfire 1/10 Low
- Heat 2/10 Low 7 d/yr ≥101°F today · 15 d/yr by 30 yrs out
- Wind 2/10 Low
- Air quality 2/10 Low 1 unhealthy d/yr today · 2 by 30 yrs out
Nearby sold comps map
Loading sold comps map…
Walkable amenities ~0.75 mi
Loading nearby amenities…
Taxation est. · year 1
- Rental income
- $19,560
- − Mortgage interest
- −$7,842
- − Property taxes
- −$964
- − Insurance
- −$700
- − Repairs & maintenance
- −$1,565
- − Management
- −$1,565
- − Depreciation
- −$4,073
- Taxable income
- $2,851
- Est. tax owed @ 24.0%
- −$684
- After-tax cash flow
- $4,294/yr
For passive investors: Depreciation is non-cash, so a rental often shows a tax loss while cash-flowing — sheltering income. Rental losses are passive: they offset passive income freely, and up to $25,000/yr can offset ordinary (W-2) income if you actively participate and your MAGI is under $100k (phasing out to $0 by $150k); unused losses carry forward. On sale, claimed depreciation is recaptured at up to 25%, and gains may owe capital-gains tax (a 1031 exchange can defer both). Figures are a year-1 estimate at your 24.0% rate — not tax advice; consult a CPA.
Schools (NCES district)
- District
- Harlem UD 122
- NCES district ID
- 1718240
- Math proficiency
- 17% ▼ -8.00%
- Reading proficiency
- 23% ▼ -7.00%
- Median HH income
- $51,228
- Composite
- 18.01/100
- National rank
- #8982
- State rank
- #418 of 620 in IL
Livability — Machesney Park
- Score
- 74/100
- State rank
- #244
- US rank
- #4425
Category grades
Schools grade is shown separately in the Schools card above.
Census & demographics
- Census place
- Machesney Park, IL
- City population
- 22,424
- Population (ZIP)
- 22,424
Population outlook (Winnebago County) Hauer SSP2
- Today (2025)
- 271,080 people
- By 2030
- 260,684 · -3.8%
- By 2040
- 238,405 · -12.1%
- By 2050
- 216,129 · -20.3%
- By 2075
- 172,882 · -36.2%
- By 2100
- 135,336 · -50.1%
Race, ethnicity, and origin ACS 2023
- Neighborhood character
- Predominantly White (80%)
- Race & ethnicity
- White 80% Hispanic / Latino 11% Two or more races 7% Black 2% Asian 2%
- Hispanic origin (detail)
- Mexican 8% Puerto Rican 1%
- Common ancestry
- Romanian 2% Italian 2% Portuguese 2%
- Foreign-born
- 5% · Canada
- Languages at home
- 93% English-only · Spanish 4% Other Indo-European 1% Russian/Polish/Slavic 1%
Political lean MEDSL · Winnebago
- 2024 margin
- Toss-up / Even · D 49.5% · R 49.0% · Other 1.5%
- 2008→2024 swing
- -12.2pp toward R · 2008: 12.8pp · 2024: 0.6pp
- All cycles
- 2024: D+0.6 2020: D+2.5 2016: R+1.2 2012: D+5.7 2008: D+12.8
Not yet ingested
- Civics
- —
Market trends
- HPI YoY
- ▼ -144.28%
- Current HPI
- 272.5522
- Rent YoY
- —
- Metro
- —
- State GDP YoY
- ▲ 1.59%
- F500 in state
- 60
Industry mix (Fortune 500 HQ in IL)
| Industry | F500 HQs | Revenue |
|---|---|---|
| Insurance | 4 | $201B |
|
||
| Consumer Goods | 4 | $87B |
|
||
| Industrial Machinery | 3 | $64B |
|
||
| Healthcare | 2 | $55B |
|
||
| Retail / Pharmacy | 1 | $148B |
|
||
| Agriculture / Food | 1 | $86B |
|
||
Price history
+211.1% since first listed5 events — show timeline
- 2026-06-08 Listed $140,000 NWIAR
- 2012-10-09 Sold (Public Records) $62,500 Public Records
- 2003-07-17 Sold (Public Records) $72,000 Public Records
- 1989-10-30 Sold (Public Records) $45,000 Public Records
- 1989-10-30 Sold (Public Records) $45,000 Public Records
Property tax history
-3.3%/yrLatest (2025): $964 · -54.9% YoY. Source: county tax records.
Cash-flow waterfall
monthlySold comps — $/sqft
last 12 mo · ≤1 miLoading sold comps…