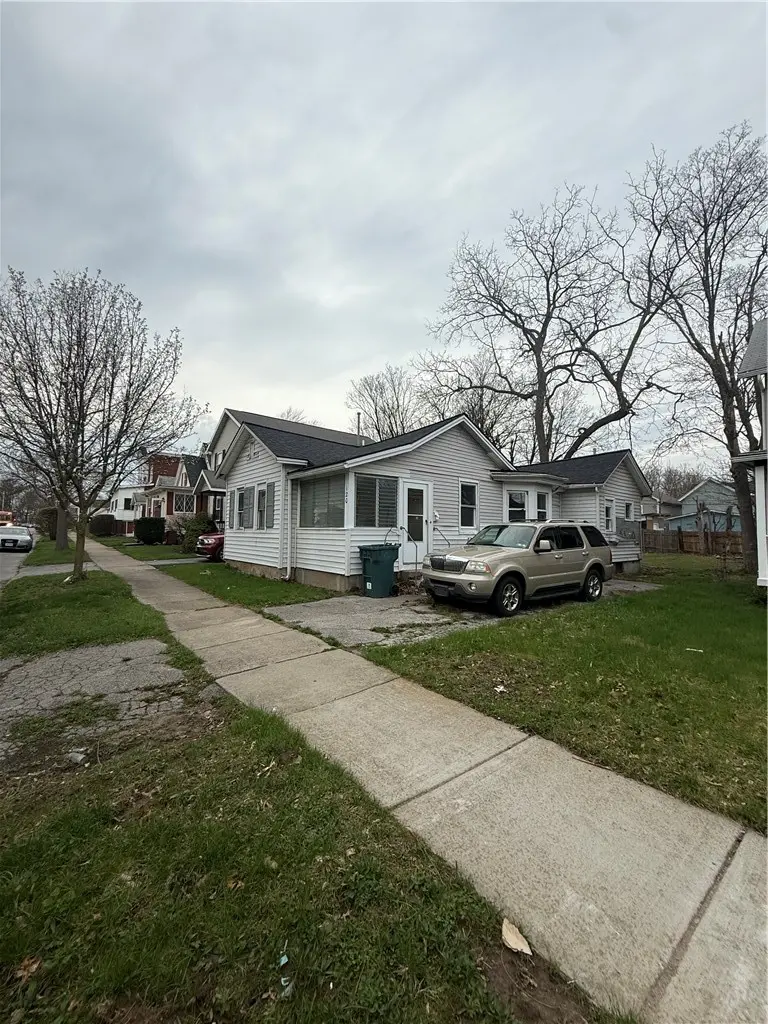
120 Cady St · Rochester, NY
Flood risk 1/10 · Minimal
- FEMA flood zone
- X (unshaded)
- Chance of flooding over 30 yrs
- 0.0%
- Est. flood insurance / yr
- $473 – $860
Fire risk 1/10 · Minimal
- Est. fire insurance / yr
- $691 – $1,283
Heat risk 2/10 · Minimal
- Hot days now (above 96°F)
- 7 days/yr
- Hot days in 30 yrs
- 15 days/yr
Wind risk 1/10 · Minimal
- Chance of severe wind over 30 yrs
- —
Air-quality risk 2/10 · Minimal
- Unhealthy air days now
- 1 days/yr
- Unhealthy air days in 30 yrs
- 1 days/yr
Risk factors via First Street. Map © Google.
Why this score? — see what drove the A- grade
The composite is a weighted blend of 9 inputs, each scored 0–100. Each bar is that input's sub-score; the figure is the points it added to the 100-point composite (weight × sub-score).
- Cash flow +30.0/30.0
- ARV discount +15.0/15.0
- 1% rule +10.0/10.0
- DSCR +10.0/10.0
- Appreciation +6.8/10.0
- Rent growth +4.2/5.0
- Livability +3.8/5.0
- Condition / age +2.5/5.0
- Schools +1.9/10.0
$65,600
🖨 Deal sheet (PDF) 📄 Offer letter ✓ Due diligence
Listing remarks MLS
Single family 2B/1Bath ranch-style home. New roof within the past 2 years (total tear-off). Vinyl sided (needs repair), with vinyl windows. Driveway included. Needs interior remodeled. This property is being offered strictly "as-is" The Seller will not provide a Certificate of Occupancy, nor will they perform any repairs or offer credits towards repairs or closing costs. This is an opportunity for an investor or savvy buyer looking for a project property. Buyers are encouraged to perform their own due diligence, but note that the seller is firm on the "as-is" conditions.
Key facts
- 4,691 sq ft lot
- Built 1900
- Listed 60 days
Neighborhood map
What this means for you Summary
Snapshot
- This is a 2-bed/1.0-bath single-family listed at $66k.
Deal economics
- At list price, monthly cash flow is $777 ($9k/yr) — positive.
- The deal already cash-flows at list — no discount required.
- Meets the 1% rule at list price ($2k rent vs $66k).
- Recommended offer: $64k (3.0% below list) — sets the bar for market timing.
- Cap rate 20.5% vs local median 9.3% in Rochester — top-decile yield for the area; either an underpriced asset or a hidden risk that comps aren't pricing in. Stress-test before assuming the spread holds.
Location & tenants
- Location reads 76/100 on livability (#222 in NY, #3,482 nationally) — a middle-class / working-renter tenant base. Strengths: commute A+, cost of living A+, housing A+; Watch: schools D+, crime F, employment F.
- Rochester City School District (urban): math 21% / reading 26% proficiency, ranked #589 of 590 in NY (top 100%) — low school quality limits family demand, transient renter base, plan for 1-2y turnover; 82% free/reduced lunch — lower-income household profile, screen leases tightly.
- Market conditions: Rents rising fast (+6.6%/yr); 51 active listings in the ZIP; 40 comparable units currently listed for rent nearby; rentals at typical pace (median 23d on market — plan ~3-4 weeks tenant-placement turnaround); lower-income renter base — watch delinquency; 1,169 units permitted in Monroe County in 2024 (591 in 5+ unit buildings).
- This rent runs 45% of the median local income ($41k/yr) — at the standard rent-burdened threshold; future hikes will face affordability resistance.
Forward outlook
- In year one you build about $3k of equity ($454 loan paydown + $2k appreciation (3.7% local appreciation)).
- Monroe County population projected to shrink 6% by 2050 — rents likely to lag national; underwrite the cash flow, not the appreciation.
- At projected returns (3.7% appreciation + 6.6% rent growth), your $18k cash investment doubles in ~2 years — after that, you're playing with house money.
Negotiation context
- It's been on market 60 days — a 3% lower offer ($64k) is reasonable based on typical stale-listing flexibility.
- 4 sale attempts since 15y ago with the ask held roughly flat each time — persistent listings suggest the price (not the market) is what's stuck; bring a comps-based counter.
- Current owner paid $16k; list at $66k implies a 323% gain — meaningful room to come down on a strong offer.
Risks & watch-outs
- Watch-outs: built in 1900 — expect roof / HVAC / electrical / plumbing capex.
Questions for the listing agent
- It's been on market 60 days. Have you received any prior offers? Is the seller open to a 3% concession, seller financing, or rate buy-down credit?
- Built in 1900 — when were the roof, HVAC, electrical panel, plumbing, and water heater last replaced?
- Is there a deadline driving the sale (1031 exchange, divorce, estate, relocation)? That informs how much negotiation room exists.
- Schools are D-rated, which usually means shorter tenancies and higher turnover. Who's the typical renter profile here, and what's been the actual vacancy rate?
- Crime grade is F in this area — have there been break-ins, vandalism, or insurance claims at this property in the last 3 years? What carrier currently insures it and at what premium?
- What's the average days-on-market for RENTAL listings here right now (not sales)? A rising rental-DOM trend means longer vacancies and softer asking-rent achievability than the comps imply.
- What's the recent tenant-quality profile in this submarket — average credit score on applications, eviction rate, late-payment / NSF rate, and stable-employment percentage? A property-management company in the area should have these aggregated.
- How much new for-sale + rental construction is in the pipeline within 1–3 miles? Heavy new supply typically softens prices + rents 12–24 months out; constrained supply supports both.
Investment metrics
- 1% rule
- 2.31% ✓
- Cap rate
- 20.50%
- Cash-on-cash
- 50.75%
- DSCR
- 3.26
- GRM
- 3.6
CMA / ARV
- ARV (median comp)
- $79,434
- List price
- $65,600
- Delta
- -17.42%
- Verdict
- UNDERPRICED
- Comps
- 20 within 1.0 mi
Show comp detail 12 sales within ~0.75 mi
| Address | Dist | Beds/Ba | Sqft | Sold | Price | $/sf | Match |
|---|---|---|---|---|---|---|---|
| 358 Champlain St | 0.14mi | 3/1.0 (+1) | 961 (-2%) | 8mo | $85,000 | $88 | 78 |
| 130 Cady St | 0.03mi | 2/1.0 | 875 (-11%) | 11mo | $60,000 | $69 | 72 |
| 149 Champlain St | 0.21mi | 2/1.0 | 1,100 (+12%) | 5mo | $78,000 | $71 | 66 |
| 68 Cady St | 0.15mi | 3/1.0 (+1) | 1,078 (+10%) | 8mo | $95,000 | $88 | 64 |
| 11 Danforth St | 0.65mi | 2/1.0 | 962 (-2%) | 4mo | $80,000 | $83 | 63 |
| 259 Seward St | 0.40mi | 3/1.0 (+1) | 1,015 (+4%) | 10mo | $113,000 | $111 | 62 |
| 853 Exchange St | 0.58mi | 2/1.0 | 932 (-5%) | 4mo | $115,000 | $123 | 62 |
| 52 Judson St | 0.49mi | 3/1.0 (+1) | 926 (-6%) | 9mo | $107,000 | $116 | 56 |
| 18 Superior Ter | 0.45mi | 3/1.0 (+1) | 910 (-7%) | 10mo | $44,000 | $48 | 54 |
| 284 Magnolia St | 0.56mi | 3/1.0 (+1) | 928 (-5%) | 15mo | $70,000 | $75 | 48 |
| 29 Dengler St | 0.62mi | 3/1.0 (+1) | 1,078 (+10%) | 4mo | $95,000 | $88 | 46 |
| 12 Terry St | 0.57mi | 2/1.0 | 840 (-14%) | 20mo | $74,800 | $89 | 33 |
Match score weights: distance 35% · size 25% · config 20% · recency 20%. Top-matched comps best support the ARV.
Projected returns pro-forma
3.69% appreciation · 6.61% rent growth · sell at horizon
- IRR
- 59.9%
- Equity multiple
- 4.57×
- Total profit
- $65,527
- Equity at exit
- $32,082
- IRR
- 60.3%
- Equity multiple
- 10.31×
- Total profit
- $170,920
- Equity at exit
- $51,554
Cash invested: $18,368 (down + closing). Projections, not guarantees.
Landlord ↔ Tenant lean methodology
- Overall (STATE)
- 15 Strongly Tenant-Friendly
- State New York
- 15 Strongly Tenant-Friendly · D+10
- County
- — inherits STATE
- City
- — inherits STATE
ZIP-level market 14608
- Home prices YoY
- 1.3%
- Rents YoY
- 6.6%
- Active inventory
- 51
- Price-to-rent
- 3.6×
Monthly cashflow live
- Estimated rent
- $1,518 high interval (Pro) →
- Mortgage (P&I)
- −$344
- Tax from tax record
- −$51 /mo · $615/yr
- Insurance
- −$27
- HOA
- −$0
- Vacancy / Maint / Mgmt
- −$319
- Net cashflow
- $777
Break-even live
Sensitivity live
| Price | -10% $814 | -5% $795 | +0% $777 | +5% $758 | +10% $740 |
|---|---|---|---|---|---|
| Rent | -10% $657 | -5% $717 | +0% $777 | +5% $837 | +10% $897 |
| Rate | -1.0pp $810 | -0.5pp $794 | base $777 | +0.5pp $760 | +1.0pp $743 |
UW: 25.0% down · 7.5% · 30yr · 1.5% tax · 5.0% vac · 8.0% maint · 8.0% mgmt
Financing live
Cash to close
- Down payment
- $16,400
- Closing costs
- $1,968
- Reserves months
- —
- Total cash needed
- —
Loan-product check · same deal, 3 products live
Conventional
25% down · 7.5% · 30yr
- Down + closing
- —
- Monthly P&I
- —
- Monthly cashflow
- —
- DSCR
- —
- Eligible?
- —
Personal DTI + credit; lowest rate.
DSCR
20% down · 8.5% · 30yr
- Down + closing
- —
- Monthly P&I
- —
- Monthly cashflow
- —
- DSCR
- —
- Eligible?
- —
No personal income docs; deal must DSCR.
Hard money
10% down · 12.0% · 12mo
- Down + closing
- —
- Monthly P&I
- —
- Monthly cashflow
- —
- DSCR
- —
- Eligible?
- —
Short-term bridge; refi at stabilization.
Rent comps 40 comps
| Address | Beds | Baths | Sqft | Rent | $/sqft | DOM | Units | Dist |
|---|---|---|---|---|---|---|---|---|
| 91 Reynolds St Unit 6 Rochester, NY | 2.0 | 1.0 | 900 | $1,100 | $1.22 | 45d | 1 | 0.21mi |
| 192 Bartlett St Unit 192 Rochester, NY | 3.0 | 1.0 | 1099 | $1,295 | $1.18 | 15d | 1 | 0.27mi |
| 165 Atkinson St #6 Rochester, NY | 2.0 | 1.0 | 925 | $1,150 | $1.24 | 24d | 1 | 0.34mi |
| 95 Troup St Apt 8 Rochester, NY | 2.0 | 1.0 | 800 | $1,785 | $2.23 | 45d | 1 | 0.72mi |
| 65 W Broad St Unit 401 Rochester, NY | 1.0 | 1.0 | 647 | $1,399 | $2.16 | 24d | 1 | 0.89mi |
| 65 W Broad St Apt 404 Rochester, NY | 1.0 | 1.0 | 646 | $1,369 | $2.12 | 4d | 1 | 0.89mi |
| 65 W Broad St Unit 808 Rochester, NY | 2.0 | 1.0 | 796 | $1,679 | $2.11 | 15d | 1 | 0.89mi |
| 65 W Broad St Unit 303 Rochester, NY | 1.0 | 1.0 | 730 | $1,519 | $2.08 | 4d | 1 | 0.89mi |
| 65 W Broad St Unit 502 Rochester, NY | 1.0 | 1.0 | 666 | $1,329 | $2.00 | 24d | 1 | 0.89mi |
| 65 W Broad St Unit 705 Rochester, NY | 1.0 | 1.0 | 711 | $1,449 | $2.04 | 24d | 1 | 0.89mi |
| 290 Exchange Blvd Rochester, NY | 2.0 | 1.0–2.0 | 892 | $2,102 | $2.36 | 4d | 15 | 0.91mi |
| 13 S Fitzhugh St Rochester, NY | 1.0–2.0 | 1.5–2.0 | 890 | $2,098 | $2.36 | 11d | 2 | 0.92mi |
| 71 Sanford St Unit 1546304P Rochester, NY | 2.0 | 1.0 | 839 | $4,032 | $4.81 | 15d | 1 | 0.92mi |
| 30 W Broad St Unit 208 Rochester, NY | 1.0 | 1.0 | 924 | $2,090 | $2.26 | 24d | 1 | 0.95mi |
| 30 W Broad St Unit 406 Rochester, NY | 1.0 | 1.0 | 830 | $1,740 | $2.10 | 45d | 1 | 0.95mi |
| 30 W Broad St Unit 203 Rochester, NY | 1.0 | 1.0 | 700 | $1,790 | $2.56 | 11d | 1 | 0.95mi |
| 30 W Broad St Unit 409 Rochester, NY | 1.0 | 1.0 | 755 | $1,940 | $2.57 | 4d | 1 | 0.95mi |
| 30 W Broad St Unit 307 Rochester, NY | 2.0 | 1.0 | 911 | $1,950 | $2.14 | 45d | 1 | 0.95mi |
| 30 W Broad St Unit 210 Rochester, NY | 1.0 | 1.0 | 600 | $1,640 | $2.73 | 11d | 1 | 0.95mi |
| 30 W Broad St Unit 405 Rochester, NY | 1.0 | 1.0 | 730 | $1,665 | $2.28 | 11d | 1 | 0.95mi |
| 55 Exchange Blvd Rochester, NY | 2.0 | 1.0–2.0 | 952 | $2,695 | $2.83 | 4d | 28 | 0.98mi |
| 1400 S Plymouth Ave Rochester, NY | 1.0 | 1.0 | 463 | $879 | $1.90 | 45d | 1 | 1.01mi |
| 39 State St Rochester, NY | 1.0–2.0 | 1.0–2.5 | 1154 | $3,500 | $3.03 | 4d | 8 | 1.02mi |
| 658 Smith St Rochester, NY | 2.0 | 1.0 | 981 | $1,500 | $1.53 | 4d | 1 | 1.04mi |
| 367 West Ave Unit 2 Rochester, NY | 2.0 | 1.0 | 639 | $1,275 | $2.00 | 24d | 1 | 1.05mi |
| 367 West Ave Apt 4 Rochester, NY | 1.0 | 1.0 | 550 | $1,000 | $1.82 | 24d | 1 | 1.05mi |
| 155 State St Rochester, NY | 1.0 | 1.0 | 672 | $1,250 | $1.86 | 45d | 1 | 1.05mi |
| 155 State St Rochester, NY | 1.0 | 1.0 | 776 | $1,450 | $1.87 | 22d | 1 | 1.05mi |
| 46 Comfort St Rochester, NY | 1.0 | 1.0 | 600 | $895 | $1.49 | 4d | 1 | 1.08mi |
| 90 Manor Pkwy Rochester, NY | 2.0 | 1.0 | 600 | $1,485 | $2.48 | 11d | 3 | 1.10mi |
| 24 Menlo Pl Rochester, NY | 1.0 | 1.0 | 750 | $1,495 | $1.99 | 4d | 1 | 1.10mi |
| 209 Gregory St Rochester, NY | 1.0 | 1.0 | 1000 | $1,250 | $1.25 | 45d | 1 | 1.12mi |
| 102 Court St Rochester, NY | 1.0–2.0 | 1.0–2.0 | 952 | $2,570 | $2.70 | 4d | 11 | 1.13mi |
| 802 Maple St Rochester, NY | 2.0 | 1.5 | 1080 | $1,800 | $1.67 | 45d | 1 | 1.15mi |
| 257 Hague St Unit 257 Rochester, NY | 2.0 | 1.5 | 1080 | $1,500 | $1.39 | 45d | 1 | 1.16mi |
| 224 Mill St Unit 4B Rochester, NY | 1.0 | 1.0 | 923 | $1,700 | $1.84 | 15d | 1 | 1.16mi |
| 60 Lime St Unit Upper Rochester, NY | 1.0 | 1.0 | 650 | $800 | $1.23 | 4d | 1 | 1.18mi |
| 445 Post Ave Unit 11 Rochester, NY | 2.0 | 1.0 | 600 | $1,209 | $2.02 | 24d | 1 | 1.20mi |
| 49 Stone St #401 Rochester, NY | 1.0 | 1.0 | 725 | $1,550 | $2.14 | 24d | 1 | 1.24mi |
| 49 Stone St #302 Rochester, NY | 1.0 | 1.0 | 660 | $1,345 | $2.04 | 24d | 1 | 1.24mi |
Listing history 22 events
-
2026-06-21days on market $65,600 Active 60 DOM
-
2026-06-18days on market $65,600 Active 57 DOM
-
2026-06-17days on market $65,600 Active 56 DOM
-
2026-06-16days on market $65,600 Active 55 DOM
-
2026-06-15days on market $65,600 Active 54 DOM
-
2026-06-13days on market $65,600 Active 52 DOM
-
2026-06-13days on market $65,600 Active 51 DOM
-
2026-06-10days on market $65,600 Active 49 DOM
-
2026-06-09days on market $65,600 Active 48 DOM
-
2026-06-09days on market $65,600 Active 47 DOM
-
2026-06-07days on market $65,600 Active 46 DOM
-
2026-06-05days on market $65,600 Active 43 DOM
-
2026-06-03days on market $65,600 Active 42 DOM
-
2026-06-03days on market $65,600 Active 41 DOM
-
2026-06-01days on market $65,600 Active 40 DOM
-
2026-05-31days on market $65,600 Active 39 DOM
-
2026-04-22$65,600 Active 597-char remark
Show marketing remark (597 chars)
Single family 2B/1Bath ranch-style home. New roof within the past 2 years (total tear-off). Vinyl sided (needs repair), with vinyl windows. Driveway included. Needs interior remodeled. This property is being offered strictly "as-is" The Seller will not provide a Certificate of Occupancy, nor will they perform any repairs or offer credits towards repairs or closing costs. This is an opportunity for an investor or savvy buyer looking for a project property. Buyers are encouraged to perform their own due diligence, but note that the seller is firm on the "as-is" conditions.
-
2024-05-23$29,900 Active
-
2014-12-01soldstatus $15,500
-
2014-09-01$18,000
-
2011-10-31soldstatus $20,000
-
2011-07-15$22,000
ⓘ Source: listings_history table (triggers on properties + properties_extension) + one-shot
backfill from property_details.listing_events for pre-trigger history.
Tax reassessment forecast NY · Partial reset (capped growth)
- Current annual tax
- $615 · $51/mo
- Projected year-2 tax
- $862 · $72/mo
- Expected delta
- +$247/yr (+$21/mo · 40.1%)
ⓘ Screening estimate from a state-policy table — verify with the county assessor before closing.
Climate risk First Street
- Flood 1/10 Low FEMA zone X (unshaded) · 0% chance over 30 yrs
- Wildfire 1/10 Low
- Heat 2/10 Low 7 d/yr ≥96°F today · 15 d/yr by 30 yrs out
- Wind 1/10 Low
- Air quality 2/10 Low 1 unhealthy d/yr today · 1 by 30 yrs out
Nearby sold comps map
Loading sold comps map…
Walkable amenities ~0.75 mi
Loading nearby amenities…
Taxation est. · year 1
- Rental income
- $18,220
- − Mortgage interest
- −$3,675
- − Property taxes
- −$615
- − Insurance
- −$328
- − Repairs & maintenance
- −$1,458
- − Management
- −$1,458
- − Depreciation
- −$1,908
- Taxable income
- $8,778
- Est. tax owed @ 24.0%
- −$2,107
- After-tax cash flow
- $7,215/yr
For passive investors: Depreciation is non-cash, so a rental often shows a tax loss while cash-flowing — sheltering income. Rental losses are passive: they offset passive income freely, and up to $25,000/yr can offset ordinary (W-2) income if you actively participate and your MAGI is under $100k (phasing out to $0 by $150k); unused losses carry forward. On sale, claimed depreciation is recaptured at up to 25%, and gains may owe capital-gains tax (a 1031 exchange can defer both). Figures are a year-1 estimate at your 24.0% rate — not tax advice; consult a CPA.
Schools (NCES district)
- District
- Rochester City School District
- NCES district ID
- 3624750
- Math proficiency
- 21% ▬ 0.00%
- Reading proficiency
- 26% ▲ 4.00%
- Median HH income
- $30,923
- Composite
- 18.98/100
- National rank
- #8850
- State rank
- #589 of 590 in NY
Livability — Rochester
- Score
- 76/100
- State rank
- #222
- US rank
- #3482
Category grades
Schools grade is shown separately in the Schools card above.
Census & demographics
- Census place
- Rochester, NY
- County
- Monroe County · 674,131 people
- City population
- 432,803
- Metro
- Rochester, NY
- Population (ZIP)
- 12,792
- Household income
- $40,646
- Rent vs Own
- Severe rent burden
- 1300.0
Population outlook (Monroe County) Hauer SSP2
- Today (2025)
- 759,460 people
- By 2030
- 757,154 · -0.3%
- By 2040
- 740,644 · -2.5%
- By 2050
- 714,443 · -5.9%
- By 2075
- 645,883 · -15.0%
- By 2100
- 547,084 · -28.0%
Race, ethnicity, and origin ACS 2023
- Neighborhood character
- Diverse neighborhood (Simpson 0.67)
- Race & ethnicity
- Black 50% White 25% Two or more races 13% Hispanic / Latino 12% Asian 4%
- Hispanic origin (detail)
- Puerto Rican 10%
- Common ancestry
- Lithuanian 1% Romanian 1% Iranian 1%
- Foreign-born
- 8% · Canada, India
- Languages at home
- 85% English-only · Spanish 8% Other Indo-European 3% French/Haitian/Cajun 1%
Political lean MEDSL · Monroe
- 2024 margin
- D (+19.1) · D 59.5% · R 40.5%
- 2008→2024 swing
- +1.4pp toward D · 2008: 17.7pp · 2024: 19.1pp
- All cycles
- 2024: D+19.1 2020: D+21.0 2016: D+14.1 2012: D+17.4 2008: D+17.7
Not yet ingested
- Civics
- —
Market trends
- HPI YoY
- ▲ 3.69%
- Current HPI
- 280.2411
- Rent YoY
- ▲ 6.61%
- Metro
- Rochester, NY
- State GDP YoY
- ▲ 2.60%
- F500 in state
- 92
Industry mix (Fortune 500 HQ in NY)
| Industry | F500 HQs | Revenue |
|---|---|---|
| Financial Services | 10 | $950B |
|
||
| Consumer Goods | 9 | $162B |
|
||
| Insurance | 4 | $225B |
|
||
| Telecommunications | 2 | $144B |
|
||
| Pharmaceuticals | 2 | $112B |
|
||
| Media / Entertainment | 2 | $69B |
|
||
Price history
+198.2% since first listed6 events — show timeline
- 2026-04-22 Listed $65,600 UNYREIS
- 2024-05-23 Listed $29,900 UNYREIS
- 2014-12-01 Sold (MLS) $15,500 UNYREIS
- 2014-09-01 Listed $18,000 UNYREIS
- 2011-10-31 Sold (MLS) $20,000 UNYREIS
- 2011-07-15 Listed $22,000 UNYREIS
Property tax history
-1.2%/yrLatest (2025): $615 · +0.0% YoY. Source: county tax records.
Cash-flow waterfall
monthlySold comps — $/sqft
last 12 mo · ≤1 miLoading sold comps…