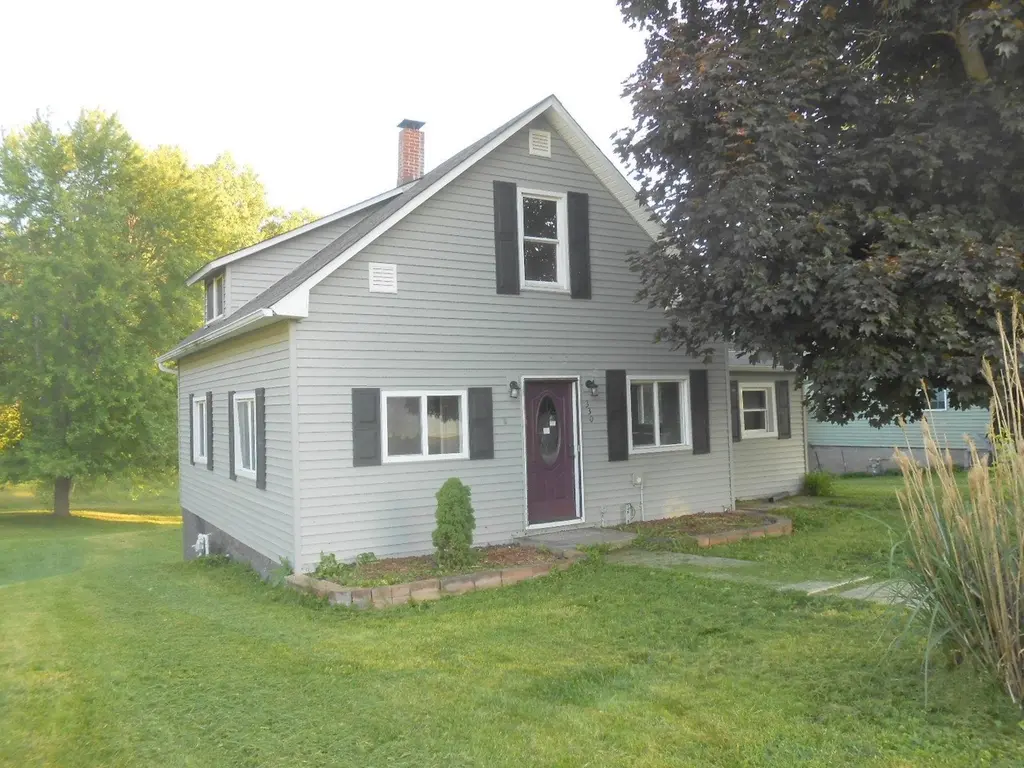
330 Jones Ave · Warren, IN
Flood risk 8/10 · Major
- FEMA flood zone
- X (unshaded)
- Chance of flooding over 30 yrs
- 0.99%
- Est. flood insurance / yr
- $473 – $860
Fire risk 1/10 · Minimal
- Est. fire insurance / yr
- $717 – $1,331
Heat risk 3/10 · Minor
- Hot days now (above 100°F)
- 7 days/yr
- Hot days in 30 yrs
- 17 days/yr
Wind risk 2/10 · Minimal
- Chance of severe wind over 30 yrs
- 1.0%
Air-quality risk 2/10 · Minimal
- Unhealthy air days now
- 1 days/yr
- Unhealthy air days in 30 yrs
- 3 days/yr
Risk factors via First Street. Map © Google.
Why this score? — see what drove the C grade
The composite is a weighted blend of 9 inputs, each scored 0–100. Each bar is that input's sub-score; the figure is the points it added to the 100-point composite (weight × sub-score).
- Cash flow +18.7/30.0
- ARV discount +15.0/15.0
- DSCR +5.9/10.0
- 1% rule +4.4/10.0
- Livability +3.6/5.0
- Schools +3.1/10.0
- Rent growth +2.5/5.0
- Condition / age +2.5/5.0
- Appreciation +1.4/10.0
$135,600
🖨 Deal sheet (PDF) 📄 Offer letter ✓ Due diligence
Listing remarks
1.5 story house with vinyl siding and roof appears recent install of shingles. Elevated wood deck overlooks open area and sloping rear yard. Some improvements would make this home your own. O
Key facts
- Sloping rear yard
- Vinyl siding
- Elevated wood deck
Tags
Property features AI
Finance
- Other: Located in the D Littles subdivision; Directions available: From I-69 east on 5 into Warren, left on 7th St, left on Nancy St, right on Jones Ave to house on right
Exterior
- Parking: No designated parking
- Utilities: Public water; Public sewer
- Home design: Single-family site-built home; Residential property
- Construction: Vinyl siding; Asphalt roof; Concrete perimeter foundation; Above-grade finished area reported
- Exterior features: Sloped lot; Lot dimensions approximately 109 x 132; Lot roughly 0.33 acre
Interior
- Flooring: Carpet
- Bathrooms: One full bathroom; One half bathroom; One main-level bathroom
- Heating & cooling: Central air conditioning; Natural gas forced-air heating
- Interior features: Carpet flooring; One fireplace; Basement present; Seven total rooms
- Laundry & utility: Laundry on the main level
Neighborhood map
What this means for you Summary
Snapshot
- This is a 3-bed/1.5-bath single-family listed at $136k.
Deal economics
- At list price, monthly cash flow is $79 ($944/yr) — positive.
- The deal already cash-flows at list — no discount required.
- To meet the 1% rule (rent ≥ 1% of price), the offer needs to be $127k (6.1% below list).
- Recommended offer: $127k (6.1% below list) — sets the bar for 1% rule.
Location & tenants
- Location reads 71/100 on livability (#137 in IN) — a middle-class / working-renter tenant base. Strengths: crime A+, cost of living A+, housing A+; Watch: health & safety C-, amenities F, commute F.
- Huntington County Community School Corporation (rural): math 34% / reading 39% proficiency, ranked #176 of 301 in IN (top 58%) — families likely to look elsewhere, expect single-tenant / working-renter base with shorter leases.
- Zoned schools: Salamonie Elementary School (math 52% / reading 42%, grade D-, #325 of 994 statewide, top 36%, 286 students, 46% FRL); Riverview School (math 29% / reading 40%, grade F, #167 of 330 statewide, top 52%, 503 students, 54% FRL); Huntington North High School (math 30% / reading 55%, grade F, #195 of 369 statewide, top 53%, 1,424 students, 42% FRL).
- Market conditions: 11 active listings in the ZIP; 79 units permitted in Huntington County in 2024 (0 in 5+ unit buildings).
Forward outlook
- Local home prices are declining (-3.0%/yr); year-one equity from $938 of loan paydown is wiped out by about $4k of value loss. Plan a longer hold.
- Huntington County population projected at -14% by 2050 — secular population decline; favor cash flow + early exit over multi-decade hold.
Negotiation context
- It's been on market 24 days — a 2% lower offer ($134k) is reasonable based on typical stale-listing flexibility.
Risks & watch-outs
- Watch-outs: flood insurance adds $56/mo; built in 1900 — expect roof / HVAC / electrical / plumbing capex.
- Climate carrying-cost: severe flood risk — expect insurance premiums to compound above CPI over the hold.
Questions for the listing agent
- Built in 1900 — when were the roof, HVAC, electrical panel, plumbing, and water heater last replaced?
- What's the actual annual flood-insurance premium (NFIP or private), and is the property in a SFHA with mandatory coverage?
- Is there a deadline driving the sale (1031 exchange, divorce, estate, relocation)? That informs how much negotiation room exists.
- What's the average days-on-market for RENTAL listings here right now (not sales)? A rising rental-DOM trend means longer vacancies and softer asking-rent achievability than the comps imply.
- What's the recent tenant-quality profile in this submarket — average credit score on applications, eviction rate, late-payment / NSF rate, and stable-employment percentage? A property-management company in the area should have these aggregated.
- How much new for-sale + rental construction is in the pipeline within 1–3 miles? Heavy new supply typically softens prices + rents 12–24 months out; constrained supply supports both.
Investment metrics
- 1% rule
- 0.94% ✗
- Cap rate
- 7.48%
- Cash-on-cash
- 4.24%
- DSCR
- 1.19
- GRM
- 8.9
CMA / ARV
- ARV (on-the-fly)
- $227,700
- Comps found
- 12
Show comp detail 12 sales within ~0.75 mi
| Address | Dist | Beds/Ba | Sqft | Sold | Price | $/sf | Match |
|---|---|---|---|---|---|---|---|
| 203 E 8th St | 0.12mi | 3/2.0 | 1,877 (-5%) | 2mo | $216,000 | $115 | 82 |
| 412 N Nancy St | 0.18mi | 3/1.0 | 1,824 (-8%) | 3mo | $85,000 | $47 | 74 |
| 710 N Wayne St | 0.16mi | 3/2.0 | 1,850 (-7%) | 9mo | $240,000 | $130 | 72 |
| 517 N Nancy St | 0.11mi | 4/2.0 (+1) | 1,908 (-4%) | 12mo | $193,400 | $101 | 72 |
| 511 N Nancy St | 0.13mi | 3/1.0 | 2,250 (+14%) | 5mo | $230,000 | $102 | 65 |
| 212 N Hendricks St | 0.28mi | 3/2.0 | 1,736 (-12%) | 3mo | $194,000 | $112 | 62 |
| 1247 N Wayne St | 0.54mi | 2/1.5 (-1) | 1,944 (-2%) | 8mo | $299,000 | $154 | 61 |
| 425 Main St | 0.20mi | 4/1.0 (+1) | 2,158 (+9%) | 21mo | $70,000 | $32 | 51 |
| 407 N Main St | 0.22mi | 3/2.0 | 1,700 (-14%) | 16mo | $199,900 | $118 | 51 |
| 220 Vanmalson Dr | 0.54mi | 3/2.0 | 1,848 (-7%) | 18mo | $264,000 | $143 | 46 |
| 128 E Parkway Dr | 0.59mi | 3/2.0 | 1,821 (-8%) | 20mo | $130,000 | $71 | 41 |
| 230 Van Malson Dr | 0.55mi | 4/2.0 (+1) | 1,818 (-8%) | 18mo | $270,000 | $149 | 38 |
Match score weights: distance 35% · size 25% · config 20% · recency 20%. Top-matched comps best support the ARV.
Projected returns pro-forma
-3.0% appreciation · 3.0% rent growth · sell at horizon
- IRR
- -12.4%
- Equity multiple
- 0.55×
- Total profit
- $-16,952
- Equity at exit
- $20,218
- IRR
- -3.3%
- Equity multiple
- 0.78×
- Total profit
- $-8,258
- Equity at exit
- $11,724
Cash invested: $37,968 (down + closing). Projections, not guarantees.
Landlord ↔ Tenant lean methodology
- Overall (STATE)
- 90 Strongly Landlord-Friendly
- State Indiana
- 90 Strongly Landlord-Friendly · R+11
- County
- — inherits STATE
- City
- — inherits STATE
ZIP-level market 46792
- Home prices YoY
- -2.9%
- Active inventory
- 11
- Price-to-rent
- 8.9×
Monthly cashflow live
- Estimated rent
- $1,274 medium interval (Pro) →
- Mortgage (P&I)
- −$711
- Tax from tax record
- −$105 /mo · $1,255/yr
- Insurance
- −$56
- Flood insurance flood zone
- −$56 /mo · $666/yr
- HOA
- −$0
- Vacancy / Maint / Mgmt
- −$268
- Net cashflow
- $79
Break-even live
Sensitivity live
| Price | -10% $155 | -5% $117 | +0% $79 | +5% $40 | +10% $2 |
|---|---|---|---|---|---|
| Rent | -10% $-22 | -5% $28 | +0% $79 | +5% $129 | +10% $179 |
| Rate | -1.0pp $147 | -0.5pp $113 | base $79 | +0.5pp $43 | +1.0pp $8 |
UW: 25.0% down · 7.5% · 30yr · 1.5% tax · 5.0% vac · 8.0% maint · 8.0% mgmt
Financing live
Cash to close
- Down payment
- $33,900
- Closing costs
- $4,068
- Reserves months
- —
- Total cash needed
- —
Loan-product check · same deal, 3 products live
Conventional
25% down · 7.5% · 30yr
- Down + closing
- —
- Monthly P&I
- —
- Monthly cashflow
- —
- DSCR
- —
- Eligible?
- —
Personal DTI + credit; lowest rate.
DSCR
20% down · 8.5% · 30yr
- Down + closing
- —
- Monthly P&I
- —
- Monthly cashflow
- —
- DSCR
- —
- Eligible?
- —
No personal income docs; deal must DSCR.
Hard money
10% down · 12.0% · 12mo
- Down + closing
- —
- Monthly P&I
- —
- Monthly cashflow
- —
- DSCR
- —
- Eligible?
- —
Short-term bridge; refi at stabilization.
Listing history 18 events
-
2026-06-21days on market $135,600 Active 24 DOM
-
2026-06-19days on market $135,600 Active 22 DOM
-
2026-06-18days on market $135,600 Active 21 DOM
-
2026-06-17days on market $135,600 Active 20 DOM
-
2026-06-16days on market $135,600 Active 19 DOM
-
2026-06-15days on market $135,600 Active 18 DOM
-
2026-06-14days on market $135,600 Active 16 DOM
-
2026-06-12days on market $135,600 Active 15 DOM
-
2026-06-09days on market $135,600 Active 12 DOM
-
2026-06-08days on market $135,600 Active 11 DOM
-
2026-06-07days on market $135,600 Active 10 DOM
-
2026-06-05days on market $135,600 Active 7 DOM
-
2026-06-03days on market $135,600 Active 6 DOM
-
2026-06-02days on market $135,600 Active 5 DOM
-
2026-06-01days on market $135,600 Active 4 DOM
-
2026-05-31days on market $135,600 Active 3 DOM
-
2026-05-30days on market $135,600 Active 2 DOM
-
2026-05-26$135,600 Active
ⓘ Source: listings_history table (triggers on properties + properties_extension) + one-shot
backfill from property_details.listing_events for pre-trigger history.
Tax reassessment forecast IN · Partial reset (capped growth)
- Current annual tax
- $1,255 · $105/mo
- Projected year-2 tax
- $1,255 · $105/mo
- Expected delta
- $0/yr ($0/mo · 0.0%)
ⓘ Screening estimate from a state-policy table — verify with the county assessor before closing.
Climate risk First Street
- Flood 8/10 Severe FEMA zone X (unshaded) · 99% chance over 30 yrs
- Wildfire 1/10 Low
- Heat 3/10 Moderate 7 d/yr ≥100°F today · 17 d/yr by 30 yrs out
- Wind 2/10 Low 100% chance of damaging wind over 30 yrs
- Air quality 2/10 Low 1 unhealthy d/yr today · 3 by 30 yrs out
Nearby sold comps map
Loading sold comps map…
Walkable amenities ~0.75 mi
Loading nearby amenities…
Taxation est. · year 1
- Rental income
- $15,286
- − Mortgage interest
- −$7,596
- − Property taxes
- −$1,255
- − Insurance
- −$1,344
- − Repairs & maintenance
- −$1,223
- − Management
- −$1,223
- − Depreciation
- −$3,945
- Taxable loss
- −$1,299
- Est. tax savings @ 24.0%
- +$312
- After-tax cash flow
- $1,255/yr
For passive investors: Depreciation is non-cash, so a rental often shows a tax loss while cash-flowing — sheltering income. Rental losses are passive: they offset passive income freely, and up to $25,000/yr can offset ordinary (W-2) income if you actively participate and your MAGI is under $100k (phasing out to $0 by $150k); unused losses carry forward. On sale, claimed depreciation is recaptured at up to 25%, and gains may owe capital-gains tax (a 1031 exchange can defer both). Figures are a year-1 estimate at your 24.0% rate — not tax advice; consult a CPA.
Schools (NCES district)
- District
- Huntington County Community School Corporation
- NCES district ID
- 1804710
- Math proficiency
- 34% ▼ -6.00%
- Reading proficiency
- 39% ▼ -10.00%
- Median HH income
- $47,010
- Composite
- 31.29/100
- National rank
- #6013
- State rank
- #176 of 301 in IN
Livability — Warren
- Score
- 71/100
- State rank
- #137
- US rank
- #7126
Category grades
Schools grade is shown separately in the Schools card above.
Census & demographics
- Census place
- Warren, IN
- Population (ZIP)
- 3,577
Population outlook (Huntington County) Hauer SSP2
- Today (2025)
- 35,613 people
- By 2030
- 34,759 · -2.4%
- By 2040
- 32,682 · -8.2%
- By 2050
- 30,495 · -14.4%
- By 2075
- 26,298 · -26.2%
- By 2100
- 22,653 · -36.4%
Race, ethnicity, and origin ACS 2023
- Neighborhood character
- Predominantly White (95%)
- Race & ethnicity
- White 95% Two or more races 3% Hispanic / Latino 1%
- Common ancestry
- Italian 5% Slovak 2% Lithuanian 2%
- Foreign-born
- 1%
- Languages at home
- 98% English-only · Spanish 1%
Political lean MEDSL · Huntington
- 2024 margin
- Solid R (+48.4) · D 24.9% · R 73.3% · Other 1.8%
- 2008→2024 swing
- -21.2pp toward R · 2008: -27.2pp · 2024: -48.4pp
- All cycles
- 2024: R+48.4 2020: R+49.9 2016: R+51.0 2012: R+39.8 2008: R+27.2
Not yet ingested
- Civics
- —
Market trends
- HPI YoY
- ▼ -7.11%
- Current HPI
- 238.5693
- Rent YoY
- —
- Metro
- —
- State GDP YoY
- ▲ 2.90%
- F500 in state
- 18
Industry mix (Fortune 500 HQ in IN)
| Industry | F500 HQs | Revenue |
|---|---|---|
| Industrial Machinery | 2 | $37B |
|
||
| Healthcare | 1 | $177B |
|
||
| Pharmaceuticals | 1 | $45B |
|
||
| Metals / Steel | 1 | $18B |
|
||
| Agriculture | 1 | $17B |
|
||
| Packaging | 1 | $12B |
|
||
Price history
1 event — show timeline
- 2026-05-26 Listed $135,600 IRMLS
Property tax history
-2.8%/yrLatest (2024): $1,255 · +27.7% YoY. Source: county tax records.
Cash-flow waterfall
monthlySold comps — $/sqft
last 12 mo · ≤1 miLoading sold comps…