1011 Bert Cir · Penn, PA
Flood risk 1/10 · Minimal
- FEMA flood zone
- X (unshaded)
- Chance of flooding over 30 yrs
- 0.0%
- Est. flood insurance / yr
- $507 – $1,088
Fire risk 1/10 · Minimal
- Est. fire insurance / yr
- $511 – $949
Heat risk 3/10 · Minor
- Hot days now (above 95°F)
- 7 days/yr
- Hot days in 30 yrs
- 17 days/yr
Wind risk 2/10 · Minimal
- Chance of severe wind over 30 yrs
- —
Air-quality risk 3/10 · Minor
- Unhealthy air days now
- 2 days/yr
- Unhealthy air days in 30 yrs
- 4 days/yr
Risk factors via First Street. Map © Google.
Why this score? — see what drove the A grade
The composite is a weighted blend of 9 inputs, each scored 0–100. Each bar is that input's sub-score; the figure is the points it added to the 100-point composite (weight × sub-score).
- Cash flow +30.0/30.0
- ARV discount +15.0/15.0
- 1% rule +10.0/10.0
- DSCR +10.0/10.0
- Schools +6.0/10.0
- Appreciation +4.7/10.0
- Condition / age +4.0/5.0
- Livability +2.8/5.0
- Rent growth +2.5/5.0
$72,999
🖨 Deal sheet 📄 Offer letter ✓ Due diligence
Listing remarks MLS
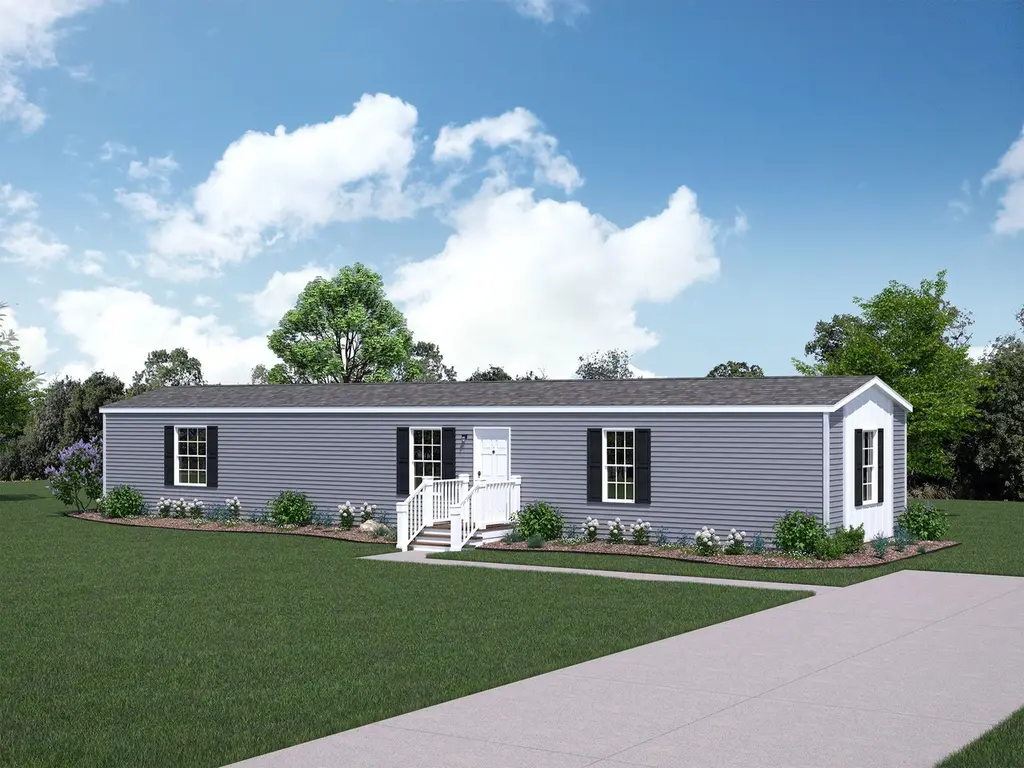
More space. More comfort. This brand-new 1,001 square foot, 2-bedroom, 2-bath home offers the room you need without the price tag you'd expect. Perfect for couples, small families, or anyone ready to start owning. The Highland delivers a thoughtful single-level layout with generous living space, two full bathrooms, and bedrooms designed for real life. The open kitchen flows into the living area, making everyday living feel easy and connected. Kitchen features include stainless steel appliances (18 cu. ft. refrigerator, 30" electric range, vented hood), a counter-height island, LED lighting, and durable laminate countertops with modern cabinetry. Built to last with R-33 roof insulation, R-13 wall insulation, 8' flat ceilings with stipple finish, vinyl lap siding with 25-year architectural shingles, Low-E insulated vinyl windows with grids, 200 Amp electrical panel, 40-gallon electric water heater, and a full 1-year warranty. Penn Heights is a quiet, welcoming community in Pennsylvania - where small-town charm meets everyday convenience. Residents enjoy easy access to local shopping, dining, parks, and major routes, while still coming home to a peaceful, private setting.
Key facts
- Modern cabinetry
- Single-level layout
- Open kitchen
Tags
Neighborhood map
What this means for you Summary
Snapshot
- This is a 3-bed/2.0-bath single-family listed at $73k. Condition is rated good.
Deal economics
- At list price, monthly cash flow is $419 ($5k/yr) — positive.
- The deal already cash-flows at list — no discount required.
- Meets the 1% rule at list price ($1k rent vs $73k).
- Recommended offer: $69k (6.0% below list) — sets the bar for market timing.
Location & tenants
- Location reads 56/100 on livability (#1,637 in PA) — a working-class tenant base; expect higher turnover. Strengths: cost of living A+, housing A+; Watch: crime D+, schools F, amenities F.
- Penn-Trafford SD (suburban): math 60% / reading 78% proficiency, ranked #27 of 539 in PA (top 5%) — acceptable for families but not a draw, mixed tenant base, ~2y average lease; only 14% free/reduced lunch — higher-income household profile.
- Market conditions: 12 active listings in the ZIP; 4 comparable units currently listed for rent nearby; rentals leasing fast (median 10d on market — plan ~1-2 weeks tenant-placement turnaround); 415 units permitted in Westmoreland County in 2024 (10 in 5+ unit buildings).
Forward outlook
- In year one you build about $85 of equity ($504 loan paydown + $-419 appreciation (-0.6% local appreciation)).
- Westmoreland County population projected at -19% by 2050 — secular population decline; favor cash flow + early exit over multi-decade hold.
- At projected returns (-0.6% appreciation + 3.0% rent growth), your $20k cash investment doubles in ~4 years — after that, you're playing with house money.
Negotiation context
- It's been on market 70 days — a 6% lower offer ($69k) is reasonable based on typical stale-listing flexibility.
Questions for the listing agent
- It's been on market 70 days. Have you received any prior offers? Is the seller open to a 6% concession, seller financing, or rate buy-down credit?
- Why hasn't it sold? Are there any deal-killer items the seller is aware of (foundation, flood, title, zoning, code violations)?
- Is there a deadline driving the sale (1031 exchange, divorce, estate, relocation)? That informs how much negotiation room exists.
- Schools are F-rated, which usually means shorter tenancies and higher turnover. Who's the typical renter profile here, and what's been the actual vacancy rate?
- Crime grade is D in this area — have there been break-ins, vandalism, or insurance claims at this property in the last 3 years? What carrier currently insures it and at what premium?
- What's the average days-on-market for RENTAL listings here right now (not sales)? A rising rental-DOM trend means longer vacancies and softer asking-rent achievability than the comps imply.
- What's the recent tenant-quality profile in this submarket — average credit score on applications, eviction rate, late-payment / NSF rate, and stable-employment percentage? A property-management company in the area should have these aggregated.
- How much new for-sale + rental construction is in the pipeline within 1–3 miles? Heavy new supply typically softens prices + rents 12–24 months out; constrained supply supports both.
Investment metrics
- 1% rule
- 1.60% ✓
- Cap rate
- 13.18%
- Cash-on-cash
- 24.59%
- DSCR
- 2.09
- GRM
- 5.2
CMA / ARV
- ARV (median comp)
- $96,859
- List price
- $72,999
- Delta
- -24.63%
- Verdict
- UNDERPRICED
- Comps
- 8 within 1.0 mi
Show comp detail 2 sales within ~0.75 mi
| Address | Dist | Beds/Ba | Sqft | Sold | Price | $/sf | Match |
|---|---|---|---|---|---|---|---|
| 113 S 13th St | 0.74mi | 2/1.0 (-1) | 900 (-11%) | 7mo | $85,000 | $94 | 32 |
| 113 1/2 13th St | 0.74mi | 2/1.0 (-1) | 870 (-14%) | 1mo | $66,800 | $77 | 32 |
Match score weights: distance 35% · size 25% · config 20% · recency 20%. Top-matched comps best support the ARV.
Projected returns pro-forma
-0.57% appreciation · 3.0% rent growth · sell at horizon
- IRR
- 23.5%
- Equity multiple
- 2.11×
- Total profit
- $22,617
- Equity at exit
- $19,127
- IRR
- 28.3%
- Equity multiple
- 4.01×
- Total profit
- $61,556
- Equity at exit
- $21,399
Cash invested: $20,440 (down + closing). Projections, not guarantees.
Landlord ↔ Tenant lean methodology
- Overall (STATE)
- 62 Landlord-Friendly
- State Pennsylvania
- 62 Landlord-Friendly · EVEN
- County
- — inherits STATE
- City
- — inherits STATE
ZIP-level market 15675
- Home prices YoY
- -0.2%
- Active inventory
- 12
- Price-to-rent
- 5.2×
Monthly cashflow live
- Estimated rent
- $1,169 medium interval (Pro) →
- Mortgage (P&I)
- −$383
- Tax est. 1.5%
- −$91 /mo · $1,095/yr
- Insurance
- −$30
- HOA
- −$0
- Vacancy / Maint / Mgmt
- −$245
- Net cashflow
- $419
Break-even live
UW: 25.0% down · 7.5% · 30yr · 1.5% tax · 5.0% vac · 8.0% maint · 8.0% mgmt
Financing live
Cash to close
- Down payment
- $18,250
- Closing costs
- $2,190
- Reserves months
- —
- Total cash needed
- —
Loan-product check · same deal, 3 products live
Conventional
25% down · 7.5% · 30yr
- Down + closing
- —
- Monthly P&I
- —
- Monthly cashflow
- —
- DSCR
- —
- Eligible?
- —
Personal DTI + credit; lowest rate.
DSCR
20% down · 8.5% · 30yr
- Down + closing
- —
- Monthly P&I
- —
- Monthly cashflow
- —
- DSCR
- —
- Eligible?
- —
No personal income docs; deal must DSCR.
Hard money
10% down · 12.0% · 12mo
- Down + closing
- —
- Monthly P&I
- —
- Monthly cashflow
- —
- DSCR
- —
- Eligible?
- —
Short-term bridge; refi at stabilization.
Rent comps 4 comps
| Address | Beds | Baths | Sqft | Rent | $/sqft | DOM | Units | Dist |
|---|---|---|---|---|---|---|---|---|
| 211 S 7th St Unit A Jeannette, PA | 3.0 | 1.0 | 900 | $1,450 | $1.61 | 1d | 1 | 1.11mi |
| 305 Chestnut St Jeannette, PA | 2.0 | 1.0 | 1250 | $1,265 | $1.01 | 10d | 1 | 1.30mi |
| 36 Gaskill Ave Unit 2 Jeannette, PA | 3.0 | 1.0 | 1100 | $950 | $0.86 | 1d | 1 | 1.44mi |
| 508 Lowry Ave Jeannette, PA | 2.0 | 1.0 | 1000 | $950 | $0.95 | 43d | 1 | 1.49mi |
Listing history 14 events
-
2026-06-18days on market $72,999 Active 70 DOM
-
2026-06-17days on market $72,999 Active 69 DOM
-
2026-06-16days on market $72,999 Active 68 DOM
-
2026-06-15days on market $72,999 Active 67 DOM
-
2026-06-13days on market $72,999 Active 65 DOM
-
2026-06-09days on market $72,999 Active 61 DOM
-
2026-06-08days on market $72,999 Active 60 DOM
-
2026-06-07days on market $72,999 Active 59 DOM
-
2026-06-05days on market $72,999 Active 56 DOM
-
2026-06-03days on market $72,999 Active 55 DOM
-
2026-06-02days on market $72,999 Active 54 DOM
-
2026-06-01days on market $72,999 Active 53 DOM
-
2026-05-31days on market $72,999 Active 52 DOM
-
2026-04-09$72,999 Active 1192-char remark
Show marketing remark (1192 chars)
More space. More comfort. This brand-new 1,001 square foot, 2-bedroom, 2-bath home offers the room you need without the price tag you'd expect. Perfect for couples, small families, or anyone ready to start owning. The Highland delivers a thoughtful single-level layout with generous living space, two full bathrooms, and bedrooms designed for real life. The open kitchen flows into the living area, making everyday living feel easy and connected. Kitchen features include stainless steel appliances (18 cu. ft. refrigerator, 30" electric range, vented hood), a counter-height island, LED lighting, and durable laminate countertops with modern cabinetry. Built to last with R-33 roof insulation, R-13 wall insulation, 8' flat ceilings with stipple finish, vinyl lap siding with 25-year architectural shingles, Low-E insulated vinyl windows with grids, 200 Amp electrical panel, 40-gallon electric water heater, and a full 1-year warranty. Penn Heights is a quiet, welcoming community in Pennsylvania - where small-town charm meets everyday convenience. Residents enjoy easy access to local shopping, dining, parks, and major routes, while still coming home to a peaceful, private setting.
ⓘ Source: listings_history table (triggers on properties + properties_extension) + one-shot
backfill from property_details.listing_events for pre-trigger history.
Climate risk First Street
- Flood 1/10 Low FEMA zone X (unshaded) · 0% chance over 30 yrs
- Wildfire 1/10 Low
- Heat 3/10 Moderate 7 d/yr ≥95°F today · 17 d/yr by 30 yrs out
- Wind 2/10 Low
- Air quality 3/10 Moderate 2 unhealthy d/yr today · 4 by 30 yrs out
Nearby sold comps map
Loading sold comps map…
Walkable amenities ~0.75 mi
Loading nearby amenities…
Taxation est. · year 1
- Rental income
- $14,026
- − Mortgage interest
- −$4,089
- − Property taxes
- −$1,095
- − Insurance
- −$365
- − Repairs & maintenance
- −$1,122
- − Management
- −$1,122
- − Depreciation
- −$2,124
- Taxable income
- $4,109
- Est. tax owed @ 24.0%
- −$986
- After-tax cash flow
- $4,041/yr
For passive investors: Depreciation is non-cash, so a rental often shows a tax loss while cash-flowing — sheltering income. Rental losses are passive: they offset passive income freely, and up to $25,000/yr can offset ordinary (W-2) income if you actively participate and your MAGI is under $100k (phasing out to $0 by $150k); unused losses carry forward. On sale, claimed depreciation is recaptured at up to 25%, and gains may owe capital-gains tax (a 1031 exchange can defer both). Figures are a year-1 estimate at your 24.0% rate — not tax advice; consult a CPA.
Condition & rehab AI · 10 photos
This brand-new, single-level home offers a thoughtful layout with generous living space and modern amenities, making it an excellent investment opportunity.
Value-add opportunities
- Both Painting the exterior and interior walls — Fresh paint enhances curb appeal and interior aesthetics.
- Both Landscaping improvements — Enhances curb appeal and adds value to the property.
- Both Adding smart home features — Improves convenience and adds modern appeal, attracting more buyers and renters.
- Both Upgrading the kitchen appliances — Modern appliances enhance functionality and appeal, making the home more desirable for both buyers and renters.
Renovation cost estimate screening
Value-add ROI direction
- Both Painting the exterior and interior walls — Fresh paint enhances curb appeal and interior aesthetics. ↑
- Both Landscaping improvements — Enhances curb appeal and adds value to the property. ↑
- Both Adding smart home features — Improves convenience and adds modern appeal, attracting more buyers and renters. ↑
- Both Upgrading the kitchen appliances — Modern appliances enhance functionality and appeal, making the home more desirable for both buyers and renters. ↑
ⓘ Cost ranges are severity-bucket heuristics (US national rule-of-thumb). Get contractor quotes + a written scope before underwriting a rehab budget.
Schools (NCES district)
- District
- Penn-Trafford SD
- NCES district ID
- 4218660
- Math proficiency
- 60% ▼ -13.00%
- Reading proficiency
- 78% ▼ -7.00%
- Median HH income
- $68,988
- Composite
- 60.28/100
- National rank
- #855
- State rank
- #27 of 539 in PA
Livability — Penn
- Score
- 56/100
- State rank
- #1637
- US rank
- #22584
Category grades
Schools grade is shown separately in the Schools card above.
Census & demographics
- Population (ZIP)
- 1,259
Population outlook (Westmoreland County) Hauer SSP2
- Today (2025)
- 342,555 people
- By 2030
- 331,717 · -3.2%
- By 2040
- 304,976 · -11.0%
- By 2050
- 277,444 · -19.0%
- By 2075
- 224,607 · -34.4%
- By 2100
- 171,084 · -50.1%
Race, ethnicity, and origin ACS 2023
- Neighborhood character
- Predominantly White (93%)
- Race & ethnicity
- White 93% Two or more races 5% Black 1%
- Common ancestry
- Romanian 9% Italian 4% Subsaharan African 3%
- Foreign-born
- 3%
- Languages at home
- 93% English-only · Russian/Polish/Slavic 5% Spanish 2%
Political lean MEDSL · Westmoreland
- 2024 margin
- Strong R (+28.4) · D 35.4% · R 63.9%
- 2008→2024 swing
- -11.7pp toward R · 2008: -16.7pp · 2024: -28.4pp
- All cycles
- 2024: R+28.4 2020: R+28.3 2016: R+31.3 2012: R+23.7 2008: R+16.7
Not yet ingested
- Civics
- —
Market trends
- HPI YoY
- ▼ -0.57%
- Current HPI
- 299.5257
- Rent YoY
- —
- Metro
- —
- State GDP YoY
- ▲ 1.68%
- F500 in state
- 34
Industry mix (Fortune 500 HQ in PA)
| Industry | F500 HQs | Revenue |
|---|---|---|
| Healthcare | 2 | $309B |
|
||
| Insurance | 2 | $27B |
|
||
| Telecommunications / Media | 1 | $124B |
|
||
| Industrial Distribution | 1 | $22B |
|
||
| Financial Services | 1 | $20B |
|
||
| Chemicals / Materials | 1 | $18B |
|
||
Price history
1 event — show timeline
- 2026-04-09 Listed $72,999 Zillow
Cash-flow waterfall
monthlySold comps — $/sqft
last 12 mo · ≤1 miLoading sold comps…