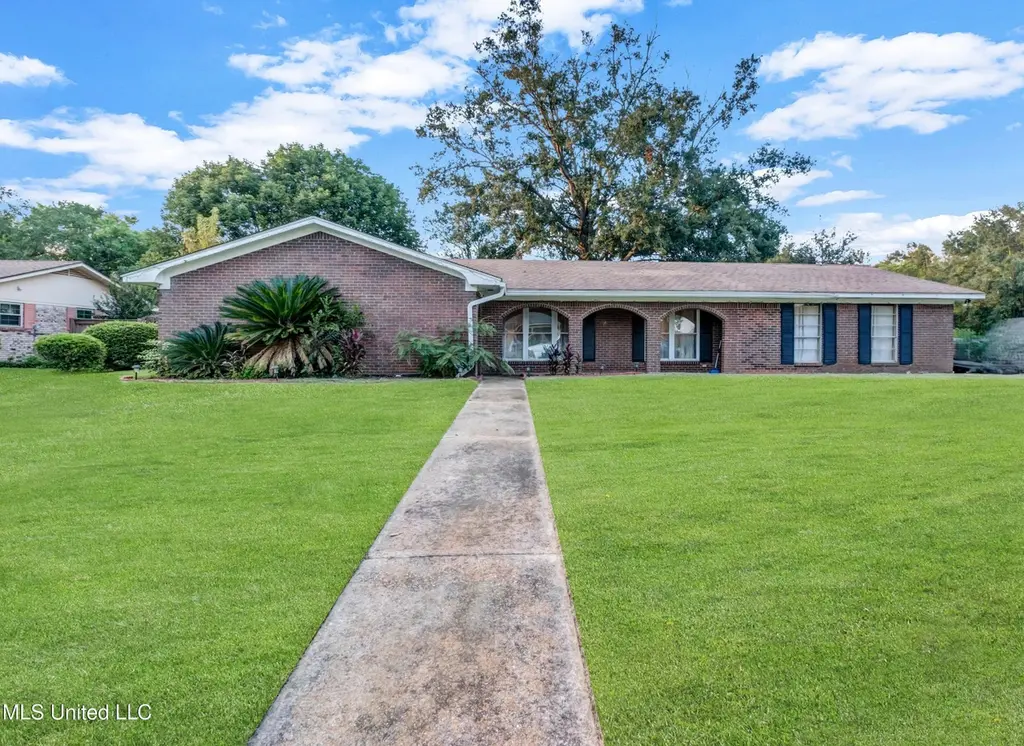
15284 Woody Dr · Gulfport, MS
Flood risk 1/10 · Minimal
- FEMA flood zone
- X (unshaded)
- Chance of flooding over 30 yrs
- 0.0%
- Est. flood insurance / yr
- $507 – $1,088
Fire risk 4/10 · Minor
- Est. fire insurance / yr
- $1,241 – $2,305
Heat risk 10/10 · Severe
- Hot days now (above 107°F)
- 7 days/yr
- Hot days in 30 yrs
- 21 days/yr
Wind risk 9/10 · Severe
- Chance of severe wind over 30 yrs
- 99.0%
Air-quality risk 1/10 · Minimal
- Unhealthy air days now
- 0 days/yr
- Unhealthy air days in 30 yrs
- 0 days/yr
Risk factors via First Street. Map © Google.
Why this score? — see what drove the B+ grade
The composite is a weighted blend of 9 inputs, each scored 0–100. Each bar is that input's sub-score; the figure is the points it added to the 100-point composite (weight × sub-score).
- Cash flow +30.0/30.0
- ARV discount +15.0/15.0
- DSCR +10.0/10.0
- 1% rule +8.6/10.0
- Rent growth +4.2/5.0
- Schools +4.2/10.0
- Livability +3.7/5.0
- Condition / age +2.5/5.0
- Appreciation +0.0/10.0
$145,000
🖨 Deal sheet 📄 Offer letter ✓ Due diligence
Listing remarks
Discover the perfect blend of comfort and functionality in this delightful 4-bedroom, 2-bathroom home, ideally situated for modern family living. Boasting an impressive layout, this residence offers not one, but two distinct living areas, providing versatile spaces for relaxation, entertaining, or even a dedicated home office. The heart of this home is undoubtedly its huge kitchen, a culinary dream featuring ample counter space, abundant cabinetry, and room for all your gourmet aspirations. Whether you're preparing everyday meals or hosting large gatherings, this expansive kitchen can handle it all with ease. Retreat to generously sized bedrooms, including a serene master suite, ensuring co
Key facts
- Huge kitchen
- 0.27 acre lot
- 2 garage spots
Tags
Property features AI
Finance
- HOA & community: Community sidewalks and street lights
Exterior
- Parking: 2-car garage; Driveway
- Utilities: Public water; Public sewer; Electricity connected; Water connected; Sewer connected
- Home design: Single-family house; One level
- Construction: Brick and siding exterior; Architectural shingle roof; Slab foundation; Built in (year built source: public records)
- Exterior features: Private yard; Sidewalks; Street lights
Interior
- Kitchen: Dishwasher, Microwave, Refrigerator
- Flooring: Tile; Wood
- Bathrooms: 2 full bathrooms
- Heating & cooling: Central heating; Central air conditioning; Electric cooling; Ceiling fans
- Interior features: Dishwasher, Microwave, Refrigerator, Water heater; Tile and wood flooring
- Laundry & utility: Water heater
Neighborhood map
What this means for you Summary
Snapshot
- This is a 3-bed/1.0-bath single-family listed at $145k.
Deal economics
- At list price, monthly cash flow is $697 ($8k/yr) — positive.
- The deal already cash-flows at list — no discount required.
- Meets the 1% rule at list price ($2k rent vs $145k).
- Recommended offer: $143k (1.5% below list) — sets the bar for market timing.
- Cap rate 12.1% vs local median 4.9% in Gulfport — top-decile yield for the area; either an underpriced asset or a hidden risk that comps aren't pricing in. Stress-test before assuming the spread holds.
Location & tenants
- Location reads 73/100 on livability (#15 in MS) — a middle-class / working-renter tenant base. Strengths: cost of living A+, housing A+, health & safety A+; Watch: schools D, amenities F, commute F.
- Harrison County School District (rural): math 52% / reading 46% proficiency, ranked #14 of 130 in MS (top 11%) — families likely to look elsewhere, expect single-tenant / working-renter base with shorter leases; 62% free/reduced lunch — lower-income household profile, screen leases tightly.
- Market conditions: Rents rising fast (+7.0%/yr); 763 active listings in the ZIP; 11 comparable units currently listed for rent nearby; rentals lingering (median 44d on market — plan ~5-8 weeks vacancy on turnover, expect pricing pressure); 73% of comp listings sitting > 30 days — soft ceiling on asking rent; 2,194 units permitted in Harrison County in 2024 (0 in 5+ unit buildings).
- This rent runs 38% of the median local income ($63k/yr) — at the standard rent-burdened threshold; future hikes will face affordability resistance.
Forward outlook
- Local home prices are declining (-3.0%/yr); year-one equity from $1k of loan paydown is wiped out by about $4k of value loss. Plan a longer hold.
- Harrison County population projected at +27% by 2050 — long-run rental-demand tailwind backs the buy-and-hold thesis.
- At projected returns (-3.0% appreciation + 7.0% rent growth), your $41k cash investment doubles in ~5 years — after that, you're playing with house money.
Negotiation context
- It's been on market 29 days — a 2% lower offer ($143k) is reasonable based on typical stale-listing flexibility.
- 7 sale attempts since 17y ago with the ask held roughly flat each time — persistent listings suggest the price (not the market) is what's stuck; bring a comps-based counter.
Risks & watch-outs
- Climate carrying-cost: severe wind risk, 99% chance of damaging wind over 30y; extreme-heat days projected 7→21/yr by 2055 (HVAC capex compounding) — expect insurance premiums to compound above CPI over the hold.
Questions for the listing agent
- Built in 1974 — when were the roof, HVAC, electrical panel, plumbing, and water heater last replaced?
- Is there a deadline driving the sale (1031 exchange, divorce, estate, relocation)? That informs how much negotiation room exists.
- Schools are D-rated, which usually means shorter tenancies and higher turnover. Who's the typical renter profile here, and what's been the actual vacancy rate?
- What's the average days-on-market for RENTAL listings here right now (not sales)? A rising rental-DOM trend means longer vacancies and softer asking-rent achievability than the comps imply.
- What's the recent tenant-quality profile in this submarket — average credit score on applications, eviction rate, late-payment / NSF rate, and stable-employment percentage? A property-management company in the area should have these aggregated.
- How much new for-sale + rental construction is in the pipeline within 1–3 miles? Heavy new supply typically softens prices + rents 12–24 months out; constrained supply supports both.
Investment metrics
- 1% rule
- 1.36% ✓
- Cap rate
- 12.06%
- Cash-on-cash
- 20.61%
- DSCR
- 1.92
- GRM
- 6.1
CMA / ARV
- ARV (on-the-fly)
- $243,243
- Comps found
- 12
Show comp detail 12 sales within ~0.75 mi
| Address | Dist | Beds/Ba | Sqft | Sold | Price | $/sf | Match |
|---|---|---|---|---|---|---|---|
| 15387 Woody Dr | 0.15mi | 3/2.0 | 2,044 (-2%) | 14mo | $257,000 | $126 | 75 |
| 13040 Andy Dr | 0.18mi | 4/2.5 (+1) | 1,900 (-9%) | 0mo | $255,000 | $134 | 66 |
| 15397 Woody Dr | 0.16mi | 4/2.0 (+1) | 2,300 (+11%) | 1mo | $255,000 | $111 | 65 |
| 15287 Dogwood Cv | 0.58mi | 3/2.0 | 2,079 (0%) | 14mo | $229,900 | $111 | 58 |
| 15230 Christy Cv | 0.59mi | 3/2.0 | 2,052 (-1%) | 13mo | $240,000 | $117 | 56 |
| 15299 Oakwood Ct | 0.64mi | 3/2.0 | 1,845 (-11%) | 0mo | $215,000 | $117 | 47 |
| 15260 Cindy Cv | 0.73mi | 3/2.0 | 1,982 (-5%) | 10mo | $153,500 | $77 | 46 |
| 15313 Baywood Cir | 0.44mi | 4/2.5 (+1) | 2,325 (+12%) | 6mo | $249,900 | $107 | 44 |
| 12255 Depew Rd | 0.53mi | 4/3.0 (+1) | 2,180 (+5%) | 15mo | $225,000 | $103 | 41 |
| 15465 N Parkwood Dr | 0.49mi | 4/1.5 (+1) | 1,830 (-12%) | 12mo | $190,000 | $104 | 40 |
| 12281 Amanda Way | 0.72mi | 4/2.0 (+1) | 1,820 (-12%) | 4mo | $245,000 | $135 | 34 |
| 15076 Barbara Dr | 0.70mi | 4/3.0 (+1) | 1,947 (-6%) | 15mo | $245,000 | $126 | 31 |
Match score weights: distance 35% · size 25% · config 20% · recency 20%. Top-matched comps best support the ARV.
Projected returns pro-forma
-3.0% appreciation · 6.99% rent growth · sell at horizon
- IRR
- 17.0%
- Equity multiple
- 1.72×
- Total profit
- $29,083
- Equity at exit
- $21,620
- IRR
- 28.0%
- Equity multiple
- 3.93×
- Total profit
- $118,928
- Equity at exit
- $12,537
Cash invested: $40,600 (down + closing). Projections, not guarantees.
Landlord ↔ Tenant lean methodology
- Overall (STATE)
- 90 Strongly Landlord-Friendly
- State Mississippi
- 90 Strongly Landlord-Friendly · R+11
- County
- — inherits STATE
- City
- — inherits STATE
ZIP-level market 39503
- Home prices YoY
- -21.5%
- Rents YoY
- 7.0%
- Active inventory
- 763
- Price-to-rent
- 6.1×
Monthly cashflow live
- Estimated rent
- $1,970 high interval (Pro) →
- Mortgage (P&I)
- −$760
- Tax from tax record
- −$38 /mo · $459/yr
- Insurance
- −$60
- HOA
- −$0
- Vacancy / Maint / Mgmt
- −$414
- Net cashflow
- $697
Break-even live
UW: 25.0% down · 7.5% · 30yr · 1.5% tax · 5.0% vac · 8.0% maint · 8.0% mgmt
Financing live
Cash to close
- Down payment
- $36,250
- Closing costs
- $4,350
- Reserves months
- —
- Total cash needed
- —
Loan-product check · same deal, 3 products live
Conventional
25% down · 7.5% · 30yr
- Down + closing
- —
- Monthly P&I
- —
- Monthly cashflow
- —
- DSCR
- —
- Eligible?
- —
Personal DTI + credit; lowest rate.
DSCR
20% down · 8.5% · 30yr
- Down + closing
- —
- Monthly P&I
- —
- Monthly cashflow
- —
- DSCR
- —
- Eligible?
- —
No personal income docs; deal must DSCR.
Hard money
10% down · 12.0% · 12mo
- Down + closing
- —
- Monthly P&I
- —
- Monthly cashflow
- —
- DSCR
- —
- Eligible?
- —
Short-term bridge; refi at stabilization.
Rent comps 11 comps
| Address | Beds | Baths | Sqft | Rent | $/sqft | DOM | Units | Dist |
|---|---|---|---|---|---|---|---|---|
| 15334 Oak Creek Cv Gulfport, MS | 4.0 | 2.0 | 1730 | $2,149 | $1.24 | 20d | 1 | 0.64mi |
| 15373 Saint Charles St Gulfport, MS | 3.0 | 1.0–3.0 | 1075 | $1,350 | $1.26 | 43d | 2 | 0.97mi |
| 14347 Atwood Cv Gulfport, MS | 4.0 | 2.0 | 2133 | $2,175 | $1.02 | 43d | 1 | 0.98mi |
| 14348 Atwood Cv Gulfport, MS | 3.0 | 2.0 | 2145 | $2,150 | $1.00 | 43d | 1 | 1.01mi |
| 13415 John Clark Rd Gulfport, MS | 3.0 | 2.0 | 2067 | $2,090 | $1.01 | 43d | 1 | 1.18mi |
| 14160 Maple Ct Gulfport, MS | 4.0 | 2.0 | 1950 | $1,895 | $0.97 | 43d | 1 | 1.27mi |
| 11502 Camden Court Cir Gulfport, MS | 3.0 | 2.0 | 1495 | $1,775 | $1.19 | 20d | 1 | 1.34mi |
| 11405 Camden Court Cir Gulfport, MS | 3.0 | 2.0 | 1495 | $1,775 | $1.19 | 43d | 1 | 1.39mi |
| 11487 Camden Court Cir Gulfport, MS | 3.0 | 2.0 | 1495 | $1,775 | $1.19 | 43d | 1 | 1.39mi |
| 11413 Camden Court Cir Gulfport, MS | 3.0 | 2.0 | 1495 | $1,775 | $1.19 | 43d | 1 | 1.39mi |
| 11425 Camden Court Cir Gulfport, MS | 3.0 | 2.0 | 1495 | $1,775 | $1.19 | 20d | 1 | 1.39mi |
Listing history 31 events
-
2026-06-18days on market $145,000 Active 29 DOM
-
2026-06-17days on market $145,000 Active 28 DOM
-
2026-06-16days on market $145,000 Active 27 DOM
-
2026-06-15days on market $145,000 Active 26 DOM
-
2026-06-14days on market $145,000 Active 24 DOM
-
2026-06-13days on market $145,000 Active 23 DOM
-
2026-06-10days on market $145,000 Active 21 DOM
-
2026-06-09days on market $145,000 Active 20 DOM
-
2026-06-08pricedays on market $145,000 Active 19 DOM
-
2026-06-07days on market $150,000 Active 18 DOM
-
2026-06-02days on market $150,000 Active 13 DOM
-
2026-06-01days on market $150,000 Active 12 DOM
-
2026-05-31days on market $150,000 Active 11 DOM
-
2026-05-30days on market $150,000 Active 10 DOM
-
2026-05-20$150,000 Active
-
2025-06-24status Active
-
2025-06-24price $160,000
-
2025-06-11status Pending
-
2025-06-11historical
-
2025-05-31$210,000 Active
-
2021-10-01historical
-
2021-08-13$185,500
-
2016-05-27soldstatus $151,500
-
2016-05-19soldstatus
-
2016-03-27$149,000
-
2015-10-23soldstatus
-
2015-10-21soldstatus
-
2015-09-11$59,900
-
2009-09-18soldstatus
-
2009-09-17soldstatus
-
2009-06-23$139,900
ⓘ Source: listings_history table (triggers on properties + properties_extension) + one-shot
backfill from property_details.listing_events for pre-trigger history.
Tax reassessment forecast MS · Resets to sale price
- Current annual tax
- $459 · $38/mo
- Projected year-2 tax
- $1,146 · $95/mo
- Expected delta
- +$687/yr (+$57/mo · 149.7%)
ⓘ Screening estimate from a state-policy table — verify with the county assessor before closing.
Climate risk First Street
- Flood 1/10 Low FEMA zone X (unshaded) · 0% chance over 30 yrs
- Wildfire 4/10 Moderate
- Heat 10/10 Extreme 7 d/yr ≥107°F today · 21 d/yr by 30 yrs out
- Wind 9/10 Extreme 99% chance of damaging wind over 30 yrs
- Air quality 1/10 Low 0 unhealthy d/yr today · 0 by 30 yrs out
Nearby sold comps map
Loading sold comps map…
Walkable amenities ~0.75 mi
Loading nearby amenities…
Taxation est. · year 1
- Rental income
- $23,641
- − Mortgage interest
- −$8,122
- − Property taxes
- −$459
- − Insurance
- −$725
- − Repairs & maintenance
- −$1,891
- − Management
- −$1,891
- − Depreciation
- −$4,218
- Taxable income
- $6,334
- Est. tax owed @ 24.0%
- −$1,520
- After-tax cash flow
- $6,847/yr
For passive investors: Depreciation is non-cash, so a rental often shows a tax loss while cash-flowing — sheltering income. Rental losses are passive: they offset passive income freely, and up to $25,000/yr can offset ordinary (W-2) income if you actively participate and your MAGI is under $100k (phasing out to $0 by $150k); unused losses carry forward. On sale, claimed depreciation is recaptured at up to 25%, and gains may owe capital-gains tax (a 1031 exchange can defer both). Figures are a year-1 estimate at your 24.0% rate — not tax advice; consult a CPA.
Schools (NCES district)
- District
- Harrison County School District
- NCES district ID
- 2801770
- Math proficiency
- 52% ▼ -4.00%
- Reading proficiency
- 46% ▼ -4.00%
- Median HH income
- $46,504
- Composite
- 41.66/100
- National rank
- #3419
- State rank
- #14 of 130 in MS
Livability — Gulfport
- Score
- 73/100
- State rank
- #15
- US rank
- #5010
Category grades
Schools grade is shown separately in the Schools card above.
Census & demographics
- Census place
- Gulfport, MS
- County
- Harrison County · 178,171 people
- City population
- 96,188
- Metro
- Gulfport-Biloxi, MS
- Population (ZIP)
- 55,059
- Household income
- $62,641
- Rent vs Own
- Severe rent burden
- 1686.0
Population outlook (Harrison County) Hauer SSP2
- Today (2025)
- 228,444 people
- By 2030
- 241,942 · +5.9%
- By 2040
- 267,531 · +17.1%
- By 2050
- 291,062 · +27.4%
- By 2075
- 346,711 · +51.8%
- By 2100
- 378,165 · +65.5%
Race, ethnicity, and origin ACS 2023
- Neighborhood character
- Diverse neighborhood (Simpson 0.58)
- Race & ethnicity
- White 58% Black 27% Two or more races 9% Hispanic / Latino 6% Asian 2%
- Hispanic origin (detail)
- Mexican 2% Puerto Rican 1%
- Common ancestry
- Lithuanian 5% Slovak 1% Portuguese 1%
- Foreign-born
- 3% · Canada
- Languages at home
- 95% English-only · Spanish 3%
Political lean MEDSL · Harrison
- 2024 margin
- Strong R (+28.9) · D 35.0% · R 63.9% · Other 1.1%
- 2008→2024 swing
- -2.9pp toward R · 2008: -26.0pp · 2024: -28.9pp
- All cycles
- 2024: R+28.9 2020: R+25.2 2016: R+30.7 2012: R+26.6 2008: R+26.0
Not yet ingested
- Civics
- —
Market trends
- HPI YoY
- ▼ -51.39%
- Current HPI
- 187.285
- Rent YoY
- ▲ 6.99%
- Metro
- Gulfport-Biloxi, MS
- State GDP YoY
- —
- F500 in state
- 0
Price history
+7.2% since first listed17 events — show timeline
- 2026-05-20 Listed $150,000 MLSU
- 2025-06-24 Relisted — MLSU
- 2025-06-24 Price Changed $160,000 MLSU
- 2025-06-11 Pending — MLSU
- 2025-06-11 Listing Removed — MLSU
- 2025-05-31 Listed $210,000 MLSU
- 2021-10-01 Listing Removed — MLSU
- 2021-08-13 Listed $185,500 MLSU
- 2016-05-27 Sold (Public Records) $151,500 Public Records
- 2016-05-19 Sold (MLS) — MLSU
- 2016-03-27 Listed $149,000 MLSU
- 2015-10-23 Sold (Public Records) — Public Records
- 2015-10-21 Sold (MLS) — MLSU
- 2015-09-11 Listed $59,900 MLSU
- 2009-09-18 Sold (Public Records) — Public Records
- 2009-09-17 Sold (MLS) — MLSU
- 2009-06-23 Listed $139,900 MLSU
Property tax history
-7.0%/yrLatest (2025): $459 · +0.2% YoY. Source: county tax records.
Cash-flow waterfall
monthlySold comps — $/sqft
last 12 mo · ≤1 miLoading sold comps…