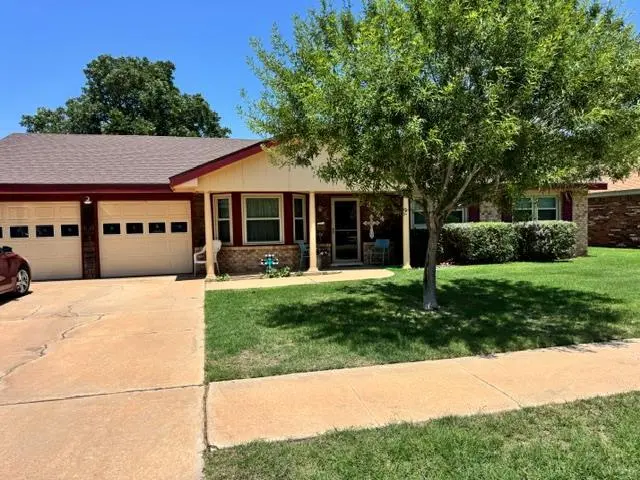
3324 Camarie Ave · Midland, TX
Flood risk 1/10 · Minimal
- FEMA flood zone
- X
- Chance of flooding over 30 yrs
- 0.0%
- Est. flood insurance / yr
- $507 – $1,088
Fire risk 4/10 · Minor
- Est. fire insurance / yr
- $1,222 – $2,270
Heat risk 6/10 · Moderate
- Hot days now (above 102°F)
- 7 days/yr
- Hot days in 30 yrs
- 22 days/yr
Wind risk 2/10 · Minimal
- Chance of severe wind over 30 yrs
- 3.0%
Air-quality risk 1/10 · Minimal
- Unhealthy air days now
- 0 days/yr
- Unhealthy air days in 30 yrs
- 0 days/yr
Risk factors via First Street. Map © Google.
Why this score? — see what drove the D- grade
The composite is a weighted blend of 9 inputs, each scored 0–100. Each bar is that input's sub-score; the figure is the points it added to the 100-point composite (weight × sub-score).
- Cash flow +12.2/30.0
- ARV discount +7.5/15.0
- Livability +4.0/5.0
- DSCR +3.6/10.0
- Rent growth +3.6/5.0
- 1% rule +3.2/10.0
- Schools +3.2/10.0
- Condition / age +2.5/5.0
- Appreciation +0.0/10.0
$275,000
🖨 Deal sheet (PDF) 📄 Offer letter ✓ Due diligence
Listing remarks
Looking for the perfect mix of peace, convenience, and extra space? This gorgeous 3-bedroom, 2-bathroom home is officially ready for its next chapter! Inside, you will find 1,829 square feet of beautifully maintained, completely turnkey living space. The real standout feature is the massive, fully heated and cooled bonus sunroom, which offers endless multi-use possibilities as a bright home office, a dedicated playroom, or a private home gym. The home is situated on a lovely . 17-acre yard located in a quiet, highly desirable neighborhood. Best of all, great schools near.
Key facts
- Bonus sunroom
- Quiet neighborhood
- Great schools near
Tags
Property features AI
Exterior
- Parking: 2-car garage with automatic opener
- Security: Smoke detectors
- Utilities: Public water; Public sewer
- Home design: Single-family residence; Single-story
- Construction: Composition roof; Slab foundation
- Exterior features: Covered porch/patio; Wood fencing
Interior
- Kitchen: Dishwasher; Garbage disposal; Electric water heater
- Bathrooms: Two full bathrooms
- Heating & cooling: Central heating; Central air conditioning; Ceiling fans
- Interior features: Built-in bookcases
Neighborhood map
What this means for you Summary
Snapshot
- This is a 3-bed/2.0-bath single-family listed at $275k.
Deal economics
- At list price, monthly cash flow is $-58 ($-692/yr) — negative.
- To cash-flow at today's rent, offer at most $265k (3.7% below list).
- To meet the 1% rule (rent ≥ 1% of price), the offer needs to be $224k (18.5% below list).
- Recommended offer: $224k (18.5% below list) — sets the bar for 1% rule.
- Cap rate 6.0% vs local median 4.7% in Midland — meaningfully above typical; check what's discounted (condition, days-on-market, listing class) to confirm the premium yield is real.
Location & tenants
- Location reads 79/100 on livability (#57 in TX, #2,192 nationally) — a middle-class / working-renter tenant base. Strengths: employment A+, housing A+, health & safety A+; Watch: crime C-, commute D+, amenities D.
- Midland ISD (urban): math 34% / reading 36% proficiency, ranked #477 of 826 in TX (top 58%) — families likely to look elsewhere, expect single-tenant / working-renter base with shorter leases.
- Zoned schools: Rusk El (math 47% / reading 37%, grade F, #1,335 of 4,322 statewide, top 33%, 413 students, 59% FRL); Abell J H (math 32% / reading 43%, grade F, #736 of 1,662 statewide, top 45%, 1,095 students, 46% FRL); Legacy H S (math 37% / reading 3%, grade F, #1,397 of 1,632 statewide, top 87%, 2,504 students, 41% FRL) — zoned schools at 49% FRL track the district average.
- Market conditions: Rents rising fast (+4.5%/yr); 324 active listings in the ZIP; 40 comparable units currently listed for rent nearby; rentals at typical pace (median 23d on market — plan ~3-4 weeks tenant-placement turnaround); solid renter incomes; 1,504 units permitted in Midland County in 2024 (0 in 5+ unit buildings).
Forward outlook
- Local home prices are declining (-3.0%/yr); year-one equity from $2k of loan paydown is wiped out by about $8k of value loss. Plan a longer hold.
- Midland County population projected at +83% by 2050 — long-run rental-demand tailwind backs the buy-and-hold thesis.
Negotiation context
- Only 9 days on market — expect competitive offers; lowballing is unlikely to land.
Risks & watch-outs
- Climate carrying-cost: extreme-heat days projected 7→22/yr by 2055 (HVAC capex compounding) — expect insurance premiums to compound above CPI over the hold.
Questions for the listing agent
- What do current leases actually rent for vs. the listed asking? Can we see a recent rent roll and the last 12 months of T-12 income?
- Built in 1966 — when were the roof, HVAC, electrical panel, plumbing, and water heater last replaced?
- Is there a deadline driving the sale (1031 exchange, divorce, estate, relocation)? That informs how much negotiation room exists.
- The area grade is low — what's the realistic commute time and amenity access for the typical tenant pool here? Any planned neighborhood developments (good or bad) we should know about?
- What's the average days-on-market for RENTAL listings here right now (not sales)? A rising rental-DOM trend means longer vacancies and softer asking-rent achievability than the comps imply.
- What's the recent tenant-quality profile in this submarket — average credit score on applications, eviction rate, late-payment / NSF rate, and stable-employment percentage? A property-management company in the area should have these aggregated.
- How much new for-sale + rental construction is in the pipeline within 1–3 miles? Heavy new supply typically softens prices + rents 12–24 months out; constrained supply supports both.
Investment metrics
- 1% rule
- 0.82% ✗
- Cap rate
- 6.04%
- Cash-on-cash
- -0.90%
- DSCR
- 0.96
- GRM
- 10.2
CMA / ARV
No comps found within radius.
Projected returns pro-forma
-3.0% appreciation · 4.45% rent growth · sell at horizon
- IRR
- -16.2%
- Equity multiple
- 0.42×
- Total profit
- $-44,928
- Equity at exit
- $41,003
- IRR
- -5.6%
- Equity multiple
- 0.61×
- Total profit
- $-29,871
- Equity at exit
- $23,777
Cash invested: $77,000 (down + closing). Projections, not guarantees.
Landlord ↔ Tenant lean methodology
- Overall (STATE)
- 87 Strongly Landlord-Friendly
- State Texas
- 87 Strongly Landlord-Friendly · R+5
- County
- — inherits STATE
- City
- — inherits STATE
ZIP-level market 79707
- Rents YoY
- 4.5%
- Active inventory
- 324
- Price-to-rent
- 10.2×
Monthly cashflow live
- Estimated rent
- $2,242 high interval (Pro) →
- Mortgage (P&I)
- −$1,442
- Tax from tax record
- −$272 /mo · $3,267/yr
- Insurance
- −$115
- HOA
- −$0
- Vacancy / Maint / Mgmt
- −$471
- Net cashflow
- $-58
Break-even live
Sensitivity live
| Price | -10% $98 | -5% $20 | +0% $-58 | +5% $-136 | +10% $-213 |
|---|---|---|---|---|---|
| Rent | -10% $-235 | -5% $-146 | +0% $-58 | +5% $31 | +10% $119 |
| Rate | -1.0pp $81 | -0.5pp $12 | base $-58 | +0.5pp $-129 | +1.0pp $-201 |
UW: 25.0% down · 7.5% · 30yr · 1.5% tax · 5.0% vac · 8.0% maint · 8.0% mgmt
Financing live
Cash to close
- Down payment
- $68,750
- Closing costs
- $8,250
- Reserves months
- —
- Total cash needed
- —
Loan-product check · same deal, 3 products live
Conventional
25% down · 7.5% · 30yr
- Down + closing
- —
- Monthly P&I
- —
- Monthly cashflow
- —
- DSCR
- —
- Eligible?
- —
Personal DTI + credit; lowest rate.
DSCR
20% down · 8.5% · 30yr
- Down + closing
- —
- Monthly P&I
- —
- Monthly cashflow
- —
- DSCR
- —
- Eligible?
- —
No personal income docs; deal must DSCR.
Hard money
10% down · 12.0% · 12mo
- Down + closing
- —
- Monthly P&I
- —
- Monthly cashflow
- —
- DSCR
- —
- Eligible?
- —
Short-term bridge; refi at stabilization.
Rent comps 40 comps
| Address | Beds | Baths | Sqft | Rent | $/sqft | DOM | Units | Dist |
|---|---|---|---|---|---|---|---|---|
| 3326 W Dengar Ave Midland, TX | 4.0 | 3.0 | 2000 | $2,500 | $1.25 | 23d | 1 | 0.16mi |
| 3302 Fannin Ave Midland, TX | 3.0 | 2.0 | 1533 | $2,000 | $1.30 | 23d | 1 | 0.26mi |
| 3317 Providence Dr Midland, TX | 3.0 | 2.0 | 1810 | $2,500 | $1.38 | 45d | 1 | 0.34mi |
| 3209 W Wadley Ave Unit A Midland, TX | 3.0 | 2.0 | 1512 | $2,500 | $1.65 | 45d | 1 | 0.38mi |
| 3315 Godfrey St Midland, TX | 1.0–3.0 | 1.5–4.0 | 1764 | $2,800 | $1.59 | 15d | 8 | 0.42mi |
| 2603 W Wadley Ave Midland, TX | 3.0 | 2.0 | 1600 | $1,900 | $1.19 | 23d | 1 | 0.80mi |
| 4027 Angelina Dr Midland, TX | 3.0 | 2.0 | 2228 | $2,900 | $1.30 | 15d | 1 | 0.85mi |
| 3600 N Midland Dr Midland, TX | 1.0–2.0 | 1.0–2.0 | 900 | $1,425 | $1.58 | 15d | 9 | 0.87mi |
| 1813 McDonald St Midland, TX | 3.0 | 2.0 | 1680 | $2,249 | $1.34 | 45d | 1 | 0.89mi |
| 3619 Boyd Ave Midland, TX | 3.0 | 2.0 | 1700 | $2,100 | $1.24 | 15d | 1 | 0.93mi |
| 2615 Haynes Ave Unit B Midland, TX | 3.0 | 2.0 | 1635 | $1,950 | $1.19 | 15d | 1 | 0.94mi |
| 3134 Tealwood Pl Midland, TX | 3.0 | 2.0 | 1974 | $2,500 | $1.27 | 23d | 1 | 0.99mi |
| 4419 Fairgate Dr Midland, TX | 2.0 | 2.0 | 1620 | $1,800 | $1.11 | 23d | 1 | 1.00mi |
| 3601 Andrews Hwy Midland, TX | 2.0 | 1.0–2.0 | 800 | $1,615 | $2.02 | 15d | 16 | 1.01mi |
| 3214 Mark Ln Midland, TX | 3.0 | 2.0 | 1836 | $2,550 | $1.39 | 45d | 1 | 1.03mi |
| 1902 N Midland Dr Midland, TX | 1.0–2.0 | 1.0–2.5 | 887 | $1,619 | $1.82 | 15d | 40 | 1.03mi |
| 3417 N Midland Dr Midland, TX | 1.0–3.0 | 1.0–2.0 | 887 | $1,624 | $1.83 | 15d | 13 | 1.03mi |
| 3245 Preston Dr Midland, TX | 3.0 | 2.5 | 1608 | $2,000 | $1.24 | 45d | 1 | 1.11mi |
| 4601 Lanham St #11 Midland, TX | 3.0 | 2.5 | 1420 | $2,500 | $1.76 | 23d | 1 | 1.13mi |
| 4534 Sinclair Ave Midland, TX | 2.0 | 1.0–2.5 | 901 | $1,904 | $2.11 | 23d | 9 | 1.13mi |
| 3208 Elma Dr Midland, TX | 3.0 | 2.5 | 1645 | $2,700 | $1.64 | 45d | 1 | 1.14mi |
| 3900 Douglas Ave Midland, TX | 4.0 | 2.0 | 1961 | $2,800 | $1.43 | 45d | 1 | 1.14mi |
| 4425 Humble Ave Midland, TX | 4.0 | 2.0 | 1466 | $2,250 | $1.53 | 23d | 1 | 1.15mi |
| 4425 Humble Ave Midland, TX | 4.0 | 2.0 | 1466 | $2,150 | $1.47 | 15d | 1 | 1.15mi |
| 2302 Wydewood Dr Midland, TX | 3.0 | 2.0 | 1748 | $2,500 | $1.43 | 45d | 1 | 1.26mi |
| 2404 Goddard Ct Midland, TX | 3.0 | 2.0 | 1894 | $3,100 | $1.64 | 23d | 1 | 1.27mi |
| 2811 West Loop 250 N Midland, TX | 1.0–2.0 | 1.0–2.5 | 967 | $1,396 | $1.44 | 15d | 13 | 1.27mi |
| 4704 Dentcrest Dr Unit A Midland, TX | 2.0 | 2.0 | 1500 | $1,850 | $1.23 | 45d | 1 | 1.28mi |
| 2202 Wydewood Dr Midland, TX | 3.0 | 3.0 | 1854 | $2,700 | $1.46 | 15d | 1 | 1.28mi |
| 4715 W Wadley Ave Midland, TX | 1.0–2.0 | 1.0–2.5 | 872 | $1,514 | $1.74 | 15d | 10 | 1.31mi |
| 2404 Northtown Ct Midland, TX | 3.0 | 2.0 | 1994 | $2,700 | $1.35 | 15d | 1 | 1.31mi |
| 2100 W Wadley Ave Unit L1 Midland, TX | 3.0 | 3.0 | 1854 | $2,300 | $1.24 | 45d | 1 | 1.33mi |
| 4229 Siesta Ln Midland, TX | 2.0 | 1.5 | 1290 | $1,600 | $1.24 | 15d | 1 | 1.33mi |
| 3309 Edgemont Dr Midland, TX | 3.0 | 2.0 | 1600 | $2,995 | $1.87 | 23d | 1 | 1.34mi |
| 4713 Dentcrest Dr Unit A Midland, TX | 2.0 | 2.0 | 1400 | $3,250 | $2.32 | 23d | 1 | 1.34mi |
| 4600 Andrews Hwy Midland, TX | 1.0–3.0 | 1.0–2.0 | 1117 | $2,590 | $2.32 | 45d | 5 | 1.36mi |
| 3306 Oakmont Dr Midland, TX | 3.0 | 2.0 | 1791 | $2,500 | $1.40 | 23d | 1 | 1.36mi |
| 4800 Dentcrest Dr Midland, TX | 2.0 | 2.0 | 1148 | $1,999 | $1.74 | 45d | 1 | 1.36mi |
| 3002 Phillip Pl Midland, TX | 3.0 | 2.0 | 1579 | $2,400 | $1.52 | 45d | 1 | 1.37mi |
| 3705 Dentcrest Dr Midland, TX | 3.0 | 2.0 | 1402 | $1,800 | $1.28 | 15d | 1 | 1.41mi |
Listing history 8 events
-
2026-06-22days on market $275,000 Active 9 DOM
-
2026-06-19days on market $275,000 Active 7 DOM
-
2026-06-18days on market $275,000 Active 6 DOM
-
2026-06-17days on market $275,000 Active 5 DOM
-
2026-06-16days on market $275,000 Active 4 DOM
-
2026-06-15days on market $275,000 Active 3 DOM
-
2026-06-13remarks 578-char remark
-
2026-06-13$275,000 Active 1 DOM
ⓘ Source: listings_history table (triggers on properties + properties_extension) + one-shot
backfill from property_details.listing_events for pre-trigger history.
Tax reassessment forecast TX · Resets to sale price
- Current annual tax
- $3,267 · $272/mo
- Projected year-2 tax
- $5,032 · $419/mo
- Expected delta
- +$1,766/yr (+$147/mo · 54.1%)
ⓘ Screening estimate from a state-policy table — verify with the county assessor before closing.
Climate risk First Street
- Flood 1/10 Low FEMA zone X · 0% chance over 30 yrs
- Wildfire 4/10 Moderate
- Heat 6/10 Major 7 d/yr ≥102°F today · 22 d/yr by 30 yrs out
- Wind 2/10 Low 3% chance of damaging wind over 30 yrs
- Air quality 1/10 Low 0 unhealthy d/yr today · 0 by 30 yrs out
Nearby sold comps map
Loading sold comps map…
Walkable amenities ~0.75 mi
Loading nearby amenities…
Taxation est. · year 1
- Rental income
- $26,905
- − Mortgage interest
- −$15,404
- − Property taxes
- −$3,267
- − Insurance
- −$1,375
- − Repairs & maintenance
- −$2,152
- − Management
- −$2,152
- − Depreciation
- −$8,000
- Taxable loss
- −$5,446
- Est. tax savings @ 24.0%
- +$1,307
- After-tax cash flow
- $615/yr
For passive investors: Depreciation is non-cash, so a rental often shows a tax loss while cash-flowing — sheltering income. Rental losses are passive: they offset passive income freely, and up to $25,000/yr can offset ordinary (W-2) income if you actively participate and your MAGI is under $100k (phasing out to $0 by $150k); unused losses carry forward. On sale, claimed depreciation is recaptured at up to 25%, and gains may owe capital-gains tax (a 1031 exchange can defer both). Figures are a year-1 estimate at your 24.0% rate — not tax advice; consult a CPA.
Schools (NCES district)
- District
- Midland ISD
- NCES district ID
- 4830570
- Math proficiency
- 34% ▼ -7.00%
- Reading proficiency
- 36% ▬ 0.00%
- Median HH income
- $63,457
- Composite
- 31.63/100
- National rank
- #5938
- State rank
- #477 of 826 in TX
Livability — Midland
- Score
- 79/100
- State rank
- #57
- US rank
- #2192
Category grades
Schools grade is shown separately in the Schools card above.
Census & demographics
- Census place
- Midland, TX
- County
- Midland County · 168,494 people
- City population
- 168,494
- Metro
- Midland, TX
- Population (ZIP)
- 40,010
- Household income
- $99,886
- Rent vs Own
- Severe rent burden
- 1919.0
Population outlook (Midland County) Hauer SSP2
- Today (2025)
- 220,895 people
- By 2030
- 253,667 · +14.8%
- By 2040
- 325,498 · +47.4%
- By 2050
- 404,168 · +83.0%
- By 2075
- 609,802 · +176.1%
- By 2100
- 760,172 · +244.1%
Race, ethnicity, and origin ACS 2023
- Neighborhood character
- Diverse neighborhood (Simpson 0.58)
- Race & ethnicity
- White 56% Hispanic / Latino 31% Two or more races 11% Asian 5% Black 4%
- Hispanic origin (detail)
- Mexican 26% Cuban 1%
- Common ancestry
- Slovak 3% Lithuanian 2% Italian 1%
- Foreign-born
- 11% · Canada, China, Philippines
- Languages at home
- 79% English-only · Spanish 14% Other Asian/Pacific 2% Other Indo-European 1%
Political lean MEDSL · Midland
- 2024 margin
- Solid R (+60.5) · D 19.3% · R 79.8%
- 2008→2024 swing
- -3.3pp toward R · 2008: -57.3pp · 2024: -60.5pp
- All cycles
- 2024: R+60.5 2020: R+56.6 2016: R+55.2 2012: R+61.5 2008: R+57.3
Not yet ingested
- Civics
- —
Market trends
- HPI YoY
- ▼ -208.65%
- Current HPI
- 198.7489
- Rent YoY
- ▲ 4.45%
- Metro
- Midland, TX
- State GDP YoY
- ▲ 3.95%
- F500 in state
- 110
Industry mix (Fortune 500 HQ in TX)
| Industry | F500 HQs | Revenue |
|---|---|---|
| Energy | 16 | $1,198B |
|
||
| Technology | 5 | $198B |
|
||
| Engineering / Construction | 4 | $72B |
|
||
| Energy Services | 3 | $60B |
|
||
| Utilities | 3 | $41B |
|
||
| Healthcare | 2 | $330B |
|
||
Price history
2 events — show timeline
- 2026-06-11 Listed $275,000 PBBOR
- 1982-08-25 Sold (Public Records) — Public Records
Property tax history
+1.0%/yrLatest (2025): $3,267 · -6.0% YoY. Source: county tax records.
Cash-flow waterfall
monthlySold comps — $/sqft
last 12 mo · ≤1 miLoading sold comps…