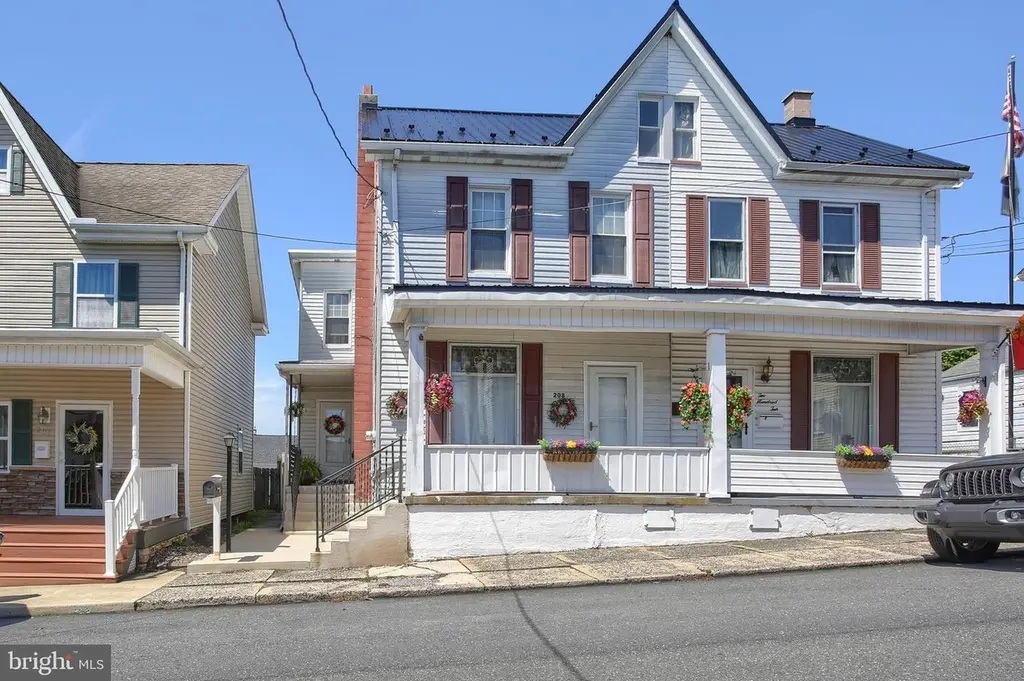
208 East St · Williamstown, PA
Flood risk 1/10 · Minimal
- FEMA flood zone
- X (unshaded)
- Chance of flooding over 30 yrs
- 0.0%
- Est. flood insurance / yr
- $473 – $860
Fire risk 2/10 · Minimal
- Est. fire insurance / yr
- $511 – $949
Heat risk 5/10 · Moderate
- Hot days now (above 94°F)
- 8 days/yr
- Hot days in 30 yrs
- 17 days/yr
Wind risk 3/10 · Minor
- Chance of severe wind over 30 yrs
- 5.0%
Air-quality risk 2/10 · Minimal
- Unhealthy air days now
- 1 days/yr
- Unhealthy air days in 30 yrs
- 2 days/yr
Risk factors via First Street. Map © Google.
Why this score? — see what drove the D- grade
The composite is a weighted blend of 9 inputs, each scored 0–100. Each bar is that input's sub-score; the figure is the points it added to the 100-point composite (weight × sub-score).
- Cash flow +9.4/30.0
- ARV discount +7.5/15.0
- Appreciation +6.2/10.0
- Livability +3.1/5.0
- DSCR +2.6/10.0
- Schools +2.6/10.0
- Rent growth +2.5/5.0
- Condition / age +2.5/5.0
- 1% rule +2.4/10.0
$124,900
🖨 Deal sheet (PDF) 📄 Offer letter ✓ Due diligence
Listing remarks
Here it is!! This beautifully renovated 3-bedroom, 2 story duplex ready for you to stop renting and move right in! The Pillared covered front porch welcomes you into a spacious double living room and/or dining room with open staircase. Large, updated kitchen with appliances, breakfast bar and dining area offers plenty of space for family gatherings. First floor laundry/mudroom leads to the covered deck overlooking the delightful privacy fenced backyard and leads to the garage. Also, boasting a walk-up attic with lots of extra storage and many upgrades…. New roof, new furnace, new flooring/painting, replacement windows and more. Live in this lovely home and pay less than rent!! Come &
Key facts
- Covered front porch
- Double living room
- Renovated duplex
Tags
Property features AI
Exterior
- Parking: Detached rear-entry garage (1 car); On-street parking
- Utilities: Public water; Public sewer
- Home design: Semi-detached home; Stick-built construction; Composite roof; Block foundation; Building not winterized
- Construction: Constructed with stick-built methods; Composite roof; Block foundation; Garage structure present
- Exterior features: Privacy vinyl rear fencing; Deck(s); Porch(es)
Interior
- Kitchen: Dishwasher; Electric oven/range; Refrigerator
- Bedrooms: Three bedrooms on the upper level
- Bathrooms: One full bathroom
- Heating & cooling: Hot water baseboard heating (oil-fired); Window cooling units; 100 Amp electrical service with circuit breakers; Hot water from electric and oil
- Interior features: Attic; Dining area; Eat-in kitchen; Unfinished basement with interior access and outside entrance; Deck(s) and porch(es)
- Laundry & utility: Main-floor laundry
Neighborhood map
What this means for you Summary
Snapshot
- This is a 3-bed/1.0-bath townhouse listed at $125k.
Deal economics
- At list price, monthly cash flow is $-90 ($-1k/yr) — negative.
- To cash-flow at today's rent, offer at most $109k (12.7% below list).
- To meet the 1% rule (rent ≥ 1% of price), the offer needs to be $92k (25.9% below list).
- Recommended offer: $92k (25.9% below list) — sets the bar for 1% rule.
Location & tenants
- Location reads 62/100 on livability (#1,315 in PA) — a middle-class / working-renter tenant base. Strengths: crime A+, cost of living A+, housing A+; Watch: employment D, amenities F, commute F.
- Williams Valley SD (rural): math 16% / reading 44% proficiency, ranked #442 of 539 in PA (top 82%) — families likely to look elsewhere, expect single-tenant / working-renter base with shorter leases.
- Zoned schools: Williams Valley El Sch (math 17% / reading 45%, grade F, #1,116 of 1,518 statewide, top 74%, 521 students, 100% FRL); Williams Valley Jshs (math 17% / reading 42%, grade F, #349 of 437 statewide, top 81%, 440 students, 98% FRL) — zoned schools average 99% FRL vs 40% district-wide (59 pts higher); higher-poverty schools than district average — tighter screening recommended.
- Market conditions: 12 active listings in the ZIP; 1 comparable units currently listed for rent nearby; 540 units permitted in Dauphin County in 2024 (194 in 5+ unit buildings).
Forward outlook
- In year one you build about $4k of equity ($864 loan paydown + $3k appreciation (2.5% local appreciation)).
- By year 9, paydown + projected appreciation supports a ~$34k cash-out refi (75% LTV) — recoverable capital for the next deal without selling this one.
Negotiation context
- Only 2 days on market — expect competitive offers; lowballing is unlikely to land.
- 2 sale attempts since 12y ago with the ask held roughly flat each time — persistent listings suggest the price (not the market) is what's stuck; bring a comps-based counter.
- Current owner paid $50k; list at $125k implies a 150% gain — meaningful room to come down on a strong offer.
Risks & watch-outs
- Watch-outs: built in 1908 — expect roof / HVAC / electrical / plumbing capex.
- Climate carrying-cost: extreme-heat days projected 8→17/yr by 2055 (HVAC capex compounding) — expect insurance premiums to compound above CPI over the hold.
Questions for the listing agent
- What do current leases actually rent for vs. the listed asking? Can we see a recent rent roll and the last 12 months of T-12 income?
- Built in 1908 — when were the roof, HVAC, electrical panel, plumbing, and water heater last replaced?
- Is there a deadline driving the sale (1031 exchange, divorce, estate, relocation)? That informs how much negotiation room exists.
- Schools are F-rated, which usually means shorter tenancies and higher turnover. Who's the typical renter profile here, and what's been the actual vacancy rate?
- The area grade is low — what's the realistic commute time and amenity access for the typical tenant pool here? Any planned neighborhood developments (good or bad) we should know about?
- What's the average days-on-market for RENTAL listings here right now (not sales)? A rising rental-DOM trend means longer vacancies and softer asking-rent achievability than the comps imply.
- What's the recent tenant-quality profile in this submarket — average credit score on applications, eviction rate, late-payment / NSF rate, and stable-employment percentage? A property-management company in the area should have these aggregated.
- How much new for-sale + rental construction is in the pipeline within 1–3 miles? Heavy new supply typically softens prices + rents 12–24 months out; constrained supply supports both.
Investment metrics
- 1% rule
- 0.74% ✗
- Cap rate
- 5.43%
- Cash-on-cash
- -3.08%
- DSCR
- 0.86
- GRM
- 11.3
CMA / ARV
- ARV (on-the-fly)
- $39,933
- Comps found
- 3
Show comp detail 3 sales within ~0.75 mi
| Address | Dist | Beds/Ba | Sqft | Sold | Price | $/sf | Match |
|---|---|---|---|---|---|---|---|
| 117 W Broad St | 0.08mi | 3/1.0 | 1,594 (+8%) | 19mo | $35,000 | $22 | 68 |
| 248 E Market St | 0.25mi | 3/1.0 | 1,698 (+15%) | 4mo | $125,000 | $74 | 60 |
| 115 W Broad St | 0.08mi | 3/1.0 | 1,661 (+12%) | 19mo | $45,000 | $27 | 60 |
Match score weights: distance 35% · size 25% · config 20% · recency 20%. Top-matched comps best support the ARV.
Projected returns pro-forma
2.49% appreciation · 3.0% rent growth · sell at horizon
- IRR
- 3.1%
- Equity multiple
- 1.17×
- Total profit
- $5,984
- Equity at exit
- $52,610
- IRR
- 6.7%
- Equity multiple
- 1.96×
- Total profit
- $33,549
- Equity at exit
- $78,418
Cash invested: $34,972 (down + closing). Projections, not guarantees.
Landlord ↔ Tenant lean methodology
- Overall (STATE)
- 62 Landlord-Friendly
- State Pennsylvania
- 62 Landlord-Friendly · EVEN
- County
- — inherits STATE
- City
- — inherits STATE
ZIP-level market 17098
- Home prices YoY
- 1.2%
- Active inventory
- 12
- Price-to-rent
- 11.3×
Monthly cashflow live
- Estimated rent
- $925 medium interval (Pro) →
- Mortgage (P&I)
- −$655
- Tax from tax record
- −$113 /mo · $1,361/yr
- Insurance
- −$52
- HOA
- −$0
- Vacancy / Maint / Mgmt
- −$194
- Net cashflow
- $-90
Break-even live
Sensitivity live
| Price | -10% $-19 | -5% $-54 | +0% $-90 | +5% $-125 | +10% $-160 |
|---|---|---|---|---|---|
| Rent | -10% $-163 | -5% $-126 | +0% $-90 | +5% $-53 | +10% $-17 |
| Rate | -1.0pp $-27 | -0.5pp $-58 | base $-90 | +0.5pp $-122 | +1.0pp $-155 |
UW: 25.0% down · 7.5% · 30yr · 1.5% tax · 5.0% vac · 8.0% maint · 8.0% mgmt
Financing live
Cash to close
- Down payment
- $31,225
- Closing costs
- $3,747
- Reserves months
- —
- Total cash needed
- —
Loan-product check · same deal, 3 products live
Conventional
25% down · 7.5% · 30yr
- Down + closing
- —
- Monthly P&I
- —
- Monthly cashflow
- —
- DSCR
- —
- Eligible?
- —
Personal DTI + credit; lowest rate.
DSCR
20% down · 8.5% · 30yr
- Down + closing
- —
- Monthly P&I
- —
- Monthly cashflow
- —
- DSCR
- —
- Eligible?
- —
No personal income docs; deal must DSCR.
Hard money
10% down · 12.0% · 12mo
- Down + closing
- —
- Monthly P&I
- —
- Monthly cashflow
- —
- DSCR
- —
- Eligible?
- —
Short-term bridge; refi at stabilization.
Rent comps 1 comps
| Address | Beds | Baths | Sqft | Rent | $/sqft | DOM | Units | Dist |
|---|---|---|---|---|---|---|---|---|
| 140 E Market St Apt 4 Williamstown, PA | 2.0 | 1.0 | 1000 | $925 | $0.93 | 25d | 1 | 0.17mi |
Listing history 6 events
-
2026-05-13status Pending
-
2026-05-11$124,900 Active
-
2014-12-31historical
-
2014-06-19$59,900
-
2004-09-21soldstatus $50,000
-
1992-07-20soldstatus $19,000
ⓘ Source: listings_history table (triggers on properties + properties_extension) + one-shot
backfill from property_details.listing_events for pre-trigger history.
Tax reassessment forecast PA · Partial reset (capped growth)
- Current annual tax
- $1,361 · $113/mo
- Projected year-2 tax
- $1,667 · $139/mo
- Expected delta
- +$306/yr (+$26/mo · 22.5%)
ⓘ Screening estimate from a state-policy table — verify with the county assessor before closing.
Climate risk First Street
- Flood 1/10 Low FEMA zone X (unshaded) · 0% chance over 30 yrs
- Wildfire 2/10 Low
- Heat 5/10 Major 8 d/yr ≥94°F today · 17 d/yr by 30 yrs out
- Wind 3/10 Moderate 5% chance of damaging wind over 30 yrs
- Air quality 2/10 Low 1 unhealthy d/yr today · 2 by 30 yrs out
Nearby sold comps map
Loading sold comps map…
Walkable amenities ~0.75 mi
Loading nearby amenities…
Taxation est. · year 1
- Rental income
- $11,100
- − Mortgage interest
- −$6,996
- − Property taxes
- −$1,361
- − Insurance
- −$624
- − Repairs & maintenance
- −$888
- − Management
- −$888
- − Depreciation
- −$3,633
- Taxable loss
- −$3,291
- Est. tax savings @ 24.0%
- +$790
- After-tax cash flow
- $-286/yr
For passive investors: Depreciation is non-cash, so a rental often shows a tax loss while cash-flowing — sheltering income. Rental losses are passive: they offset passive income freely, and up to $25,000/yr can offset ordinary (W-2) income if you actively participate and your MAGI is under $100k (phasing out to $0 by $150k); unused losses carry forward. On sale, claimed depreciation is recaptured at up to 25%, and gains may owe capital-gains tax (a 1031 exchange can defer both). Figures are a year-1 estimate at your 24.0% rate — not tax advice; consult a CPA.
Schools (NCES district)
- District
- Williams Valley SD
- NCES district ID
- 4226400
- Math proficiency
- 16% ▼ -11.00%
- Reading proficiency
- 44% ▼ -7.00%
- Median HH income
- $47,317
- Composite
- 25.84/100
- National rank
- #7354
- State rank
- #442 of 539 in PA
Livability — Williamstown
- Score
- 62/100
- State rank
- #1315
- US rank
- #16222
Category grades
Schools grade is shown separately in the Schools card above.
Census & demographics
- Census place
- Williamstown, PA
- Population (ZIP)
- 2,521
Population outlook (Dauphin County) Hauer SSP2
- Today (2025)
- 281,628 people
- By 2030
- 283,549 · +0.7%
- By 2040
- 285,385 · +1.3%
- By 2050
- 286,188 · +1.6%
- By 2075
- 291,053 · +3.3%
- By 2100
- 282,374 · +0.3%
Race, ethnicity, and origin ACS 2023
- Neighborhood character
- Predominantly White (86%)
- Race & ethnicity
- White 86% Hispanic / Latino 7% Black 4% Two or more races 4%
- Hispanic origin (detail)
- Puerto Rican 6%
- Common ancestry
- Polish 3% Lithuanian 2% Romanian 2%
- Foreign-born
- 0%
- Languages at home
- 95% English-only · Spanish 4%
Political lean MEDSL · Dauphin
- 2024 margin
- Lean D (+5.9) · D 52.4% · R 46.5% · Other 1.1%
- 2008→2024 swing
- -3.1pp toward R · 2008: 9.1pp · 2024: 5.9pp
- All cycles
- 2024: D+5.9 2020: D+8.5 2016: D+2.8 2012: D+6.0 2008: D+9.1
Not yet ingested
- Civics
- —
Market trends
- HPI YoY
- ▲ 2.49%
- Current HPI
- 210.0318
- Rent YoY
- —
- Metro
- —
- State GDP YoY
- ▲ 1.68%
- F500 in state
- 34
Industry mix (Fortune 500 HQ in PA)
| Industry | F500 HQs | Revenue |
|---|---|---|
| Healthcare | 2 | $309B |
|
||
| Insurance | 2 | $27B |
|
||
| Telecommunications / Media | 1 | $124B |
|
||
| Industrial Distribution | 1 | $22B |
|
||
| Financial Services | 1 | $20B |
|
||
| Chemicals / Materials | 1 | $18B |
|
||
Price history
+557.4% since first listed6 events — show timeline
- 2026-05-13 Pending — BRIGHT MLS
- 2026-05-11 Listed $124,900 BRIGHT MLS
- 2014-12-31 Listing Removed — BRIGHT MLS
- 2014-06-19 Listed $59,900 BRIGHT MLS
- 2004-09-21 Sold (Public Records) $50,000 Public Records
- 1992-07-20 Sold (Public Records) $19,000 Public Records
Property tax history
+2.5%/yrLatest (2026): $1,361 · +5.1% YoY. Source: county tax records.
Cash-flow waterfall
monthlySold comps — $/sqft
last 12 mo · ≤1 miLoading sold comps…