1402 Piikoi St #502 · Urban Honolulu, HI
Flood risk 1/10 · Minimal
- FEMA flood zone
- X (unshaded)
- Chance of flooding over 30 yrs
- 0.0%
- Est. flood insurance / yr
- $507 – $1,088
Fire risk No data
- Est. fire insurance / yr
- —
Heat risk No data
- Hot days now (above threshold)
- —
- Hot days in 30 yrs
- —
Wind risk No data
- Chance of severe wind over 30 yrs
- —
Air-quality risk 1/10 · Minimal
- Unhealthy air days now
- —
- Unhealthy air days in 30 yrs
- —
Risk factors via First Street. Map © Google.
Why this score? — see what drove the C- grade
The composite is a weighted blend of 9 inputs, each scored 0–100. Each bar is that input's sub-score; the figure is the points it added to the 100-point composite (weight × sub-score).
- Cash flow +14.8/30.0
- ARV discount +7.5/15.0
- Appreciation +6.4/10.0
- 1% rule +4.5/10.0
- DSCR +4.5/10.0
- Rent growth +3.8/5.0
- Schools +3.7/10.0
- Livability +2.5/5.0
- Condition / age +2.5/5.0
$355,000
🖨 Deal sheet (PDF) 📄 Offer letter ✓ Due diligence
Listing remarks MLS
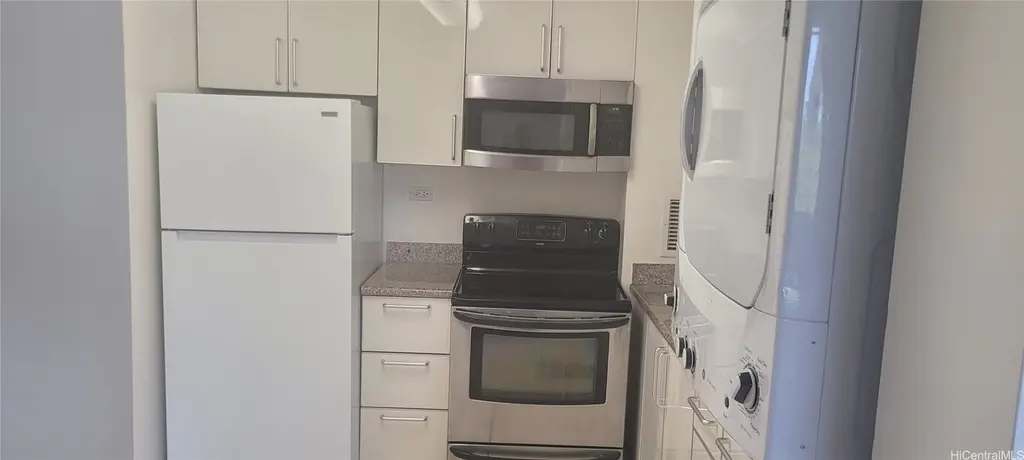
Priced for a quick sale! Great starter unit or Investment Opportunity in TOWN! Convenient location plus this pet friendly condo has only 4 units per floor! Stop by this Secured, Corner End Unit, with 2 bedrooms 1 bath and 1 covered parking. Located on the cool side of building offers modern custom cabinets, ceiling fans throughout, double paned windows, split A/C and a long lanai. Lower maintenance fees, walking distance to Elementary, Middle and 2 High School (Roosevelt ands McKinley HS), lots of stores & restaurants, UH & ala Moana shopping center. In close proximity to bus transportation and freeway access.
Key facts
- $455 HOA
- Parking
- Built 1969
Neighborhood map
What this means for you Summary
Snapshot
- This is a 2-bed/1.0-bath condo listed at $355k.
Deal economics
- At list price, monthly cash flow is $98 ($1k/yr) — positive.
- The deal already cash-flows at list — no discount required.
- To meet the 1% rule (rent ≥ 1% of price), the offer needs to be $337k (5.0% below list).
- Recommended offer: $323k (9.0% below list) — sets the bar for market timing.
- Cap rate 6.6% vs local median 1.5% in Urban Honolulu — top-decile yield for the area; either an underpriced asset or a hidden risk that comps aren't pricing in. Stress-test before assuming the spread holds.
Location & tenants
- Location reads: area grade C — affects rentability + tenant quality, not the cash-flow math above.
- Hawaii Department Of Education (suburban): math 32% / reading 50% proficiency, ranked #1 of 1 in HI (top 100%) — families likely to look elsewhere, expect single-tenant / working-renter base with shorter leases.
- Market conditions: Rents rising fast (+5.3%/yr); 182 active listings in the ZIP; 40 comparable units currently listed for rent nearby; rentals at typical pace (median 18d on market — plan ~3-4 weeks tenant-placement turnaround); solid renter incomes; 1,638 units permitted in Honolulu County in 2024 (793 in 5+ unit buildings).
- This rent runs 42% of the median local income ($96k/yr) — at the standard rent-burdened threshold; future hikes will face affordability resistance.
Forward outlook
- In year one you build about $12k of equity ($2k loan paydown + $10k appreciation (2.7% local appreciation)).
- Honolulu County population projected at +17% by 2050 — long-run rental-demand tailwind backs the buy-and-hold thesis.
- At projected returns (2.7% appreciation + 5.3% rent growth), your $99k cash investment doubles in ~6 years — after that, you're playing with house money.
- By year 3, paydown + projected appreciation supports a ~$30k cash-out refi (75% LTV) — recoverable capital for the next deal without selling this one.
Negotiation context
- It's been on market 103 days — a 9% lower offer ($323k) is reasonable based on typical stale-listing flexibility.
- 4 sale attempts since 18y ago with the ask held roughly flat each time — persistent listings suggest the price (not the market) is what's stuck; bring a comps-based counter.
Questions for the listing agent
- It's been on market 103 days. Have you received any prior offers? Is the seller open to a 9% concession, seller financing, or rate buy-down credit?
- Built in 1969 — when were the roof, HVAC, electrical panel, plumbing, and water heater last replaced?
- What does the HOA fee cover, when was the last increase, and are there any pending special assessments or reserve-fund shortfalls?
- Any open or pending special assessments — roof, HVAC, plumbing, elevator, façade? What's the per-unit balance and payoff schedule, and is the seller paying it off at close or rolling it to the buyer?
- Why hasn't it sold? Are there any deal-killer items the seller is aware of (foundation, flood, title, zoning, code violations)?
- Is there a deadline driving the sale (1031 exchange, divorce, estate, relocation)? That informs how much negotiation room exists.
- What's the average days-on-market for RENTAL listings here right now (not sales)? A rising rental-DOM trend means longer vacancies and softer asking-rent achievability than the comps imply.
- What's the recent tenant-quality profile in this submarket — average credit score on applications, eviction rate, late-payment / NSF rate, and stable-employment percentage? A property-management company in the area should have these aggregated.
- How much new apartment / multifamily construction is in the pipeline within 1–3 miles? Heavy new supply (>2% of stock underway) typically softens rents 12–24 months out; light construction supports rent growth.
Investment metrics
- 1% rule
- 0.95% ✗
- Cap rate
- 6.63%
- Cash-on-cash
- 1.19%
- DSCR
- 1.05
- GRM
- 8.8
CMA / ARV
No comps found within radius.
Projected returns pro-forma
2.71% appreciation · 5.35% rent growth · sell at horizon
- IRR
- 9.1%
- Equity multiple
- 1.52×
- Total profit
- $51,877
- Equity at exit
- $153,843
- IRR
- 13.0%
- Equity multiple
- 2.97×
- Total profit
- $196,150
- Equity at exit
- $232,690
Cash invested: $99,400 (down + closing). Projections, not guarantees.
Landlord ↔ Tenant lean methodology
- Overall (STATE)
- 37 Tenant-Leaning
- State Hawaii
- 37 Tenant-Leaning · D+13
- County
- — inherits STATE
- City
- — inherits STATE
ZIP-level market 96822
- Home prices YoY
- 1.0%
- Rents YoY
- 5.3%
- Active inventory
- 182
- Price-to-rent
- 8.8×
Monthly cashflow live
- Estimated rent
- $3,373 high interval (Pro) →
- Mortgage (P&I)
- −$1,862
- Tax from tax record
- −$102 /mo · $1,220/yr
- Insurance
- −$148
- HOA
- −$455
- Vacancy / Maint / Mgmt
- −$708
- Net cashflow
- $98
Break-even live
Sensitivity live
| Price | -10% $299 | -5% $199 | +0% $98 | +5% $-2 | +10% $-103 |
|---|---|---|---|---|---|
| Rent | -10% $-168 | -5% $-35 | +0% $98 | +5% $232 | +10% $365 |
| Rate | -1.0pp $277 | -0.5pp $189 | base $98 | +0.5pp $6 | +1.0pp $-87 |
UW: 25.0% down · 7.5% · 30yr · 1.5% tax · 5.0% vac · 8.0% maint · 8.0% mgmt
Financing live
Cash to close
- Down payment
- $88,750
- Closing costs
- $10,650
- Reserves months
- —
- Total cash needed
- —
Loan-product check · same deal, 3 products live
Conventional
25% down · 7.5% · 30yr
- Down + closing
- —
- Monthly P&I
- —
- Monthly cashflow
- —
- DSCR
- —
- Eligible?
- —
Personal DTI + credit; lowest rate.
DSCR
20% down · 8.5% · 30yr
- Down + closing
- —
- Monthly P&I
- —
- Monthly cashflow
- —
- DSCR
- —
- Eligible?
- —
No personal income docs; deal must DSCR.
Hard money
10% down · 12.0% · 12mo
- Down + closing
- —
- Monthly P&I
- —
- Monthly cashflow
- —
- DSCR
- —
- Eligible?
- —
Short-term bridge; refi at stabilization.
Rent comps 40 comps
| Address | Beds | Baths | Sqft | Rent | $/sqft | DOM | Units | Dist |
|---|---|---|---|---|---|---|---|---|
| 1535 Pensacola St #209 Honolulu, HI | 1.0 | 1.0 | 493 | $2,700 | $5.48 | 3d | 1 | 0.15mi |
| 1568 Pensacola St Honolulu, HI | 1.0–2.0 | 1.0 | 523 | $2,735 | $5.23 | 24d | 1 | 0.21mi |
| 1315 Liona St Honolulu, HI | 1.0 | 1.0 | 606 | $3,950 | $6.52 | 21d | 1 | 0.39mi |
| 1717 Mott-Smith Dr #2403 Honolulu, HI | 1.0 | 1.0 | 644 | $2,700 | $4.19 | 24d | 1 | 0.43mi |
| 1314 Kalakaua Ave Honolulu, HI | 2.0 | 1.0–2.0 | 773 | $4,675 | $6.04 | 24d | 3 | 0.47mi |
| 1515 Liona St #4407 Honolulu, HI | 1.0 | 1.0 | 606 | $3,750 | $6.19 | 4d | 1 | 0.49mi |
| 1500 Rycroft St Unit 2304 Honolulu, HI | 1.0 | 1.0 | 569 | $3,200 | $5.62 | 24d | 1 | 0.54mi |
| 1500 Rycroft St Unit 3005R Honolulu, HI | 1.0 | 1.0 | 523 | $3,200 | $6.12 | 21d | 1 | 0.54mi |
| 1500 Rycroft St Unit 2607R Honolulu, HI | 1.0 | 1.0 | 618 | $3,500 | $5.66 | 24d | 1 | 0.54mi |
| 1500 Rycroft St Honolulu, HI | 1.0 | 1.0 | 523 | $3,200 | $6.12 | 18d | 1 | 0.54mi |
| 1500 Rycroft St Unit 1904 Honolulu, HI | 1.0 | 1.0 | 564 | $3,400 | $6.03 | 18d | 1 | 0.54mi |
| 1500 Rycroft St Unit 3903 Honolulu, HI | 1.0 | 1.0 | 571 | $3,750 | $6.57 | 24d | 1 | 0.54mi |
| 1500 Rycroft St Unit 2306R Honolulu, HI | 1.0 | 1.0 | 563 | $4,000 | $7.10 | 44d | 1 | 0.54mi |
| 1296 Kapiolani Blvd Honolulu, HI | 1.0–3.0 | 1.0–2.0 | 974 | $3,550 | $3.64 | 15d | 2 | 0.64mi |
| 629 Keeaumoku St Honolulu, HI | 1.0–2.0 | 1.0–2.0 | 923 | $6,300 | $6.82 | 18d | 2 | 0.68mi |
| 629 Keeaumoku St Honolulu, HI | 1.0–2.0 | 1.0–2.0 | 919 | $6,300 | $6.86 | 44d | 2 | 0.68mi |
| 629 Keeaumoku St Honolulu, HI | 1.0 | 1.0 | 618 | $3,350 | $5.42 | 3d | 2 | 0.68mi |
| 801 S King St Honolulu, HI | 1.0 | 1.0 | 671 | $2,895 | $4.31 | 18d | 1 | 0.68mi |
| 1388 Kapiolani Blvd Unit 3910 Honolulu, HI | 1.0 | 1.0 | 619 | $4,000 | $6.46 | 4d | 1 | 0.68mi |
| 1388 Kapiolani Blvd #4205 Honolulu, HI | 1.0 | 1.0 | 567 | $4,500 | $7.94 | 44d | 1 | 0.68mi |
| 1388 Kapiolani Blvd #2903 Honolulu, HI | 1.0 | 1.0 | 574 | $3,500 | $6.10 | 11d | 1 | 0.68mi |
| 1388 Kapiolani Blvd #2703 Honolulu, HI | 1.0 | 1.0 | 574 | $3,500 | $6.10 | 24d | 1 | 0.68mi |
| 1391 Kapiolani Blvd Honolulu, HI | 1.0–3.0 | 1.0–2.0 | 971 | $4,750 | $4.89 | 4d | 2 | 0.73mi |
| 888 Kapiolani Blvd Honolulu, HI | 1.0–3.0 | 1.0–3.0 | 1162 | $6,750 | $5.81 | 4d | 4 | 0.75mi |
| 1009 Kapiolani Blvd Honolulu, HI | 2.0 | 2.0 | 745 | $3,400 | $4.56 | 24d | 2 | 0.79mi |
| 1009 Kapiolani Blvd Honolulu, HI | 2.0 | 2.0 | 730 | $3,198 | $4.38 | 2d | 2 | 0.79mi |
| 909 Kapiolani Blvd Honolulu, HI | 1.0–2.0 | 1.0–2.0 | 790 | $3,600 | $4.55 | 4d | 2 | 0.79mi |
| 1401 Lusitana St #504 Honolulu, HI | 1.0 | 1.0 | 527 | $2,700 | $5.12 | 24d | 1 | 0.80mi |
| 1133 Waimanu St #1808 Honolulu, HI | 1.0 | 1.0 | 556 | $2,800 | $5.04 | 12d | 1 | 0.85mi |
| 1133 Waimanu St #405 Honolulu, HI | 1.0 | 1.0 | 550 | $2,700 | $4.91 | 4d | 1 | 0.85mi |
| 1655 Makaloa St #1510 Honolulu, HI | 1.0 | 1.0 | 500 | $2,600 | $5.20 | 22d | 1 | 0.85mi |
| 987 Queen St Honolulu, HI | 1.0 | 1.0 | 606 | $3,975 | $6.56 | 44d | 2 | 0.91mi |
| 987 Queen St Honolulu, HI | 2.0 | 1.0–2.0 | 554 | $5,200 | $9.39 | 18d | 9 | 0.91mi |
| 987 Queen St Honolulu, HI | 1.0 | 1.0 | 453 | $3,800 | $8.39 | 11d | 9 | 0.91mi |
| 987 Queen St Honolulu, HI | 2.0 | 1.0–2.0 | 554 | $5,200 | $9.39 | 17d | 8 | 0.91mi |
| 1108 Auahi St Honolulu, HI | 3.0 | 1.0–3.5 | 1444 | $12,133 | $8.40 | 44d | 2 | 0.98mi |
| 1108 Auahi St Honolulu, HI | 3.0 | 1.0–3.5 | 1441 | $12,133 | $8.42 | 24d | 1 | 0.98mi |
| 988 Halekauwila St Unit Ke Kilohana Honolulu, HI | 2.0 | 2.0 | 739 | $3,700 | $5.01 | 11d | 1 | 0.99mi |
| 988 Halekauwila St Honolulu, HI | 1.0 | 1.0 | 511 | $2,700 | $5.28 | 4d | 1 | 0.99mi |
| 988 Halekauwila St #906 Honolulu, HI | 2.0 | 2.0 | 744 | $3,500 | $4.70 | 12d | 1 | 0.99mi |
HOA detail condo
- Monthly dues
- $455 · $5,460/yr
- Assessments
- None detected in remarks — confirm with the listing agent.
Listing history 8 events
-
2026-02-09$355,000 Active 629-char remark
Show marketing remark (629 chars)
Priced for a quick sale! Great starter unit or Investment Opportunity in TOWN! Convenient location plus this pet friendly condo has only 4 units per floor! Stop by this Secured, Corner End Unit, with 2 bedrooms 1 bath and 1 covered parking. Located on the cool side of building offers modern custom cabinets, ceiling fans throughout, double paned windows, split A/C and a long lanai. Lower maintenance fees, walking distance to Elementary, Middle and 2 High School (Roosevelt ands McKinley HS), lots of stores & restaurants, UH & ala Moana shopping center. In close proximity to bus transportation and freeway access.
-
2025-11-30historical
-
2025-11-11price $372,000
-
2025-06-04$380,000 Active
-
2019-08-28soldstatus $325,000 Sold
-
2019-07-03$325,000 Active
-
2009-01-12soldstatus $310,000
-
2008-12-13$310,000
ⓘ Source: listings_history table (triggers on properties + properties_extension) + one-shot
backfill from property_details.listing_events for pre-trigger history.
Tax reassessment forecast HI · Partial reset (capped growth)
- Current annual tax
- $1,220 · $102/mo
- Projected year-2 tax
- $1,220 · $102/mo
- Expected delta
- $0/yr ($0/mo · 0.0%)
ⓘ Screening estimate from a state-policy table — verify with the county assessor before closing.
Climate risk First Street
- Flood 1/10 Low FEMA zone X (unshaded) · 0% chance over 30 yrs
- Air quality 1/10 Low
Nearby sold comps map
Loading sold comps map…
Walkable amenities ~0.75 mi
Loading nearby amenities…
Taxation est. · year 1
- Rental income
- $40,475
- − Mortgage interest
- −$19,886
- − Property taxes
- −$1,220
- − Insurance
- −$1,775
- − Repairs & maintenance
- −$3,238
- − Management
- −$3,238
- − HOA
- −$5,460
- − Depreciation
- −$10,327
- Taxable loss
- −$4,669
- Est. tax savings @ 24.0%
- +$1,121
- After-tax cash flow
- $2,301/yr
For passive investors: Depreciation is non-cash, so a rental often shows a tax loss while cash-flowing — sheltering income. Rental losses are passive: they offset passive income freely, and up to $25,000/yr can offset ordinary (W-2) income if you actively participate and your MAGI is under $100k (phasing out to $0 by $150k); unused losses carry forward. On sale, claimed depreciation is recaptured at up to 25%, and gains may owe capital-gains tax (a 1031 exchange can defer both). Figures are a year-1 estimate at your 24.0% rate — not tax advice; consult a CPA.
Schools (NCES district)
- District
- Hawaii Department Of Education
- NCES district ID
- 1500030
- Math proficiency
- 32% ▼ -10.00%
- Reading proficiency
- 50% ▼ -3.00%
- Median HH income
- $69,005
- Composite
- 37.07/100
- National rank
- #4504
- State rank
- #1 of 1 in HI
Livability — Urban Honolulu
No livability data for this city. (Only ~50 U.S. cities are tracked.)
Census & demographics
- Census place
- Urban Honolulu, HI
- County
- Honolulu County · 963,448 people
- City population
- 309,956
- Metro
- Urban Honolulu, HI
- Population (ZIP)
- 43,747
- Household income
- $95,947
- Rent vs Own
- Severe rent burden
- 2139.0
Population outlook (Honolulu County) Hauer SSP2
- Today (2025)
- 1,072,641 people
- By 2030
- 1,110,460 · +3.5%
- By 2040
- 1,181,593 · +10.2%
- By 2050
- 1,257,584 · +17.2%
- By 2075
- 1,501,120 · +39.9%
- By 2100
- 1,764,430 · +64.5%
Race, ethnicity, and origin ACS 2023
- Neighborhood character
- Highly diverse neighborhood (Simpson 0.72)
- Race & ethnicity
- Asian 48% White 21% Two or more races 20% Pacific Islander 7% Hispanic / Latino 5% Black 1%
- Hispanic origin (detail)
- Mexican 2% Puerto Rican 1%
- Common ancestry
- Russian 2% Lithuanian 1% Romanian 1%
- Foreign-born
- 20% · South Korea, China, Vietnam
- Languages at home
- 73% English-only · Other Asian/Pacific 11% Chinese 4% Korean 3%
Political lean MEDSL · Honolulu
- 2024 margin
- Strong D (+21.6) · D 59.9% · R 38.3% · Other 1.8%
- 2008→2024 swing
- -19.4pp toward R · 2008: 41.1pp · 2024: 21.6pp
- All cycles
- 2024: D+21.6 2020: D+26.9 2016: D+29.9 2012: D+39.1 2008: D+41.1
Not yet ingested
- Civics
- —
Market trends
- HPI YoY
- ▲ 2.71%
- Current HPI
- 273.9456
- Rent YoY
- ▲ 5.35%
- Metro
- Urban Honolulu, HI
- State GDP YoY
- —
- F500 in state
- 0
Price history
+14.5% since first listed8 events — show timeline
- 2026-02-09 Listed $355,000 HiCentral MLS
- 2025-11-30 Listing Removed — HiCentral MLS
- 2025-11-11 Price Changed $372,000 HiCentral MLS
- 2025-06-04 Listed $380,000 HiCentral MLS
- 2019-08-28 Sold (MLS) $325,000 HiCentral MLS
- 2019-07-03 Listed $325,000 HiCentral MLS
- 2009-01-12 Sold (MLS) $310,000 HiCentral MLS
- 2008-12-13 Listed $310,000 HiCentral MLS
Property tax history
+1.0%/yrLatest (2022): $1,220 · +5.3% YoY. Source: county tax records.
Cash-flow waterfall
monthlySold comps — $/sqft
last 12 mo · ≤1 miLoading sold comps…