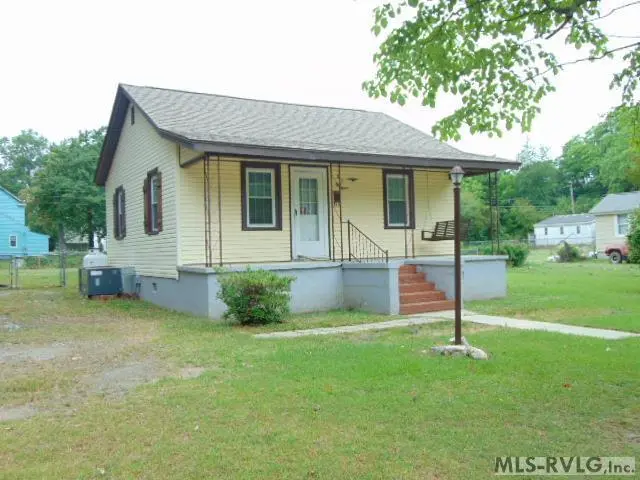
815 Franklin St · Roanoke Rapids, NC
Flood risk 1/10 · Minimal
- FEMA flood zone
- X (unshaded)
- Chance of flooding over 30 yrs
- 0.0%
- Est. flood insurance / yr
- $473 – $860
Fire risk 2/10 · Minimal
- Est. fire insurance / yr
- $906 – $1,684
Heat risk 7/10 · Major
- Hot days now (above 108°F)
- 7 days/yr
- Hot days in 30 yrs
- 16 days/yr
Wind risk 6/10 · Moderate
- Chance of severe wind over 30 yrs
- 66.0%
Air-quality risk 1/10 · Minimal
- Unhealthy air days now
- 0 days/yr
- Unhealthy air days in 30 yrs
- 0 days/yr
Risk factors via First Street. Map © Google.
Why this score? — see what drove the C grade
The composite is a weighted blend of 9 inputs, each scored 0–100. Each bar is that input's sub-score; the figure is the points it added to the 100-point composite (weight × sub-score).
- Cash flow +25.1/30.0
- DSCR +8.2/10.0
- ARV discount +7.8/15.0
- 1% rule +5.7/10.0
- Schools +2.9/10.0
- Livability +2.8/5.0
- Rent growth +2.5/5.0
- Condition / age +2.5/5.0
- Appreciation +0.0/10.0
$92,000
🖨 Deal sheet 📄 Offer letter ✓ Due diligence
Listing remarks MLS
Small bungalow inside city limits. This property would make a great home for a lucky family with a little TLC. Some repairs needed. Bring all Offers!
Key facts
- Fenced back yard
- Heat pump
- Propane tank owned
Tags
Property features AI
Exterior
- Utilities: Public water; Public sewer
- Home design: Residential property; Residential/Vacation subtype; Approximately 0.32 acres lot
- Exterior features: Garden; Storage structure on property; Front porch; Rear porch; Chain link fencing; Has a view
Interior
- Kitchen: Electric oven; Electric range; Refrigerator
- Flooring: Carpet; Vinyl
- Bathrooms: 1 full bathroom
- Heating & cooling: Heat pump; Space heater; Central air
- Interior features: Electric oven, electric range, refrigerator; No fireplace; 4 total rooms; No basement
Neighborhood map
What this means for you Summary
Snapshot
- This is a 2-bed/1.0-bath single-family listed at $92k.
Deal economics
- At list price, monthly cash flow is $203 ($2k/yr) — positive.
- The deal already cash-flows at list — no discount required.
- Meets the 1% rule at list price ($989 rent vs $92k).
- Recommended offer: $91k (1.5% below list) — sets the bar for market timing.
- Cap rate 8.9% vs local median 4.1% in Roanoke Rapids — top-decile yield for the area; either an underpriced asset or a hidden risk that comps aren't pricing in. Stress-test before assuming the spread holds.
Location & tenants
- Location reads 56/100 on livability (#631 in NC) — a working-class tenant base; expect higher turnover. Strengths: cost of living A+, health & safety A, housing B+; Watch: schools F, crime F, amenities F.
- Roanoke Rapids City Schools (town): math 31% / reading 37% proficiency, ranked #135 of 178 in NC (top 76%) — families likely to look elsewhere, expect single-tenant / working-renter base with shorter leases.
- Market conditions: 143 active listings in the ZIP; 55 units permitted in Halifax County in 2024 (0 in 5+ unit buildings).
Forward outlook
- Local home prices are declining (-3.0%/yr); year-one equity from $636 of loan paydown is wiped out by about $3k of value loss. Plan a longer hold.
- Halifax County population projected at -27% by 2050 — secular population decline; favor cash flow + early exit over multi-decade hold.
Negotiation context
- It's been on market 28 days — a 2% lower offer ($91k) is reasonable based on typical stale-listing flexibility.
- 2 sale attempts since 16y ago with the ask held roughly flat each time — persistent listings suggest the price (not the market) is what's stuck; bring a comps-based counter.
- Current owner paid $15k; list at $92k implies a 513% gain — meaningful room to come down on a strong offer.
Risks & watch-outs
- Watch-outs: built in 1950 — expect roof / HVAC / electrical / plumbing capex.
- Climate carrying-cost: major wind risk, 66% chance of damaging wind over 30y; extreme-heat days projected 7→16/yr by 2055 (HVAC capex compounding) — expect insurance premiums to compound above CPI over the hold.
Questions for the listing agent
- Built in 1950 — when were the roof, HVAC, electrical panel, plumbing, and water heater last replaced?
- Is there a deadline driving the sale (1031 exchange, divorce, estate, relocation)? That informs how much negotiation room exists.
- Schools are F-rated, which usually means shorter tenancies and higher turnover. Who's the typical renter profile here, and what's been the actual vacancy rate?
- Crime grade is F in this area — have there been break-ins, vandalism, or insurance claims at this property in the last 3 years? What carrier currently insures it and at what premium?
- What's the average days-on-market for RENTAL listings here right now (not sales)? A rising rental-DOM trend means longer vacancies and softer asking-rent achievability than the comps imply.
- What's the recent tenant-quality profile in this submarket — average credit score on applications, eviction rate, late-payment / NSF rate, and stable-employment percentage? A property-management company in the area should have these aggregated.
- How much new for-sale + rental construction is in the pipeline within 1–3 miles? Heavy new supply typically softens prices + rents 12–24 months out; constrained supply supports both.
Investment metrics
- 1% rule
- 1.07% ✓
- Cap rate
- 8.94%
- Cash-on-cash
- 9.47%
- DSCR
- 1.42
- GRM
- 7.8
CMA / ARV
- ARV (on-the-fly)
- $92,612
- Comps found
- 2
Show comp detail 2 sales within ~0.75 mi
| Address | Dist | Beds/Ba | Sqft | Sold | Price | $/sf | Match |
|---|---|---|---|---|---|---|---|
| 508 Waldo St | 0.50mi | 2/1.0 | 672 (-1%) | 11mo | $60,000 | $89 | 67 |
| 900 Ransome St | 0.67mi | 2/1.0 | 730 (+8%) | 3mo | $100,000 | $137 | 52 |
Match score weights: distance 35% · size 25% · config 20% · recency 20%. Top-matched comps best support the ARV.
Projected returns pro-forma
-3.0% appreciation · 3.0% rent growth · sell at horizon
- IRR
- -2.0%
- Equity multiple
- 0.92×
- Total profit
- $-1,983
- Equity at exit
- $13,717
- IRR
- 7.6%
- Equity multiple
- 1.58×
- Total profit
- $14,859
- Equity at exit
- $7,954
Cash invested: $25,760 (down + closing). Projections, not guarantees.
Landlord ↔ Tenant lean methodology
- Overall (STATE)
- 85 Strongly Landlord-Friendly
- State North Carolina
- 85 Strongly Landlord-Friendly · R+3
- County
- — inherits STATE
- City
- — inherits STATE
ZIP-level market 27870
- Home prices YoY
- -21.1%
- Active inventory
- 143
- Price-to-rent
- 7.8×
Monthly cashflow live
- Estimated rent
- $989 medium interval (Pro) →
- Mortgage (P&I)
- −$482
- Tax from tax record
- −$57 /mo · $684/yr
- Insurance
- −$38
- HOA
- −$0
- Vacancy / Maint / Mgmt
- −$208
- Net cashflow
- $203
Break-even live
UW: 25.0% down · 7.5% · 30yr · 1.5% tax · 5.0% vac · 8.0% maint · 8.0% mgmt
Financing live
Cash to close
- Down payment
- $23,000
- Closing costs
- $2,760
- Reserves months
- —
- Total cash needed
- —
Loan-product check · same deal, 3 products live
Conventional
25% down · 7.5% · 30yr
- Down + closing
- —
- Monthly P&I
- —
- Monthly cashflow
- —
- DSCR
- —
- Eligible?
- —
Personal DTI + credit; lowest rate.
DSCR
20% down · 8.5% · 30yr
- Down + closing
- —
- Monthly P&I
- —
- Monthly cashflow
- —
- DSCR
- —
- Eligible?
- —
No personal income docs; deal must DSCR.
Hard money
10% down · 12.0% · 12mo
- Down + closing
- —
- Monthly P&I
- —
- Monthly cashflow
- —
- DSCR
- —
- Eligible?
- —
Short-term bridge; refi at stabilization.
Listing history 19 events
-
2026-06-19days on market $92,000 Active 28 DOM
-
2026-06-18days on market $92,000 Active 27 DOM
-
2026-06-17days on market $92,000 Active 26 DOM
-
2026-06-16days on market $92,000 Active 25 DOM
-
2026-06-15days on market $92,000 Active 24 DOM
-
2026-06-14days on market $92,000 Active 22 DOM
-
2026-06-12days on market $92,000 Active 21 DOM
-
2026-06-09days on market $92,000 Active 18 DOM
-
2026-06-08days on market $92,000 Active 17 DOM
-
2026-06-07days on market $92,000 Active 16 DOM
-
2026-06-07days on market $92,000 Active 15 DOM
-
2026-06-03days on market $92,000 Active 12 DOM
-
2026-06-02days on market $92,000 Active 11 DOM
-
2026-06-01days on market $92,000 Active 10 DOM
-
2026-05-31days on market $92,000 Active 9 DOM
-
2026-05-30days on market $92,000 Active 8 DOM
-
2026-05-22$92,000 Active
-
2010-05-20soldstatus $15,000 149-char remark
Show marketing remark (149 chars)
Small bungalow inside city limits. This property would make a great home for a lucky family with a little TLC. Some repairs needed. Bring all Offers!
-
2010-04-02$22,900 149-char remark
Show marketing remark (149 chars)
Small bungalow inside city limits. This property would make a great home for a lucky family with a little TLC. Some repairs needed. Bring all Offers!
ⓘ Source: listings_history table (triggers on properties + properties_extension) + one-shot
backfill from property_details.listing_events for pre-trigger history.
Tax reassessment forecast NC · Resets to sale price
- Current annual tax
- $684 · $57/mo
- Projected year-2 tax
- $754 · $63/mo
- Expected delta
- +$71/yr (+$6/mo · 10.4%)
ⓘ Screening estimate from a state-policy table — verify with the county assessor before closing.
Climate risk First Street
- Flood 1/10 Low FEMA zone X (unshaded) · 0% chance over 30 yrs
- Wildfire 2/10 Low
- Heat 7/10 Severe 7 d/yr ≥108°F today · 16 d/yr by 30 yrs out
- Wind 6/10 Major 66% chance of damaging wind over 30 yrs
- Air quality 1/10 Low 0 unhealthy d/yr today · 0 by 30 yrs out
Nearby sold comps map
Loading sold comps map…
Walkable amenities ~0.75 mi
Loading nearby amenities…
Taxation est. · year 1
- Rental income
- $11,864
- − Mortgage interest
- −$5,153
- − Property taxes
- −$684
- − Insurance
- −$460
- − Repairs & maintenance
- −$949
- − Management
- −$949
- − Depreciation
- −$2,676
- Taxable income
- $992
- Est. tax owed @ 24.0%
- −$238
- After-tax cash flow
- $2,201/yr
For passive investors: Depreciation is non-cash, so a rental often shows a tax loss while cash-flowing — sheltering income. Rental losses are passive: they offset passive income freely, and up to $25,000/yr can offset ordinary (W-2) income if you actively participate and your MAGI is under $100k (phasing out to $0 by $150k); unused losses carry forward. On sale, claimed depreciation is recaptured at up to 25%, and gains may owe capital-gains tax (a 1031 exchange can defer both). Figures are a year-1 estimate at your 24.0% rate — not tax advice; consult a CPA.
Schools (NCES district)
- District
- Roanoke Rapids City Schools
- NCES district ID
- 3703900
- Math proficiency
- 31% ▼ -8.00%
- Reading proficiency
- 37% ▲ 1.00%
- Median HH income
- $41,604
- Composite
- 28.7/100
- National rank
- #6689
- State rank
- #135 of 178 in NC
Livability — Roanoke Rapids
- Score
- 56/100
- State rank
- #631
- US rank
- #22900
Category grades
Schools grade is shown separately in the Schools card above.
Census & demographics
- Census place
- Roanoke Rapids, NC
- County
- Halifax County · 24,958 people
- City population
- 24,958
- Metro
- Roanoke Rapids, NC
- Population (ZIP)
- 24,958
- Household income
- $49,502
- Rent vs Own
- Severe rent burden
- 822.0
Population outlook (Halifax County) Hauer SSP2
- Today (2025)
- 47,976 people
- By 2030
- 45,450 · -5.3%
- By 2040
- 39,980 · -16.7%
- By 2050
- 34,863 · -27.3%
- By 2075
- 25,577 · -46.7%
- By 2100
- 18,365 · -61.7%
Race, ethnicity, and origin ACS 2023
- Neighborhood character
- Diverse neighborhood (Simpson 0.61)
- Race & ethnicity
- White 47% Black 40% Two or more races 7% Hispanic / Latino 5% Asian 1%
- Common ancestry
- Slovak 1% Italian 1% Serbian 1%
- Foreign-born
- 3% · Canada, Vietnam
- Languages at home
- 94% English-only · Spanish 4% Other Asian/Pacific 1%
Political lean MEDSL · Halifax
- 2024 margin
- D (+17.7) · D 58.5% · R 40.9%
- 2008→2024 swing
- -10.6pp toward R · 2008: 28.2pp · 2024: 17.7pp
- All cycles
- 2024: D+17.7 2020: D+21.2 2016: D+26.9 2012: D+32.0 2008: D+28.2
Not yet ingested
- Civics
- —
Market trends
- HPI YoY
- ▼ -47.78%
- Current HPI
- 179.1705
- Rent YoY
- —
- Metro
- Roanoke Rapids, NC
- State GDP YoY
- ▲ 3.28%
- F500 in state
- 26
Industry mix (Fortune 500 HQ in NC)
| Industry | F500 HQs | Revenue |
|---|---|---|
| Financial Services | 2 | $213B |
|
||
| Retail | 2 | $95B |
|
||
| Industrial Conglomerate | 1 | $38B |
|
||
| Metals / Steel | 1 | $35B |
|
||
| Utilities | 1 | $30B |
|
||
| Industrial Machinery | 1 | $19B |
|
||
Price history
+301.7% since first listed3 events — show timeline
- 2026-05-22 Listed $92,000 RVLG
- 2010-05-20 Sold (MLS) $15,000 Hive MLS
- 2010-04-02 Listed $22,900 Hive MLS
Property tax history
-0.7%/yrLatest (2025): $684 · +2.2% YoY. Source: county tax records.
Cash-flow waterfall
monthlySold comps — $/sqft
last 12 mo · ≤1 miLoading sold comps…