609 S Neon Ave · Fayetteville, AR
Flood risk 1/10 · Minimal
- FEMA flood zone
- X (unshaded)
- Chance of flooding over 30 yrs
- 0.0%
- Est. flood insurance / yr
- $507 – $1,088
Fire risk 5/10 · Moderate
- Est. fire insurance / yr
- $1,499 – $2,785
Heat risk 5/10 · Moderate
- Hot days now (above 105°F)
- 7 days/yr
- Hot days in 30 yrs
- 20 days/yr
Wind risk 2/10 · Minimal
- Chance of severe wind over 30 yrs
- 2.0%
Air-quality risk 1/10 · Minimal
- Unhealthy air days now
- 0 days/yr
- Unhealthy air days in 30 yrs
- 0 days/yr
Risk factors via First Street. Map © Google.
Why this score? — see what drove the D+ grade
The composite is a weighted blend of 9 inputs, each scored 0–100. Each bar is that input's sub-score; the figure is the points it added to the 100-point composite (weight × sub-score).
- ARV discount +15.0/15.0
- Cash flow +10.6/30.0
- Livability +4.2/5.0
- Schools +4.1/10.0
- Condition / age +4.0/5.0
- 1% rule +3.2/10.0
- DSCR +3.0/10.0
- Rent growth +3.0/5.0
- Appreciation +0.0/10.0
$294,000
🖨 Deal sheet (PDF) 📄 Offer letter ✓ Due diligence
Listing remarks
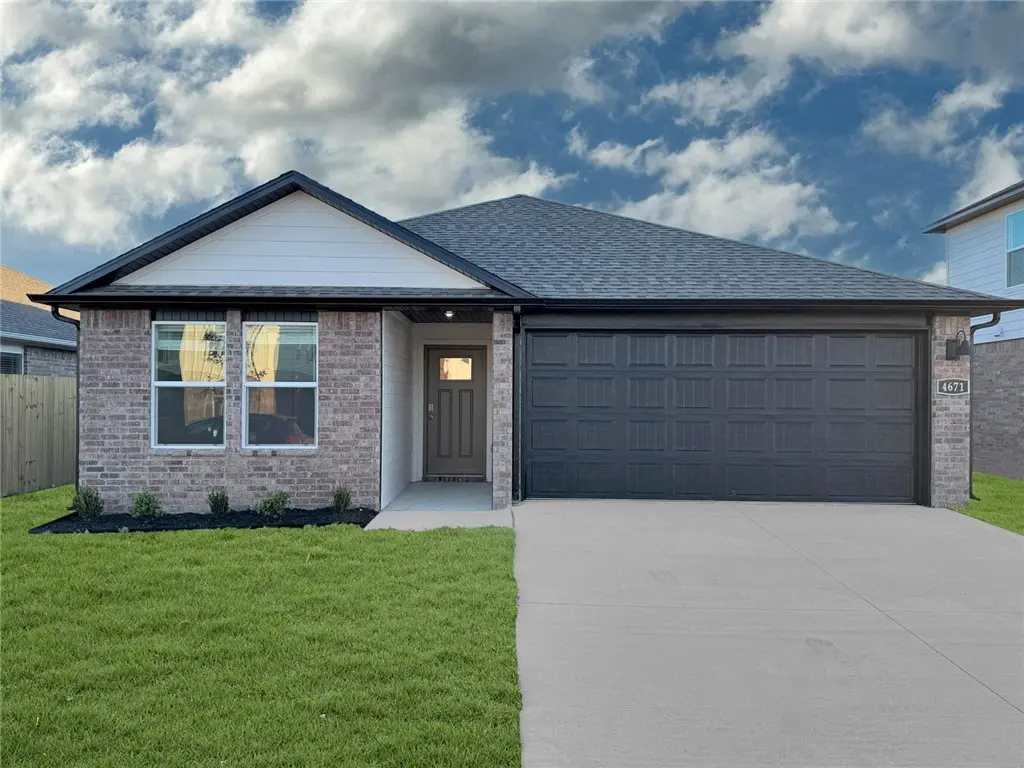
Sold before print! The Lovely Harris plan in The Element, in beautiful Fayetteville, AR! This home offers 4 bedrooms and 3 full bathrooms! Upon entering, you’ll find a spacious living room and kitchen open to a dining area! The kitchen boasts beautiful quartz countertops, a gas range, and pantry. The primary bedroom features an ensuite with quartz countertops with double sinks and a walk-in shower! This home will have LVP flooring throughout. The exterior will feature brick and siding per plan and a covered patio per plan. Homes in this neighborhood are equipped with a programmable thermostat that allows you to effortlessly control your environment with the touch of a button. Landscap
Key facts
- 5,227 sq ft lot
- Garage
- Built 2026
Neighborhood map
What this means for you Summary
Snapshot
- This is a 4-bed/3.0-bath single-family listed at $294k. Condition is rated good.
Deal economics
- At list price, monthly cash flow is $-147 ($-2k/yr) — negative.
- To cash-flow at today's rent, offer at most $273k (7.2% below list).
- To meet the 1% rule (rent ≥ 1% of price), the offer needs to be $241k (18.1% below list).
- Recommended offer: $241k (18.1% below list) — sets the bar for 1% rule.
- Cap rate 5.7% vs local median 3.5% in Fayetteville — top-decile yield for the area; either an underpriced asset or a hidden risk that comps aren't pricing in. Stress-test before assuming the spread holds.
Location & tenants
- Location reads 83/100 on livability (#3 in AR, #871 nationally) — a professional / high-income tenant draw. Strengths: amenities A+, commute A+, health & safety A+; Watch: employment D+, crime D-.
- Fayetteville School District (urban): math 50% / reading 49% proficiency, ranked #19 of 238 in AR (top 8%) — families likely to look elsewhere, expect single-tenant / working-renter base with shorter leases.
- Market conditions: Rents rising (+2.2%/yr); 539 active listings in the ZIP; 40 comparable units currently listed for rent nearby; rentals at typical pace (median 24d on market — plan ~3-4 weeks tenant-placement turnaround); solid renter incomes; 3,494 units permitted in Washington County in 2024 (1,497 in 5+ unit buildings).
- This rent runs 30% of the median local income ($96k/yr) — at the standard rent-burdened threshold; future hikes will face affordability resistance.
Forward outlook
- Local home prices are declining (-3.0%/yr); year-one equity from $2k of loan paydown is wiped out by about $9k of value loss. Plan a longer hold.
- Washington County population projected at +47% by 2050 — long-run rental-demand tailwind backs the buy-and-hold thesis.
Negotiation context
- Only 0 days on market — expect competitive offers; lowballing is unlikely to land.
Risks & watch-outs
- Climate carrying-cost: moderate wildfire risk; extreme-heat days projected 7→20/yr by 2055 (HVAC capex compounding) — expect insurance premiums to compound above CPI over the hold.
Questions for the listing agent
- What do current leases actually rent for vs. the listed asking? Can we see a recent rent roll and the last 12 months of T-12 income?
- What does the HOA fee cover, when was the last increase, and are there any pending special assessments or reserve-fund shortfalls?
- Is there a deadline driving the sale (1031 exchange, divorce, estate, relocation)? That informs how much negotiation room exists.
- Schools are B-rated — typically a magnet for longer-tenancy family renters. What's the average tenant stay here, and is there a school-zone premium baked into asking?
- Crime grade is D in this area — have there been break-ins, vandalism, or insurance claims at this property in the last 3 years? What carrier currently insures it and at what premium?
- The area grade is low — what's the realistic commute time and amenity access for the typical tenant pool here? Any planned neighborhood developments (good or bad) we should know about?
- What's the average days-on-market for RENTAL listings here right now (not sales)? A rising rental-DOM trend means longer vacancies and softer asking-rent achievability than the comps imply.
- What's the recent tenant-quality profile in this submarket — average credit score on applications, eviction rate, late-payment / NSF rate, and stable-employment percentage? A property-management company in the area should have these aggregated.
- How much new for-sale + rental construction is in the pipeline within 1–3 miles? Heavy new supply typically softens prices + rents 12–24 months out; constrained supply supports both.
Investment metrics
- 1% rule
- 0.82% ✗
- Cap rate
- 5.69%
- Cash-on-cash
- -2.14%
- DSCR
- 0.90
- GRM
- 10.2
CMA / ARV
- ARV (on-the-fly)
- $402,996
- Comps found
- 12
Show comp detail 12 sales within ~0.75 mi
| Address | Dist | Beds/Ba | Sqft | Sold | Price | $/sf | Match |
|---|---|---|---|---|---|---|---|
| 4791 W Folsom St | 0.06mi | 4/3.0 | 1,891 (-0%) | 0mo | $367,580 | $194 | 97 |
| 1316 S Lyndon Xing | 0.43mi | 4/3.0 | 2,004 (+6%) | 1mo | $310,000 | $155 | 69 |
| 526 S Calico | 0.39mi | 3/2.0 (-1) | 1,830 (-3%) | 0mo | $399,000 | $218 | 67 |
| 594 S Neon Ave | 0.04mi | 3/2.0 (-1) | 1,637 (-14%) | 0mo | $341,000 | $208 | 67 |
| 60 N Manhattan Way | 0.52mi | 3/2.0 (-1) | 1,891 (-0%) | 0mo | $399,900 | $211 | 66 |
| 1290 S Lyndon Xing | 0.43mi | 3/2.5 (-1) | 1,824 (-4%) | 1mo | $330,000 | $181 | 66 |
| 440 S Calico | 0.40mi | 4/2.0 | 1,745 (-8%) | 1mo | $389,900 | $223 | 63 |
| 4396 W Newton Ave | 0.45mi | 3/2.0 (-1) | 1,787 (-6%) | 1mo | $392,000 | $219 | 60 |
| 4303 W Barhem Dr | 0.53mi | 3/2.0 (-1) | 1,796 (-5%) | 0mo | $382,400 | $213 | 57 |
| 4394 W Barhem Dr | 0.49mi | 3/2.0 (-1) | 1,783 (-6%) | 2mo | $375,000 | $210 | 57 |
| 464 S Calico Ave | 0.40mi | 3/2.0 (-1) | 1,669 (-12%) | 0mo | $389,500 | $233 | 53 |
| 392 S Calico | 0.40mi | 3/2.0 (-1) | 1,669 (-12%) | 1mo | $379,500 | $227 | 52 |
Match score weights: distance 35% · size 25% · config 20% · recency 20%. Top-matched comps best support the ARV.
Projected returns pro-forma
-3.0% appreciation · 2.17% rent growth · sell at horizon
- IRR
- -20.8%
- Equity multiple
- 0.28×
- Total profit
- $-58,929
- Equity at exit
- $43,836
- IRR
- -16.0%
- Equity multiple
- 0.14×
- Total profit
- $-71,200
- Equity at exit
- $25,420
Cash invested: $82,320 (down + closing). Projections, not guarantees.
Landlord ↔ Tenant lean methodology
- Overall (STATE)
- 92 Strongly Landlord-Friendly
- State Arkansas
- 92 Strongly Landlord-Friendly · R+14
- County
- — inherits STATE
- City
- — inherits STATE
ZIP-level market 72704
- Home prices YoY
- -20.2%
- Rents YoY
- 2.2%
- Active inventory
- 539
- Price-to-rent
- 10.2×
Monthly cashflow live
- Estimated rent
- $2,408 high interval (Pro) →
- Mortgage (P&I)
- −$1,542
- Tax est. 1.5%
- −$368 /mo · $4,410/yr
- Insurance
- −$122
- HOA
- −$17
- Vacancy / Maint / Mgmt
- −$506
- Net cashflow
- $-147
Break-even live
Sensitivity live
| Price | -10% $57 | -5% $-45 | +0% $-147 | +5% $-248 | +10% $-350 |
|---|---|---|---|---|---|
| Rent | -10% $-337 | -5% $-242 | +0% $-147 | +5% $-52 | +10% $44 |
| Rate | -1.0pp $1 | -0.5pp $-72 | base $-147 | +0.5pp $-223 | +1.0pp $-300 |
UW: 25.0% down · 7.5% · 30yr · 1.5% tax · 5.0% vac · 8.0% maint · 8.0% mgmt
Financing live
Cash to close
- Down payment
- $73,500
- Closing costs
- $8,820
- Reserves months
- —
- Total cash needed
- —
Loan-product check · same deal, 3 products live
Conventional
25% down · 7.5% · 30yr
- Down + closing
- —
- Monthly P&I
- —
- Monthly cashflow
- —
- DSCR
- —
- Eligible?
- —
Personal DTI + credit; lowest rate.
DSCR
20% down · 8.5% · 30yr
- Down + closing
- —
- Monthly P&I
- —
- Monthly cashflow
- —
- DSCR
- —
- Eligible?
- —
No personal income docs; deal must DSCR.
Hard money
10% down · 12.0% · 12mo
- Down + closing
- —
- Monthly P&I
- —
- Monthly cashflow
- —
- DSCR
- —
- Eligible?
- —
Short-term bridge; refi at stabilization.
Rent comps 40 comps
| Address | Beds | Baths | Sqft | Rent | $/sqft | DOM | Units | Dist |
|---|---|---|---|---|---|---|---|---|
| 4790 W Planetree St Fayetteville, AR | 3.0 | 2.5 | 1688 | $2,700 | $1.60 | 15d | 1 | 0.23mi |
| 4789 W Triangle St Fayetteville, AR | 4.0 | 3.5 | 1983 | $2,800 | $1.41 | 44d | 1 | 0.30mi |
| 4813 W Triangle St Fayetteville, AR | 3.0 | 2.5 | 1797 | $2,500 | $1.39 | 15d | 1 | 0.30mi |
| 4600 W Colfax Loop Fayetteville, AR | 4.0 | 2.0 | 1720 | $1,995 | $1.16 | 24d | 1 | 0.33mi |
| 4479 W Topeka Ave Fayetteville, AR | 3.0 | 2.0 | 1669 | $2,095 | $1.26 | 15d | 1 | 0.33mi |
| 1164 S Oxbow Way Fayetteville, AR | 3.0 | 2.0 | 1328 | $1,650 | $1.24 | 24d | 1 | 0.34mi |
| 139 S Maroon Ave Fayetteville, AR | 4.0 | 2.5 | 2009 | $2,300 | $1.14 | 44d | 1 | 0.35mi |
| 189 S Geranium Ln Fayetteville, AR | 3.0 | 2.0 | 1463 | $1,950 | $1.33 | 44d | 1 | 0.35mi |
| 4805 W Sturgeon St Fayetteville, AR | 4.0 | 2.0 | 1871 | $2,700 | $1.44 | 15d | 1 | 0.35mi |
| 103 S Maroon Ave Fayetteville, AR | 4.0 | 3.0 | 1891 | $2,750 | $1.45 | 15d | 1 | 0.36mi |
| 4491 W Newton Ave Fayetteville, AR | 3.0 | 2.0 | 1389 | $1,875 | $1.35 | 24d | 1 | 0.36mi |
| 502 S Calico Ave Fayetteville, AR | 4.0 | 2.0 | 1745 | $2,595 | $1.49 | 44d | 1 | 0.37mi |
| 4293 W Bronco Dr Fayetteville, AR | 4.0 | 3.5 | 2334 | $3,000 | $1.29 | 44d | 1 | 0.38mi |
| 416 S Calico Ave Fayetteville, AR | 3.0 | 2.0 | 1669 | $2,295 | $1.38 | 44d | 1 | 0.38mi |
| 112 S Broyles Ave Fayetteville, AR | 3.0 | 2.0 | 1603 | $3,000 | $1.87 | 15d | 1 | 0.42mi |
| 4255 W Bronco Dr Fayetteville, AR | 4.0 | 3.5 | 2177 | $2,800 | $1.29 | 44d | 1 | 0.42mi |
| 4628 W Aurora St Fayetteville, AR | 4.0 | 3.0 | 2232 | $2,800 | $1.25 | 44d | 1 | 0.42mi |
| 53 S Geranium Ln Fayetteville, AR | 3.0 | 2.0 | 1556 | $2,075 | $1.33 | 44d | 1 | 0.43mi |
| 801 S Amarillo Ave Unit 1 Fayetteville, AR | 3.0 | 3.5 | 2023 | $2,150 | $1.06 | 15d | 1 | 0.44mi |
| 4820 W Aurora St Fayetteville, AR | 3.0 | 2.0 | 1739 | $2,145 | $1.23 | 15d | 1 | 0.44mi |
| 4337 W Newton Ave Fayetteville, AR | 3.0 | 2.0 | 1430 | $1,895 | $1.33 | 24d | 1 | 0.45mi |
| 1018 S Benchmark Ln Unit 2 Fayetteville, AR | 3.0 | 3.5 | 1710 | $2,100 | $1.23 | 15d | 1 | 0.46mi |
| 4246 W Buckaroo St Fayetteville, AR | 4.0 | 2.0 | 1958 | $2,345 | $1.20 | 24d | 1 | 0.46mi |
| 510 S Wagon Wheel Ave Fayetteville, AR | 3.0 | 2.0 | 1670 | $2,200 | $1.32 | 24d | 1 | 0.46mi |
| 264 E Anabranch Ct Farmington, AR | 3.0 | 2.0 | 1314 | $1,675 | $1.27 | 15d | 1 | 0.48mi |
| 227 E Anabranch Ct Farmington, AR | 3.0 | 2.0 | 1370 | $1,650 | $1.20 | 44d | 1 | 0.50mi |
| 4234 W Eisenhower Pl Fayetteville, AR | 2.0–3.0 | 2.5 | 1189 | $1,800 | $1.51 | 24d | 8 | 0.51mi |
| 40 E Loveland Loop Farmington, AR | 3.0 | 2.0 | 1571 | $1,900 | $1.21 | 44d | 1 | 0.56mi |
| 4494 W Wales Dr Fayetteville, AR | 3.0 | 2.0 | 1556 | $1,950 | $1.25 | 44d | 1 | 0.59mi |
| 4812 W Monaco Bnd Fayetteville, AR | 4.0 | 2.0 | 1560 | $1,900 | $1.22 | 44d | 1 | 0.60mi |
| 4441 W Anthem Dr Fayetteville, AR | 3.0 | 2.0 | 1358 | $1,850 | $1.36 | 44d | 1 | 0.61mi |
| 4405 W Anthem Dr Fayetteville, AR | 3.0 | 2.0 | 1353 | $2,200 | $1.63 | 24d | 1 | 0.62mi |
| 4476 W Anthem Dr Fayetteville, AR | 3.0 | 2.0 | 1483 | $1,875 | $1.26 | 15d | 1 | 0.62mi |
| 5 E Loveland Loop Farmington, AR | 2.0–3.0 | 2.0–2.5 | 1365 | $1,875 | $1.37 | 14d | 15 | 0.64mi |
| 292 N Mojave St Farmington, AR | 3.0 | 2.0 | 1615 | $2,100 | $1.30 | 24d | 1 | 0.70mi |
| 4192 W Anthem Dr Fayetteville, AR | 3.0 | 2.0 | 1408 | $1,895 | $1.35 | 44d | 1 | 0.70mi |
| 158-426 N Broyles Rd Fayetteville, AR | 3.0 | 2.0 | 1408 | $1,875 | $1.33 | 14d | 1 | 0.72mi |
| 19 W Chikasaw Rd Farmington, AR | 3.0 | 2.0 | 1606 | $2,100 | $1.31 | 14d | 1 | 0.74mi |
| 3829 W Gardenia Dr Fayetteville, AR | 3.0 | 2.0 | 1376 | $2,700 | $1.96 | 24d | 1 | 0.92mi |
| 64 W Gilpin St Farmington, AR | 3.0 | 2.0 | 1918 | $2,395 | $1.25 | 14d | 1 | 0.97mi |
HOA detail
- Monthly dues
- $17 · $204/yr
- Likely covers
- gas
Listing history 2 events
-
2026-06-05remarks 693-char remark
-
2026-06-05$294,000 Pending
ⓘ Source: listings_history table (triggers on properties + properties_extension) + one-shot
backfill from property_details.listing_events for pre-trigger history.
Climate risk First Street
- Flood 1/10 Low FEMA zone X (unshaded) · 0% chance over 30 yrs
- Wildfire 5/10 Major
- Heat 5/10 Major 7 d/yr ≥105°F today · 20 d/yr by 30 yrs out
- Wind 2/10 Low 2% chance of damaging wind over 30 yrs
- Air quality 1/10 Low 0 unhealthy d/yr today · 0 by 30 yrs out
Nearby sold comps map
Loading sold comps map…
Walkable amenities ~0.75 mi
Loading nearby amenities…
Taxation est. · year 1
- Rental income
- $28,893
- − Mortgage interest
- −$16,469
- − Property taxes
- −$4,410
- − Insurance
- −$1,470
- − Repairs & maintenance
- −$2,311
- − Management
- −$2,311
- − HOA
- −$204
- − Depreciation
- −$8,553
- Taxable loss
- −$6,835
- Est. tax savings @ 24.0%
- +$1,640
- After-tax cash flow
- $-119/yr
For passive investors: Depreciation is non-cash, so a rental often shows a tax loss while cash-flowing — sheltering income. Rental losses are passive: they offset passive income freely, and up to $25,000/yr can offset ordinary (W-2) income if you actively participate and your MAGI is under $100k (phasing out to $0 by $150k); unused losses carry forward. On sale, claimed depreciation is recaptured at up to 25%, and gains may owe capital-gains tax (a 1031 exchange can defer both). Figures are a year-1 estimate at your 24.0% rate — not tax advice; consult a CPA.
Condition & rehab AI · 6 photos
This Harris plan home in The Element neighborhood is move-in ready with a good condition score and minimal repairs needed. It offers a spacious layout, modern finishes, and a well-maintained exterior. Potential buyers and renters can expect a good return on investment with minor updates.
Value-add opportunities
- Both Painting the exterior and interior walls — Fresh paint can enhance curb appeal and interior aesthetics.
- Both Landscaping improvements — Enhanced landscaping can increase curb appeal and property value.
- Both Adding smart home features — Modern smart home features can increase both resale and rental value.
- Both Upgrading the kitchen appliances — Modern appliances can improve the kitchen's functionality and appeal to potential buyers/renters.
Renovation cost estimate screening
Value-add ROI direction
- Both Painting the exterior and interior walls — Fresh paint can enhance curb appeal and interior aesthetics. ↑
- Both Landscaping improvements — Enhanced landscaping can increase curb appeal and property value. ↑
- Both Adding smart home features — Modern smart home features can increase both resale and rental value. ↑
- Both Upgrading the kitchen appliances — Modern appliances can improve the kitchen's functionality and appeal to potential buyers/renters. ↑
ⓘ Cost ranges are severity-bucket heuristics (US national rule-of-thumb). Get contractor quotes + a written scope before underwriting a rehab budget.
Schools (NCES district)
- District
- Fayetteville School District
- NCES district ID
- 0506120
- Math proficiency
- 50% ▼ -11.00%
- Reading proficiency
- 49% ▼ -8.00%
- Median HH income
- $39,595
- Composite
- 41.39/100
- National rank
- #3477
- State rank
- #19 of 238 in AR
Livability — Fayetteville
- Score
- 83/100
- State rank
- #3
- US rank
- #871
Category grades
Schools grade is shown separately in the Schools card above.
Census & demographics
- Census place
- Fayetteville, AR
- County
- Washington County · 252,056 people
- City population
- 118,228
- Metro
- Fayetteville-Springdale-Rogers, AR
- Population (ZIP)
- 32,497
- Household income
- $96,014
- Rent vs Own
- Severe rent burden
- 883.0
Population outlook (Washington County) Hauer SSP2
- Today (2025)
- 271,748 people
- By 2030
- 296,414 · +9.1%
- By 2040
- 346,874 · +27.6%
- By 2050
- 398,552 · +46.7%
- By 2075
- 523,309 · +92.6%
- By 2100
- 615,280 · +126.4%
Race, ethnicity, and origin ACS 2023
- Neighborhood character
- Predominantly White (77%)
- Race & ethnicity
- White 77% Two or more races 14% Hispanic / Latino 7% Black 3% Asian 2%
- Hispanic origin (detail)
- Mexican 5%
- Common ancestry
- Slovak 3% Italian 3% Lithuanian 2%
- Foreign-born
- 5% · Canada
- Languages at home
- 94% English-only · Spanish 3% Other Indo-European 2% Other Asian/Pacific 1%
Political lean MEDSL · Washington
- 2024 margin
- Lean R (+6.7) · D 45.1% · R 51.7% · Other 3.2%
- 2008→2024 swing
- +6.4pp toward D · 2008: -13.1pp · 2024: -6.7pp
- All cycles
- 2024: R+6.7 2020: R+3.9 2016: R+10.4 2012: R+16.3 2008: R+13.1
Not yet ingested
- Civics
- —
Market trends
- HPI YoY
- ▼ -73.44%
- Current HPI
- 289.7478
- Rent YoY
- ▲ 2.17%
- Metro
- Fayetteville-Springdale-Rogers, AR
- State GDP YoY
- ▲ 3.80%
- F500 in state
- 10
Industry mix (Fortune 500 HQ in AR)
| Industry | F500 HQs | Revenue |
|---|---|---|
| Retail | 1 | $681B |
|
||
| Food / Agriculture | 1 | $53B |
|
||
| Retail / Energy | 1 | $22B |
|
||
| Transportation / Logistics | 1 | $12B |
|
||
| Energy | 1 | $4B |
|
||
Price history
2 events — show timeline
- 2026-06-03 Delisted — NWARMLS
- 2026-06-03 Listed $294,000 NWARMLS
Cash-flow waterfall
monthlySold comps — $/sqft
last 12 mo · ≤1 miLoading sold comps…