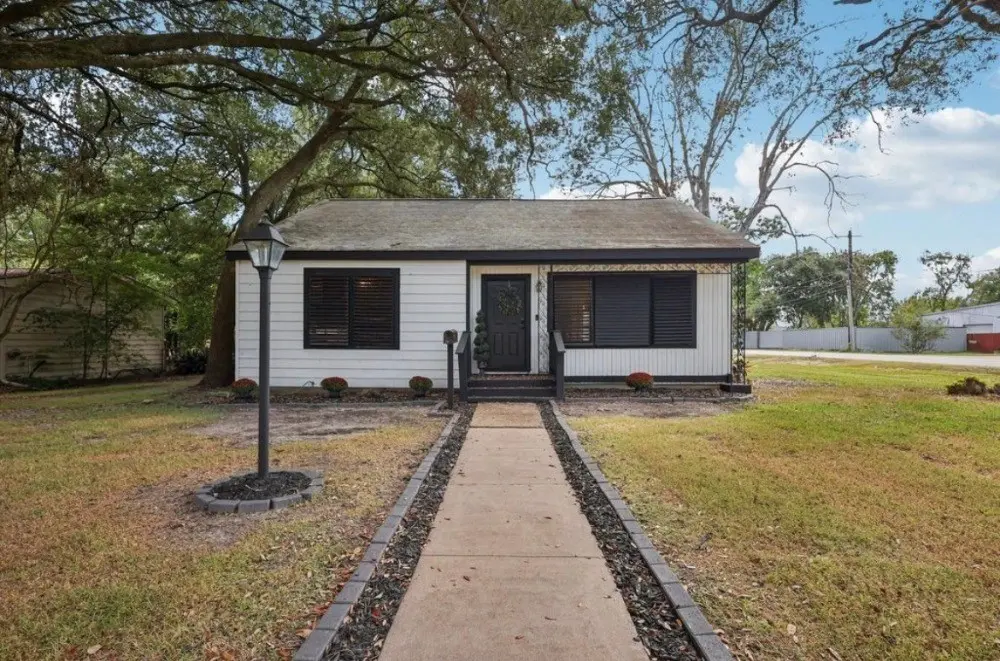
2423 Meadow Ln · La Marque, TX
Flood risk 7/10 · Major
- FEMA flood zone
- X
- Chance of flooding over 30 yrs
- 0.6%
- Est. flood insurance / yr
- $507 – $1,088
Fire risk 4/10 · Minor
- Est. fire insurance / yr
- $1,222 – $2,270
Heat risk 10/10 · Severe
- Hot days now (above 110°F)
- 7 days/yr
- Hot days in 30 yrs
- 27 days/yr
Wind risk 10/10 · Severe
- Chance of severe wind over 30 yrs
- 99.0%
Air-quality risk 3/10 · Minor
- Unhealthy air days now
- 2 days/yr
- Unhealthy air days in 30 yrs
- 2 days/yr
Risk factors via First Street. Map © Google.
Why this score? — see what drove the F grade
The composite is a weighted blend of 9 inputs, each scored 0–100. Each bar is that input's sub-score; the figure is the points it added to the 100-point composite (weight × sub-score).
- Cash flow +13.6/30.0
- DSCR +4.1/10.0
- 1% rule +3.9/10.0
- Rent growth +3.5/5.0
- Livability +3.0/5.0
- Condition / age +2.5/5.0
- Schools +2.4/10.0
- ARV discount +0.5/15.0
- Appreciation +0.0/10.0
$198,000
🖨 Deal sheet (PDF) 📄 Offer letter ✓ Due diligence
Listing remarks MLS
Welcome to this charming gem, perfectly situated on a spacious corner lot. This delightful 3-bedroom, 1.5-bath home offers a cozy and convenient lifestyle. Step inside to discover a bright and inviting living space with ample natural light. The well-appointed kitchen boasts modern amenities, and the open layout is ideal for entertaining. Enjoy the convenience of a 2-car garage, providing plenty of storage space. Relax in the generously sized bedrooms, and take advantage of the 1.5 bathrooms, offering both functionality and style. Outside, the corner lot provides room to roam and endless possibilities for gardening or outdoor activities. This home is a fantastic opportunity for those seeking one-story living in a prime location. Room measurements are approximate. MULTIPLE OFFERS HIGHEST AND BEST BY MONDAY 9/11/23 @ noon.
Key facts
- 0.25 acre lot
- 2 garage spots
- Built 1955
Neighborhood map
What this means for you Summary
Snapshot
- This is a 3-bed/1.0-bath single-family listed at $198k.
Deal economics
- At list price, monthly cash flow is $-56 ($-673/yr) — negative.
- To cash-flow at today's rent, offer at most $188k (5.0% below list).
- To meet the 1% rule (rent ≥ 1% of price), the offer needs to be $177k (10.5% below list).
- Recommended offer: $177k (10.5% below list) — sets the bar for 1% rule.
Location & tenants
- Location reads 59/100 on livability (#1,136 in TX) — a working-class tenant base; expect higher turnover. Strengths: cost of living A+, housing A+; Watch: employment D, crime F, amenities F.
- Texas City ISD (suburban): math 28% / reading 29% proficiency, ranked #655 of 826 in TX (top 79%) — low school quality limits family demand, transient renter base, plan for 1-2y turnover; 66% free/reduced lunch — lower-income household profile, screen leases tightly.
- Zoned schools: Hayley El (math 7% / reading 11%, grade F, #4,293 of 4,322 statewide, top 99%, 562 students, 92% FRL); La Marque H S (math 27% / reading 20%, grade F, #1,342 of 1,632 statewide, top 82%, 647 students, 91% FRL) — zoned schools average 92% FRL vs 66% district-wide (26 pts higher); higher-poverty schools than district average — tighter screening recommended.
- Zoned-school proficiency averages 16% at this address vs 28% district-wide (-12 pts) — the specific schools serving this property underperform the Texas City ISD average; the district grade overstates school quality for this exact location.
- Market conditions: Rents rising (+4.0%/yr); 661 active listings in the ZIP; 10 comparable units currently listed for rent nearby; rentals at typical pace (median 26d on market — plan ~3-4 weeks tenant-placement turnaround); 40% of comp listings sitting > 30 days — soft ceiling on asking rent; 3,258 units permitted in Galveston County in 2024 (0 in 5+ unit buildings).
Forward outlook
- Local home prices are declining (-3.0%/yr); year-one equity from $1k of loan paydown is wiped out by about $6k of value loss. Plan a longer hold.
- Galveston County population projected at +43% by 2050 — long-run rental-demand tailwind backs the buy-and-hold thesis.
Negotiation context
- Only 6 days on market — expect competitive offers; lowballing is unlikely to land.
- 2 sale attempts since 3y ago with the ask held roughly flat each time — persistent listings suggest the price (not the market) is what's stuck; bring a comps-based counter.
Risks & watch-outs
- Watch-outs: flood insurance adds $66/mo; built in 1955 — expect roof / HVAC / electrical / plumbing capex.
- Climate carrying-cost: major flood risk; severe wind risk, 99% chance of damaging wind over 30y; extreme-heat days projected 7→27/yr by 2055 (HVAC capex compounding) — expect insurance premiums to compound above CPI over the hold.
Questions for the listing agent
- What do current leases actually rent for vs. the listed asking? Can we see a recent rent roll and the last 12 months of T-12 income?
- Built in 1955 — when were the roof, HVAC, electrical panel, plumbing, and water heater last replaced?
- What's the actual annual flood-insurance premium (NFIP or private), and is the property in a SFHA with mandatory coverage?
- Is there a deadline driving the sale (1031 exchange, divorce, estate, relocation)? That informs how much negotiation room exists.
- Schools are F-rated, which usually means shorter tenancies and higher turnover. Who's the typical renter profile here, and what's been the actual vacancy rate?
- Crime grade is F in this area — have there been break-ins, vandalism, or insurance claims at this property in the last 3 years? What carrier currently insures it and at what premium?
- The area grade is low — what's the realistic commute time and amenity access for the typical tenant pool here? Any planned neighborhood developments (good or bad) we should know about?
- What's the average days-on-market for RENTAL listings here right now (not sales)? A rising rental-DOM trend means longer vacancies and softer asking-rent achievability than the comps imply.
- What's the recent tenant-quality profile in this submarket — average credit score on applications, eviction rate, late-payment / NSF rate, and stable-employment percentage? A property-management company in the area should have these aggregated.
- How much new for-sale + rental construction is in the pipeline within 1–3 miles? Heavy new supply typically softens prices + rents 12–24 months out; constrained supply supports both.
Investment metrics
- 1% rule
- 0.89% ✗
- Cap rate
- 6.36%
- Cash-on-cash
- 0.23%
- DSCR
- 1.01
- GRM
- 9.3
CMA / ARV
- ARV (on-the-fly)
- $171,336
- Comps found
- 12
Show comp detail 12 sales within ~0.75 mi
| Address | Dist | Beds/Ba | Sqft | Sold | Price | $/sf | Match |
|---|---|---|---|---|---|---|---|
| 1915 Little St | 0.39mi | 3/1.5 | 1,333 (+3%) | 1mo | $139,900 | $105 | 75 |
| 2726 S Crockett St | 0.35mi | 3/1.0 | 1,370 (+6%) | 8mo | $155,000 | $113 | 68 |
| 1903 Little St | 0.45mi | 3/2.0 | 1,269 (-2%) | 4mo | $139,999 | $110 | 68 |
| 1405 Austin St | 0.41mi | 3/2.0 | 1,389 (+7%) | 1mo | $235,000 | $169 | 65 |
| 2307 Scott St | 0.19mi | 3/2.0 | 1,427 (+10%) | 9mo | $220,000 | $154 | 63 |
| 2209 Irene St | 0.20mi | 3/2.0 | 1,479 (+14%) | 6mo | $200,777 | $136 | 58 |
| 1801 W Houston Dr | 0.46mi | 3/1.0 | 1,168 (-10%) | 6mo | $140,000 | $120 | 57 |
| 1504 Westward Ave | 0.61mi | 4/2.0 (+1) | 1,275 (-2%) | 8mo | $150,000 | $118 | 53 |
| 2807 S Houston Dr | 0.37mi | 3/2.0 | 1,466 (+13%) | 6mo | $175,000 | $119 | 52 |
| 1506 W Crockett St | 0.50mi | 3/1.0 | 1,163 (-10%) | 9mo | $180,000 | $155 | 52 |
| 1013 Veronica St | 0.66mi | 2/2.0 (-1) | 1,246 (-4%) | 8mo | $165,000 | $132 | 47 |
| 1403 Melody Dr | 0.74mi | 3/2.0 | 1,386 (+7%) | 5mo | $220,000 | $159 | 46 |
Match score weights: distance 35% · size 25% · config 20% · recency 20%. Top-matched comps best support the ARV.
Projected returns pro-forma
-3.0% appreciation · 3.95% rent growth · sell at horizon
- IRR
- -17.1%
- Equity multiple
- 0.39×
- Total profit
- $-33,864
- Equity at exit
- $29,522
- IRR
- -7.2%
- Equity multiple
- 0.52×
- Total profit
- $-26,605
- Equity at exit
- $17,119
Cash invested: $55,440 (down + closing). Projections, not guarantees.
Landlord ↔ Tenant lean methodology
- Overall (STATE)
- 87 Strongly Landlord-Friendly
- State Texas
- 87 Strongly Landlord-Friendly · R+5
- County
- — inherits STATE
- City
- — inherits STATE
ZIP-level market 77568
- Home prices YoY
- -22.7%
- Rents YoY
- 4.0%
- Active inventory
- 661
- Price-to-rent
- 9.3×
Monthly cashflow live
- Estimated rent
- $1,772 high interval (Pro) →
- Mortgage (P&I)
- −$1,038
- Tax from tax record
- −$269 /mo · $3,223/yr
- Insurance
- −$82
- Flood insurance flood zone
- −$66 /mo · $798/yr
- HOA
- −$0
- Vacancy / Maint / Mgmt
- −$372
- Net cashflow
- $-56
Break-even live
Sensitivity live
| Price | -10% $56 | -5% $0 | +0% $-56 | +5% $-112 | +10% $-168 |
|---|---|---|---|---|---|
| Rent | -10% $-196 | -5% $-126 | +0% $-56 | +5% $14 | +10% $84 |
| Rate | -1.0pp $44 | -0.5pp $-6 | base $-56 | +0.5pp $-107 | +1.0pp $-160 |
UW: 25.0% down · 7.5% · 30yr · 1.5% tax · 5.0% vac · 8.0% maint · 8.0% mgmt
Financing live
Cash to close
- Down payment
- $49,500
- Closing costs
- $5,940
- Reserves months
- —
- Total cash needed
- —
Loan-product check · same deal, 3 products live
Conventional
25% down · 7.5% · 30yr
- Down + closing
- —
- Monthly P&I
- —
- Monthly cashflow
- —
- DSCR
- —
- Eligible?
- —
Personal DTI + credit; lowest rate.
DSCR
20% down · 8.5% · 30yr
- Down + closing
- —
- Monthly P&I
- —
- Monthly cashflow
- —
- DSCR
- —
- Eligible?
- —
No personal income docs; deal must DSCR.
Hard money
10% down · 12.0% · 12mo
- Down + closing
- —
- Monthly P&I
- —
- Monthly cashflow
- —
- DSCR
- —
- Eligible?
- —
Short-term bridge; refi at stabilization.
Rent comps 10 comps
| Address | Beds | Baths | Sqft | Rent | $/sqft | DOM | Units | Dist |
|---|---|---|---|---|---|---|---|---|
| 2729 Main St La Marque, TX | 2.0 | 1.0–2.0 | 864 | $950 | $1.10 | 0d | 3 | 0.41mi |
| 1401 Austin St La Marque, TX | 4.0 | 3.0 | 1542 | $2,400 | $1.56 | 44d | 1 | 0.46mi |
| 1825 Bayou Rd La Marque, TX | 2.0 | 1.0 | 1200 | $1,195 | $1.00 | 44d | 1 | 0.49mi |
| 1230 Kirsten St La Marque, TX | 3.0 | 2.0 | 1704 | $1,660 | $0.97 | 4d | 1 | 0.56mi |
| 1013 Margot St La Marque, TX | 3.0 | 2.0 | 1099 | $1,500 | $1.36 | 20d | 1 | 0.65mi |
| 1006 E Camp Cir La Marque, TX | 3.0 | 1.0 | 1230 | $1,500 | $1.22 | 25d | 1 | 0.73mi |
| 203 Beatrice St La Marque, TX | 3.0 | 1.0 | 1304 | $1,395 | $1.07 | 25d | 1 | 1.34mi |
| 309 S Bell Dr Texas City, TX | 2.0 | 2.0 | 1316 | $1,650 | $1.25 | 44d | 1 | 1.39mi |
| 14403 Daniel Shores Dr La Marque, TX | 4.0 | 3.0–3.5 | 1872 | $2,600 | $1.39 | 0d | 12 | 1.44mi |
| 6607 Fairwood Rd Hitchcock, TX | 3.0 | 2.0 | 912 | $1,550 | $1.70 | 44d | 1 | 1.46mi |
Listing history 14 events
-
2026-06-21days on market $198,000 Active 6 DOM
-
2026-06-18days on market $198,000 Active 3 DOM
-
2026-06-17days on market $198,000 Active 2 DOM
-
2026-06-16statusdays on market $198,000 Active 1 DOM
-
2026-06-15days on market $198,000 Coming Soon 17 DOM
-
2026-06-13days on market $198,000 Coming Soon 15 DOM
-
2026-06-09days on market $198,000 Coming Soon 11 DOM
-
2026-06-08days on market $198,000 Coming Soon 10 DOM
-
2026-06-07days on market $198,000 Coming Soon 9 DOM
-
2026-06-04days on market $198,000 Coming Soon 6 DOM
-
2026-06-03days on market $198,000 Coming Soon 5 DOM
-
2026-06-02days on market $198,000 Coming Soon 4 DOM
-
2026-06-01days on market $198,000 Coming Soon 3 DOM
-
2026-05-31days on market $198,000 Coming Soon 2 DOM
ⓘ Source: listings_history table (triggers on properties + properties_extension) + one-shot
backfill from property_details.listing_events for pre-trigger history.
Tax reassessment forecast TX · Resets to sale price
- Current annual tax
- $3,223 · $269/mo
- Projected year-2 tax
- $3,623 · $302/mo
- Expected delta
- +$400/yr (+$33/mo · 12.4%)
ⓘ Screening estimate from a state-policy table — verify with the county assessor before closing.
Climate risk First Street
- Flood 7/10 Severe FEMA zone X · 60% chance over 30 yrs
- Wildfire 4/10 Moderate
- Heat 10/10 Extreme 7 d/yr ≥110°F today · 27 d/yr by 30 yrs out
- Wind 10/10 Extreme 99% chance of damaging wind over 30 yrs
- Air quality 3/10 Moderate 2 unhealthy d/yr today · 2 by 30 yrs out
Nearby sold comps map
Loading sold comps map…
Walkable amenities ~0.75 mi
Loading nearby amenities…
Taxation est. · year 1
- Rental income
- $21,263
- − Mortgage interest
- −$11,091
- − Property taxes
- −$3,223
- − Insurance
- −$1,787
- − Repairs & maintenance
- −$1,701
- − Management
- −$1,701
- − Depreciation
- −$5,760
- Taxable loss
- −$4,000
- Est. tax savings @ 24.0%
- +$960
- After-tax cash flow
- $288/yr
For passive investors: Depreciation is non-cash, so a rental often shows a tax loss while cash-flowing — sheltering income. Rental losses are passive: they offset passive income freely, and up to $25,000/yr can offset ordinary (W-2) income if you actively participate and your MAGI is under $100k (phasing out to $0 by $150k); unused losses carry forward. On sale, claimed depreciation is recaptured at up to 25%, and gains may owe capital-gains tax (a 1031 exchange can defer both). Figures are a year-1 estimate at your 24.0% rate — not tax advice; consult a CPA.
Schools (NCES district)
- District
- Texas City ISD
- NCES district ID
- 4842510
- Math proficiency
- 28% ▼ -10.00%
- Reading proficiency
- 29% ▼ -4.00%
- Median HH income
- $44,875
- Composite
- 24.47/100
- National rank
- #7664
- State rank
- #655 of 826 in TX
Livability — La Marque
- Score
- 59/100
- State rank
- #1136
- US rank
- #20037
Category grades
Schools grade is shown separately in the Schools card above.
Census & demographics
- Census place
- La Marque, TX
- County
- Galveston County · 357,330 people
- City population
- 23,083
- Metro
- Houston-The Woodlands-Sugar Land, TX
- Population (ZIP)
- 23,083
- Household income
- $74,694
- Rent vs Own
- Severe rent burden
- 700.0
Population outlook (Galveston County) Hauer SSP2
- Today (2025)
- 390,640 people
- By 2030
- 425,226 · +8.9%
- By 2040
- 493,765 · +26.4%
- By 2050
- 559,698 · +43.3%
- By 2075
- 719,260 · +84.1%
- By 2100
- 819,628 · +109.8%
Race, ethnicity, and origin ACS 2023
- Neighborhood character
- Highly diverse neighborhood (Simpson 0.71)
- Race & ethnicity
- White 37% Hispanic / Latino 29% Black 26% Two or more races 17% Asian 3%
- Hispanic origin (detail)
- Mexican 22% Puerto Rican 1%
- Common ancestry
- Lithuanian 1% Italian 1% Serbian 1%
- Foreign-born
- 8% · Canada
- Languages at home
- 77% English-only · Spanish 21% Tagalog/Filipino 1% Other Asian/Pacific 1%
Political lean MEDSL · Galveston
- 2024 margin
- Strong R (+27.4) · D 35.7% · R 63.1% · Other 1.2%
- 2008→2024 swing
- -7.9pp toward R · 2008: -19.5pp · 2024: -27.4pp
- All cycles
- 2024: R+27.4 2020: R+22.6 2016: R+22.6 2012: R+26.9 2008: R+19.5
Not yet ingested
- Civics
- —
Market trends
- HPI YoY
- ▼ -69.39%
- Current HPI
- 236.0239
- Rent YoY
- ▲ 3.95%
- Metro
- Houston-The Woodlands-Sugar Land, TX
- State GDP YoY
- ▲ 3.95%
- F500 in state
- 110
Industry mix (Fortune 500 HQ in TX)
| Industry | F500 HQs | Revenue |
|---|---|---|
| Energy | 16 | $1,198B |
|
||
| Technology | 5 | $198B |
|
||
| Engineering / Construction | 4 | $72B |
|
||
| Energy Services | 3 | $60B |
|
||
| Utilities | 3 | $41B |
|
||
| Healthcare | 2 | $330B |
|
||
Price history
+10.1% since first listed11 events — show timeline
- 2026-05-29 Coming Soon $198,000 HARMLS
- 2025-12-02 Listing Removed — HARMLS
- 2025-10-20 Listed $200,000 HARMLS
- 2023-10-05 Sold (Public Records) — Public Records
- 2023-10-04 Sold (MLS) — HARMLS
- 2023-09-21 Pending — HARMLS
- 2023-09-12 Pending — HARMLS
- 2023-09-08 Listed $179,900 HARMLS
- 2001-05-17 Sold (Public Records) — Public Records
- 2001-05-17 Sold (Public Records) — Public Records
- 2001-05-15 Sold (Public Records) — Public Records
Property tax history
+7.1%/yrLatest (2025): $3,223 · -6.3% YoY. Source: county tax records.
Cash-flow waterfall
monthlySold comps — $/sqft
last 12 mo · ≤1 miLoading sold comps…