 Fourplex
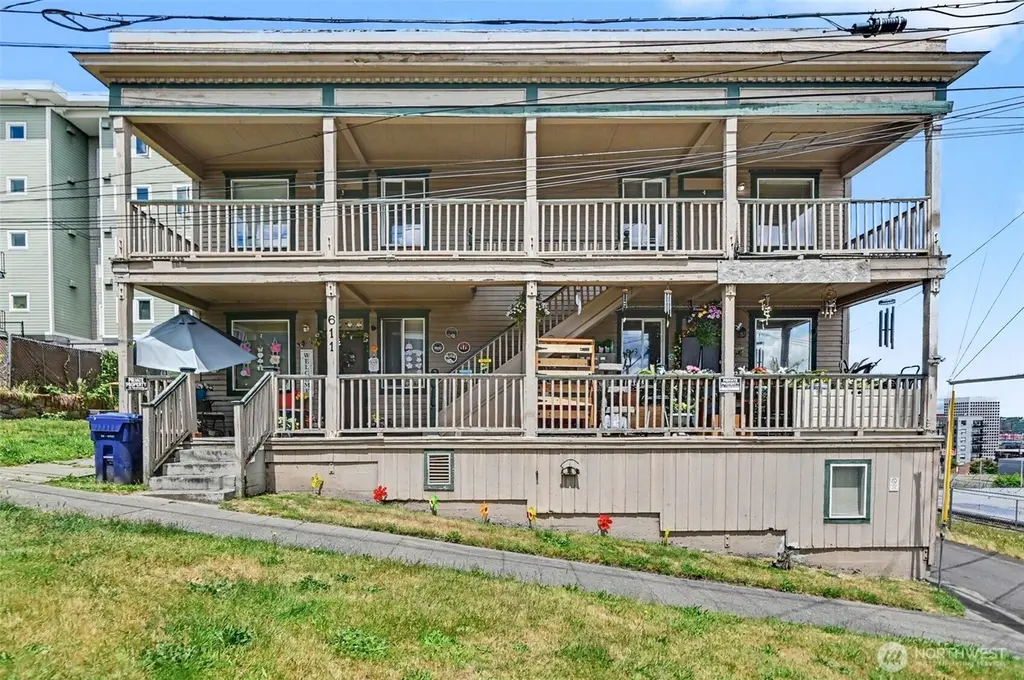
611 S 18th St · Tacoma, WA
Flood risk 1/10 · Minimal
- FEMA flood zone
- X (unshaded)
- Chance of flooding over 30 yrs
- 0.0%
- Est. flood insurance / yr
- $473 – $860
Fire risk 1/10 · Minimal
- Est. fire insurance / yr
- $604 – $1,122
Heat risk 3/10 · Minor
- Hot days now (above 87°F)
- 7 days/yr
- Hot days in 30 yrs
- 15 days/yr
Wind risk 1/10 · Minimal
- Chance of severe wind over 30 yrs
- —
Air-quality risk 7/10 · Major
- Unhealthy air days now
- 10 days/yr
- Unhealthy air days in 30 yrs
- 12 days/yr
Risk factors via First Street. Map © Google.
Why this score? — see what drove the C grade
The composite is a weighted blend of 9 inputs, each scored 0–100. Each bar is that input's sub-score; the figure is the points it added to the 100-point composite (weight × sub-score).
- Cash flow +22.9/30.0
- DSCR +7.3/10.0
- ARV discount +6.6/15.0
- 1% rule +5.6/10.0
- Schools +4.2/10.0
- Livability +3.9/5.0
- Rent growth +3.5/5.0
- Condition / age +2.5/5.0
- Appreciation +0.0/10.0
$729,950
🖨 Deal sheet 📄 Offer letter ✓ Due diligence
Multi-family units
County records classify this as Multi-Family (2-4 Unit). Listing-text estimate: 4 units. confirmed
Listing remarks
Fantastic investment opportunity in Tacoma! This well-located two-story fourplex features four spacious units, each offering 2 bedrooms, 1 bath, and approximately 774 square feet of comfortable living space. Every unit welcomes residents with a charming front porch area, providing a warm and inviting entry. Additional amenities include convenient community laundry facilities and additional storage. Ideally situated just blocks from Downtown Tacoma, this property offers exceptional access to I-5 and is close to St. Joseph Medical Center, the University of Washington Tacoma campus, the Tacoma Convention Center, shopping, dining, and entertainment. Whether you're looking to expand your investm
Key facts
- Front porch area
- Two-story fourplex
- Additional storage
Tags
Property features AI
Finance
- Financial info: Gross scheduled income approximately $55,440 annually; Gross adjusted income approximately $54,000 annually; Total monthly income around $4,620; Net operating income approximately $32,998; Total expenses around $22,442 annually; Insurance expense approximately $2,968; Other expenses approximately $2,520; Gross rent multiplier about 13.17; Listing terms: Cash or Conventional
Exterior
- Parking: Directions to property provided (local street access)
- Utilities: Electric service; Public water (TPU); Sewer connected (TPU); Power provided by TPU
- Home design: Residential income property (multi-family); Quadruplex; Two stories
- Construction: Wood construction; Flat roof; Poured concrete foundation; Built as a 4-plex
- Exterior features: Wood siding/wood products exterior; Deck; Cable TV available; Corner lot with alley access; Curbs, paved streets and sidewalks; Value in land; Has a view
Interior
- Kitchen: Each unit has a range/oven; Each unit includes a refrigerator; No dishwashers in units
- Bedrooms: Each unit is 2 bedrooms
- Flooring: Vinyl flooring; Carpet flooring
- Bathrooms: Each unit has 1 bathroom
- Heating & cooling: Forced air heating; No cooling
- Interior features: Basement; Vinyl and carpet flooring
- Laundry & utility: No in-unit washer/dryer (units do not include washers or dryers)
Neighborhood map
What this means for you Summary
Snapshot
- This is a 4 × 2-bed/1.0-bath units multifamily listed at $730k.
Deal economics
- At list price, monthly cash flow is $1k ($15k/yr) — positive. Per door: $320/mo.
- The deal already cash-flows at list — no discount required.
- Meets the 1% rule at list price ($8k rent vs $730k).
- Cap rate 8.4% vs local median 2.9% in Tacoma — top-decile yield for the area; either an underpriced asset or a hidden risk that comps aren't pricing in. Stress-test before assuming the spread holds.
Location & tenants
- Location reads 78/100 on livability (#127 in WA, #2,535 nationally) — a middle-class / working-renter tenant base. Strengths: amenities A+, commute A+, housing A+; Watch: cost of living D, crime F.
- Tacoma School District (urban): math 40% / reading 53% proficiency, ranked #169 of 291 in WA (top 58%) — families likely to look elsewhere, expect single-tenant / working-renter base with shorter leases.
- Zoned schools: Stadium High School (1,571 students, 36% FRL) — zoned schools average 36% FRL vs 53% district-wide (17 pts lower); this property's tenant base skews higher-income than the district average.
- Market conditions: Rents rising (+3.9%/yr); 122 active listings in the ZIP; solid renter incomes; 3,209 units permitted in Pierce County in 2024 (1,269 in 5+ unit buildings).
- At $7,721/mo this rent would consume 122% of the median local household income ($76k/yr) (locally 1313% of renters already pay >50% of income on rent) — very limited rent-growth headroom before tenants either downsize or default.
Forward outlook
- Local home prices are declining (-3.0%/yr); year-one equity from $5k of loan paydown is wiped out by about $22k of value loss. Plan a longer hold.
- Pierce County population projected at +26% by 2050 — long-run rental-demand tailwind backs the buy-and-hold thesis.
Negotiation context
- Only 6 days on market — expect competitive offers; lowballing is unlikely to land.
Risks & watch-outs
- Watch-outs: built in 1908 — expect roof / HVAC / electrical / plumbing capex.
Questions for the listing agent
- Can we see the unit-by-unit rent roll, current vacancy, and any below-market leases? What's the average tenancy length?
- What capital expenditures (roof, boiler, parking lot, exteriors) have been made in the last 5 years, and what's planned in the next 2?
- Built in 1908 — when were the roof, HVAC, electrical panel, plumbing, and water heater last replaced?
- Is there a deadline driving the sale (1031 exchange, divorce, estate, relocation)? That informs how much negotiation room exists.
- Schools are B-rated — typically a magnet for longer-tenancy family renters. What's the average tenant stay here, and is there a school-zone premium baked into asking?
- Crime grade is F in this area — have there been break-ins, vandalism, or insurance claims at this property in the last 3 years? What carrier currently insures it and at what premium?
- What's the average days-on-market for RENTAL listings here right now (not sales)? A rising rental-DOM trend means longer vacancies and softer asking-rent achievability than the comps imply.
- What's the recent tenant-quality profile in this submarket — average credit score on applications, eviction rate, late-payment / NSF rate, and stable-employment percentage? A property-management company in the area should have these aggregated.
- How much new apartment / multifamily construction is in the pipeline within 1–3 miles? Heavy new supply (>2% of stock underway) typically softens rents 12–24 months out; light construction supports rent growth.
Investment metrics
- 1% rule
- 1.06% ✓
- Cap rate
- 8.40%
- Cash-on-cash
- 7.51%
- DSCR
- 1.33
- GRM
- 7.9
CMA / ARV
- ARV (on-the-fly)
- $715,904
- Comps found
- 2
Show comp detail 2 sales within ~0.75 mi
| Address | Dist | Beds/Ba | Sqft | Sold | Price | $/sf | Match |
|---|---|---|---|---|---|---|---|
| 2410 S I St | 0.50mi | 8/4.0 | 3,008 (-6%) | 14mo | $655,000 | $218 | 47 |
| 2412 S I St | 0.51mi | 8/4.0 | 3,008 (-6%) | 14mo | $675,000 | $224 | 46 |
Match score weights: distance 35% · size 25% · config 20% · recency 20%. Top-matched comps best support the ARV.
Projected returns pro-forma
-3.0% appreciation · 3.9% rent growth · sell at horizon
- IRR
- -3.8%
- Equity multiple
- 0.85×
- Total profit
- $-29,753
- Equity at exit
- $108,838
- IRR
- 6.8%
- Equity multiple
- 1.53×
- Total profit
- $108,427
- Equity at exit
- $63,113
Cash invested: $204,386 (down + closing). Projections, not guarantees.
Landlord ↔ Tenant lean methodology
- Overall (STATE)
- 28 Tenant-Leaning
- State Washington
- 28 Tenant-Leaning · D+8
- County
- — inherits STATE
- City
- — inherits STATE
ZIP-level market 98405
- Rents YoY
- 3.9%
- Active inventory
- 122
- Price-to-rent
- 31.5×
Monthly cashflow live
- Estimated rent
- $7,721 high interval (Pro) →
- Mortgage (P&I)
- −$3,828
- Tax from tax record
- −$688 /mo · $8,255/yr
- Insurance
- −$304
- HOA
- −$0
- Vacancy / Maint / Mgmt
- −$1,621
- Net cashflow
- $1,280
Break-even live
4-unit breakdown (identical units grouped — click to expand)
| Units | Beds | Baths | Est. rent |
|---|---|---|---|
| 4× units | 2 | 1 | $7,720 |
| #1 | 2 | 1 | $1,930 |
| #2 | 2 | 1 | $1,930 |
| #3 | 2 | 1 | $1,930 |
| #4 | 2 | 1 | $1,930 |
| Total (4 units) | $7,721 | ||
UW: 25.0% down · 7.5% · 30yr · 1.5% tax · 5.0% vac · 8.0% maint · 8.0% mgmt
Financing live
Cash to close
- Down payment
- $182,488
- Closing costs
- $21,898
- Reserves months
- —
- Total cash needed
- —
Loan-product check · same deal, 3 products live
Conventional
25% down · 7.5% · 30yr
- Down + closing
- —
- Monthly P&I
- —
- Monthly cashflow
- —
- DSCR
- —
- Eligible?
- —
Personal DTI + credit; lowest rate.
DSCR
20% down · 8.5% · 30yr
- Down + closing
- —
- Monthly P&I
- —
- Monthly cashflow
- —
- DSCR
- —
- Eligible?
- —
No personal income docs; deal must DSCR.
Hard money
10% down · 12.0% · 12mo
- Down + closing
- —
- Monthly P&I
- —
- Monthly cashflow
- —
- DSCR
- —
- Eligible?
- —
Short-term bridge; refi at stabilization.
Listing history 6 events
-
2026-06-18days on market $729,950 Active 6 DOM
-
2026-06-17days on market $729,950 Active 5 DOM
-
2026-06-16days on market $729,950 Active 4 DOM
-
2026-06-15days on market $729,950 Active 3 DOM
-
2026-06-13remarks 699-char remark
-
2026-06-13$729,950 Active 1 DOM
ⓘ Source: listings_history table (triggers on properties + properties_extension) + one-shot
backfill from property_details.listing_events for pre-trigger history.
Tax reassessment forecast WA · Resets to sale price
- Current annual tax
- $8,255 · $688/mo
- Projected year-2 tax
- $8,255 · $688/mo
- Expected delta
- $0/yr ($0/mo · 0.0%)
ⓘ Screening estimate from a state-policy table — verify with the county assessor before closing.
Climate risk First Street
- Flood 1/10 Low FEMA zone X (unshaded) · 0% chance over 30 yrs
- Wildfire 1/10 Low
- Heat 3/10 Moderate 7 d/yr ≥87°F today · 15 d/yr by 30 yrs out
- Wind 1/10 Low
- Air quality 7/10 Severe 10 unhealthy d/yr today · 12 by 30 yrs out
Nearby sold comps map
Loading sold comps map…
Walkable amenities ~0.75 mi
Loading nearby amenities…
Taxation est. · year 1
- Rental income
- $92,652
- − Mortgage interest
- −$40,889
- − Property taxes
- −$8,255
- − Insurance
- −$3,650
- − Repairs & maintenance
- −$7,412
- − Management
- −$7,412
- − Depreciation
- −$21,235
- Taxable income
- $3,799
- Est. tax owed @ 24.0%
- −$912
- After-tax cash flow
- $14,443/yr
For passive investors: Depreciation is non-cash, so a rental often shows a tax loss while cash-flowing — sheltering income. Rental losses are passive: they offset passive income freely, and up to $25,000/yr can offset ordinary (W-2) income if you actively participate and your MAGI is under $100k (phasing out to $0 by $150k); unused losses carry forward. On sale, claimed depreciation is recaptured at up to 25%, and gains may owe capital-gains tax (a 1031 exchange can defer both). Figures are a year-1 estimate at your 24.0% rate — not tax advice; consult a CPA.
Schools (NCES district)
- District
- Tacoma School District
- NCES district ID
- 5308700
- Math proficiency
- 40% ▬ 0.00%
- Reading proficiency
- 53% ▲ 1.00%
- Median HH income
- $52,467
- Composite
- 42.25/100
- National rank
- #6987
- State rank
- #169 of 291 in WA
Livability — Tacoma
- Score
- 78/100
- State rank
- #127
- US rank
- #2535
Category grades
Schools grade is shown separately in the Schools card above.
Census & demographics
- Census place
- Tacoma, WA
- County
- Pierce County · 788,257 people
- City population
- 212,935
- Metro
- Seattle-Tacoma-Bellevue, WA
- Population (ZIP)
- 25,939
- Household income
- $75,946
- Rent vs Own
- Severe rent burden
- 1313.0
Population outlook (Pierce County) Hauer SSP2
- Today (2025)
- 956,648 people
- By 2030
- 1,010,862 · +5.7%
- By 2040
- 1,113,170 · +16.4%
- By 2050
- 1,206,524 · +26.1%
- By 2075
- 1,436,425 · +50.2%
- By 2100
- 1,563,654 · +63.5%
Race, ethnicity, and origin ACS 2023
- Neighborhood character
- Diverse neighborhood (Simpson 0.63)
- Race & ethnicity
- White 58% Two or more races 16% Black 13% Hispanic / Latino 11% Asian 5%
- Hispanic origin (detail)
- Mexican 9% Puerto Rican 1%
- Common ancestry
- Portuguese 4% Scottish 3% Slovak 3%
- Foreign-born
- 8% · Canada, Vietnam
- Languages at home
- 88% English-only · Spanish 6% Vietnamese 2% Russian/Polish/Slavic 1%
Political lean MEDSL · Pierce
- 2024 margin
- D (+10.8) · D 53.9% · R 43.1% · Other 3.0%
- 2008→2024 swing
- -1.4pp toward R · 2008: 12.2pp · 2024: 10.8pp
- All cycles
- 2024: D+10.8 2020: D+11.2 2016: D+7.5 2012: D+11.0 2008: D+12.2
Not yet ingested
- Civics
- —
Market trends
- HPI YoY
- ▼ -570.22%
- Current HPI
- 378.3973
- Rent YoY
- ▲ 3.90%
- Metro
- Seattle-Tacoma-Bellevue, WA
- State GDP YoY
- ▲ 4.65%
- F500 in state
- 22
Industry mix (Fortune 500 HQ in WA)
| Industry | F500 HQs | Revenue |
|---|---|---|
| Retail | 2 | $269B |
|
||
| Technology / Retail | 1 | $638B |
|
||
| Technology | 1 | $245B |
|
||
| Telecommunications | 1 | $38B |
|
||
| Food / Beverage | 1 | $36B |
|
||
| Automotive / Trucks | 1 | $34B |
|
||
Price history
1 event — show timeline
- 2026-06-12 Listed $729,950 NWMLS as Distributed by MLS Grid
Property tax history
+5.2%/yrLatest (2026): $8,255 · +4.6% YoY. Source: county tax records.
Cash-flow waterfall
monthlySold comps — $/sqft
last 12 mo · ≤1 miLoading sold comps…