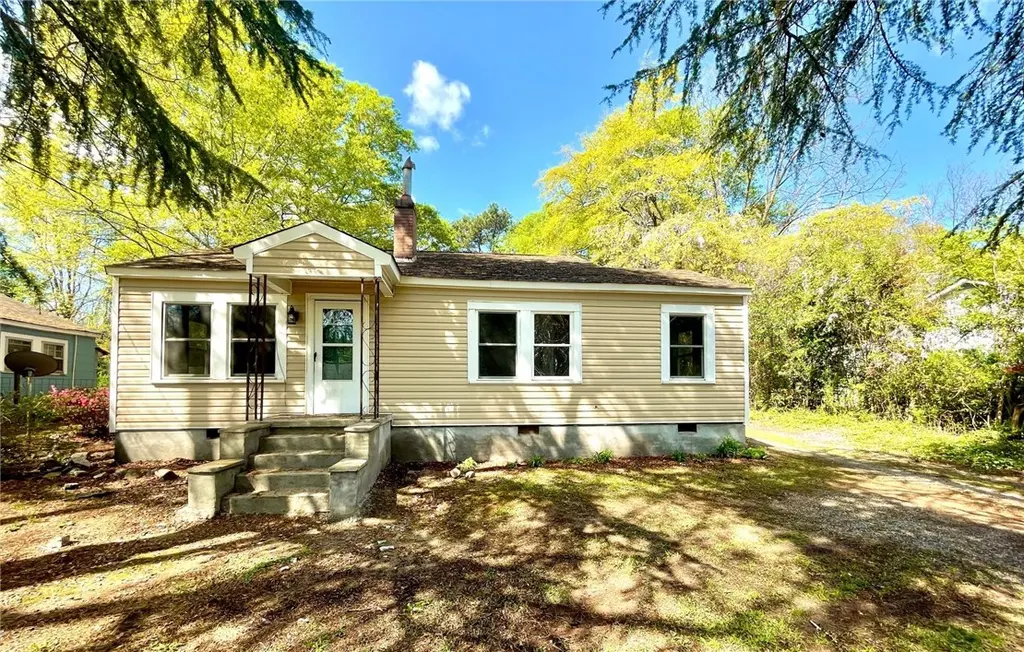
622 Martha Dr · Anderson, SC
Flood risk 1/10 · Minimal
- FEMA flood zone
- X (unshaded)
- Chance of flooding over 30 yrs
- 0.0%
- Est. flood insurance / yr
- $507 – $1,088
Fire risk 3/10 · Minor
- Est. fire insurance / yr
- $783 – $1,453
Heat risk 6/10 · Moderate
- Hot days now (above 105°F)
- 7 days/yr
- Hot days in 30 yrs
- 16 days/yr
Wind risk 3/10 · Minor
- Chance of severe wind over 30 yrs
- 5.0%
Air-quality risk 3/10 · Minor
- Unhealthy air days now
- 3 days/yr
- Unhealthy air days in 30 yrs
- 3 days/yr
Risk factors via First Street. Map © Google.
Why this score? — see what drove the C- grade
The composite is a weighted blend of 9 inputs, each scored 0–100. Each bar is that input's sub-score; the figure is the points it added to the 100-point composite (weight × sub-score).
- Cash flow +18.8/30.0
- ARV discount +7.5/15.0
- DSCR +5.9/10.0
- 1% rule +4.5/10.0
- Appreciation +4.0/10.0
- Schools +3.9/10.0
- Livability +3.4/5.0
- Rent growth +2.5/5.0
- Condition / age +2.5/5.0
$159,900
🖨 Deal sheet 📄 Offer letter ✓ Due diligence
Listing remarks
Calling all INVESTORS! Discover this charming 3-bedroom, 2-bathroom home tucked away in an established Anderson neighborhood. Featuring a bright and airy open-concept floor plan, the property effortlessly maximizes its living space. Outside, the large backyard offers endless possibilities—whether envisioned as an entertainment hub, a sprawling garden, or a secure play area. This property is currently operating as a successful rental. Rentals in this area go from $1500 to $1600 per month. The tenant is highly motivated to stay, providing the next owner with a seamless transition and immediate cash flow from day one. To respect the tenant's privacy, please do not go onto the property wi
Key facts
- Immediate cash flow
- Large backyard
- 0.3 acre lot
Tags
Property features AI
Finance
- Financial info: Other annual assessment: $1,667
Exterior
- Utilities: Public water; Public sewer
- Home design: Single-story home; Vinyl and wood siding; Architectural shingle roof
- Construction: Built within the last 21–30 years; Crawlspace foundation
- Exterior features: Level lot; Not in a subdivision; Located outside city limits
Interior
- Bedrooms: Three main-level bedrooms
- Flooring: Laminate, vinyl, and wood
- Bathrooms: Two full bathrooms (both on the main level)
- Heating & cooling: Central heating (gas); Central air conditioning (electric)
- Interior features: Crawl space basement; Laminate, vinyl, and wood flooring
Neighborhood map
What this means for you Summary
Snapshot
- This is a 2-bed/2.0-bath other listed at $160k.
Deal economics
- At list price, monthly cash flow is $162 ($2k/yr) — positive.
- The deal already cash-flows at list — no discount required.
- To meet the 1% rule (rent ≥ 1% of price), the offer needs to be $153k (4.5% below list).
- Recommended offer: $153k (4.5% below list) — sets the bar for 1% rule.
- Cap rate 7.5% vs local median 3.3% in Anderson — top-decile yield for the area; either an underpriced asset or a hidden risk that comps aren't pricing in. Stress-test before assuming the spread holds.
Location & tenants
- Location reads 67/100 on livability (#98 in SC) — a middle-class / working-renter tenant base. Strengths: cost of living A+, health & safety A+, housing B+; Watch: amenities C-, schools D+, crime F.
- Anderson 05 (suburban): math 44% / reading 49% proficiency, ranked #20 of 80 in SC (top 25%) — families likely to look elsewhere, expect single-tenant / working-renter base with shorter leases.
- Market conditions: 114 active listings in the ZIP; 3 comparable units currently listed for rent nearby; rentals leasing fast (median 3d on market — plan ~1-2 weeks tenant-placement turnaround); lower-income renter base — watch delinquency; 1,255 units permitted in Anderson County in 2024 (0 in 5+ unit buildings).
- At $1,526/mo this rent would consume 60% of the median local household income ($31k/yr) (locally 843% of renters already pay >50% of income on rent) — very limited rent-growth headroom before tenants either downsize or default.
Forward outlook
- Local home prices are declining (-2.1%/yr); year-one equity from $1k of loan paydown is wiped out by about $3k of value loss. Plan a longer hold.
- Anderson County population projected at +14% by 2050 — modest demand growth; plan on rents tracking national, not racing it.
Negotiation context
- It's been on market 28 days — a 2% lower offer ($158k) is reasonable based on typical stale-listing flexibility.
- 3 sale attempts with the ask held roughly flat each time — persistent listings suggest the price (not the market) is what's stuck; bring a comps-based counter.
- Current owner paid $8k; list at $160k implies a 1899% gain — meaningful room to come down on a strong offer.
Risks & watch-outs
- Climate carrying-cost: extreme-heat days projected 7→16/yr by 2055 (HVAC capex compounding) — expect insurance premiums to compound above CPI over the hold.
Questions for the listing agent
- Is there a deadline driving the sale (1031 exchange, divorce, estate, relocation)? That informs how much negotiation room exists.
- Schools are D-rated, which usually means shorter tenancies and higher turnover. Who's the typical renter profile here, and what's been the actual vacancy rate?
- Crime grade is F in this area — have there been break-ins, vandalism, or insurance claims at this property in the last 3 years? What carrier currently insures it and at what premium?
- What's the average days-on-market for RENTAL listings here right now (not sales)? A rising rental-DOM trend means longer vacancies and softer asking-rent achievability than the comps imply.
- What's the recent tenant-quality profile in this submarket — average credit score on applications, eviction rate, late-payment / NSF rate, and stable-employment percentage? A property-management company in the area should have these aggregated.
- How much new for-sale + rental construction is in the pipeline within 1–3 miles? Heavy new supply typically softens prices + rents 12–24 months out; constrained supply supports both.
Investment metrics
- 1% rule
- 0.95% ✗
- Cap rate
- 7.51%
- Cash-on-cash
- 4.33%
- DSCR
- 1.19
- GRM
- 8.7
CMA / ARV
No comps found within radius.
Projected returns pro-forma
-2.06% appreciation · 3.0% rent growth · sell at horizon
- IRR
- -5.1%
- Equity multiple
- 0.79×
- Total profit
- $-9,254
- Equity at exit
- $30,618
- IRR
- 2.9%
- Equity multiple
- 1.24×
- Total profit
- $10,810
- Equity at exit
- $25,751
Cash invested: $44,772 (down + closing). Projections, not guarantees.
Landlord ↔ Tenant lean methodology
- Overall (STATE)
- 90 Strongly Landlord-Friendly
- State South Carolina
- 90 Strongly Landlord-Friendly · R+6
- County
- — inherits STATE
- City
- — inherits STATE
ZIP-level market 29624
- Home prices YoY
- -0.5%
- Active inventory
- 114
- Price-to-rent
- 8.7×
Monthly cashflow live
- Estimated rent
- $1,526 medium interval (Pro) →
- Mortgage (P&I)
- −$839
- Tax from tax record
- −$139 /mo · $1,667/yr
- Insurance
- −$67
- HOA
- −$0
- Vacancy / Maint / Mgmt
- −$321
- Net cashflow
- $162
Break-even live
UW: 25.0% down · 7.5% · 30yr · 1.5% tax · 5.0% vac · 8.0% maint · 8.0% mgmt
Financing live
Cash to close
- Down payment
- $39,975
- Closing costs
- $4,797
- Reserves months
- —
- Total cash needed
- —
Loan-product check · same deal, 3 products live
Conventional
25% down · 7.5% · 30yr
- Down + closing
- —
- Monthly P&I
- —
- Monthly cashflow
- —
- DSCR
- —
- Eligible?
- —
Personal DTI + credit; lowest rate.
DSCR
20% down · 8.5% · 30yr
- Down + closing
- —
- Monthly P&I
- —
- Monthly cashflow
- —
- DSCR
- —
- Eligible?
- —
No personal income docs; deal must DSCR.
Hard money
10% down · 12.0% · 12mo
- Down + closing
- —
- Monthly P&I
- —
- Monthly cashflow
- —
- DSCR
- —
- Eligible?
- —
Short-term bridge; refi at stabilization.
Rent comps 3 comps
| Address | Beds | Baths | Sqft | Rent | $/sqft | DOM | Units | Dist |
|---|---|---|---|---|---|---|---|---|
| 1208 W Whitner St Anderson, SC | 3.0 | 2.0 | 1432 | $1,450 | $1.01 | 14d | 1 | 1.15mi |
| 201 S Murray Ave Anderson, SC | 1.0–2.0 | 1.0–2.0 | 1010 | $2,200 | $2.18 | 3d | 1 | 1.20mi |
| 203B Cromer Rd Anderson, SC | 2.0 | 1.5 | 1000 | $1,395 | $1.40 | 3d | 1 | 1.47mi |
Listing history 21 events
-
2026-06-18days on market $159,900 Active 28 DOM
-
2026-06-17days on market $159,900 Active 27 DOM
-
2026-06-16days on market $159,900 Active 26 DOM
-
2026-06-15days on market $159,900 Active 25 DOM
-
2026-06-13pricedays on market $159,900 Active 23 DOM
-
2026-06-10days on market $165,000 Active 20 DOM
-
2026-06-09days on market $165,000 Active 19 DOM
-
2026-06-08days on market $165,000 Active 18 DOM
-
2026-06-07days on market $165,000 Active 17 DOM
-
2026-06-05days on market $165,000 Active 14 DOM
-
2026-06-03days on market $165,000 Active 13 DOM
-
2026-06-03days on market $165,000 Active 12 DOM
-
2026-06-01days on market $165,000 Active 11 DOM
-
2026-05-31days on market $165,000 Active 10 DOM
-
2026-05-21$165,000 Active
-
2025-09-16historical
-
2025-07-24status Active
-
2025-05-07price $165,000
-
2025-04-30$170,000 Active
-
1994-01-20soldstatus $8,000
-
1994-01-19soldstatus $13,500
ⓘ Source: listings_history table (triggers on properties + properties_extension) + one-shot
backfill from property_details.listing_events for pre-trigger history.
Tax reassessment forecast SC · Resets to sale price
- Current annual tax
- $1,667 · $139/mo
- Projected year-2 tax
- $1,667 · $139/mo
- Expected delta
- $0/yr ($0/mo · 0.0%)
ⓘ Screening estimate from a state-policy table — verify with the county assessor before closing.
Climate risk First Street
- Flood 1/10 Low FEMA zone X (unshaded) · 0% chance over 30 yrs
- Wildfire 3/10 Moderate
- Heat 6/10 Major 7 d/yr ≥105°F today · 16 d/yr by 30 yrs out
- Wind 3/10 Moderate 5% chance of damaging wind over 30 yrs
- Air quality 3/10 Moderate 3 unhealthy d/yr today · 3 by 30 yrs out
Nearby sold comps map
Loading sold comps map…
Walkable amenities ~0.75 mi
Loading nearby amenities…
Taxation est. · year 1
- Rental income
- $18,316
- − Mortgage interest
- −$8,957
- − Property taxes
- −$1,667
- − Insurance
- −$800
- − Repairs & maintenance
- −$1,465
- − Management
- −$1,465
- − Depreciation
- −$4,652
- Taxable loss
- −$690
- Est. tax savings @ 24.0%
- +$165
- After-tax cash flow
- $2,106/yr
For passive investors: Depreciation is non-cash, so a rental often shows a tax loss while cash-flowing — sheltering income. Rental losses are passive: they offset passive income freely, and up to $25,000/yr can offset ordinary (W-2) income if you actively participate and your MAGI is under $100k (phasing out to $0 by $150k); unused losses carry forward. On sale, claimed depreciation is recaptured at up to 25%, and gains may owe capital-gains tax (a 1031 exchange can defer both). Figures are a year-1 estimate at your 24.0% rate — not tax advice; consult a CPA.
Schools (NCES district)
- District
- Anderson 05
- NCES district ID
- 4500900
- Math proficiency
- 44% ▼ -4.00%
- Reading proficiency
- 49% ▲ 2.00%
- Median HH income
- $39,718
- Composite
- 38.89/100
- National rank
- #4098
- State rank
- #20 of 80 in SC
Livability — Anderson
- Score
- 67/100
- State rank
- #98
- US rank
- #10772
Category grades
Schools grade is shown separately in the Schools card above.
Census & demographics
- County
- Anderson County · 99,076 people
- City population
- 87,992
- Metro
- Greenville-Anderson, SC
- Population (ZIP)
- 13,498
- Household income
- $30,549
- Rent vs Own
- Severe rent burden
- 843.0
Population outlook (Anderson County) Hauer SSP2
- Today (2025)
- 210,546 people
- By 2030
- 217,791 · +3.4%
- By 2040
- 230,643 · +9.5%
- By 2050
- 240,220 · +14.1%
- By 2075
- 259,518 · +23.3%
- By 2100
- 258,696 · +22.9%
Race, ethnicity, and origin ACS 2023
- Neighborhood character
- Diverse neighborhood (Simpson 0.63)
- Race & ethnicity
- White 44% Black 41% Hispanic / Latino 10% Two or more races 7%
- Hispanic origin (detail)
- Mexican 6%
- Common ancestry
- Serbian 1% Lithuanian 1% Italian 1%
- Foreign-born
- 3% · Canada
- Languages at home
- 95% English-only · Spanish 4%
Political lean MEDSL · Anderson
- 2024 margin
- Solid R (+47.4) · D 25.7% · R 73.1% · Other 1.2%
- 2008→2024 swing
- -14.1pp toward R · 2008: -33.3pp · 2024: -47.4pp
- All cycles
- 2024: R+47.4 2020: R+42.0 2016: R+43.7 2012: R+36.4 2008: R+33.3
Not yet ingested
- Civics
- —
Market trends
- HPI YoY
- ▼ -2.06%
- Current HPI
- 406.0533
- Rent YoY
- —
- Metro
- Greenville-Anderson, SC
- State GDP YoY
- ▲ 4.51%
- F500 in state
- 2
Industry mix (Fortune 500 HQ in SC)
| Industry | F500 HQs | Revenue |
|---|---|---|
| Packaging | 1 | $7B |
|
||
Price history
+1122.2% since first listed7 events — show timeline
- 2026-05-21 Listed $165,000 WUMLS
- 2025-09-16 Listing Removed — WUMLS
- 2025-07-24 Relisted — WUMLS
- 2025-05-07 Price Changed $165,000 WUMLS
- 2025-04-30 Listed $170,000 WUMLS
- 1994-01-20 Sold (Public Records) $8,000 Public Records
- 1994-01-19 Sold (Public Records) $13,500 Public Records
Property tax history
+17.3%/yrLatest (2025): $1,667 · +587.8% YoY. Source: county tax records.
Cash-flow waterfall
monthlySold comps — $/sqft
last 12 mo · ≤1 miLoading sold comps…