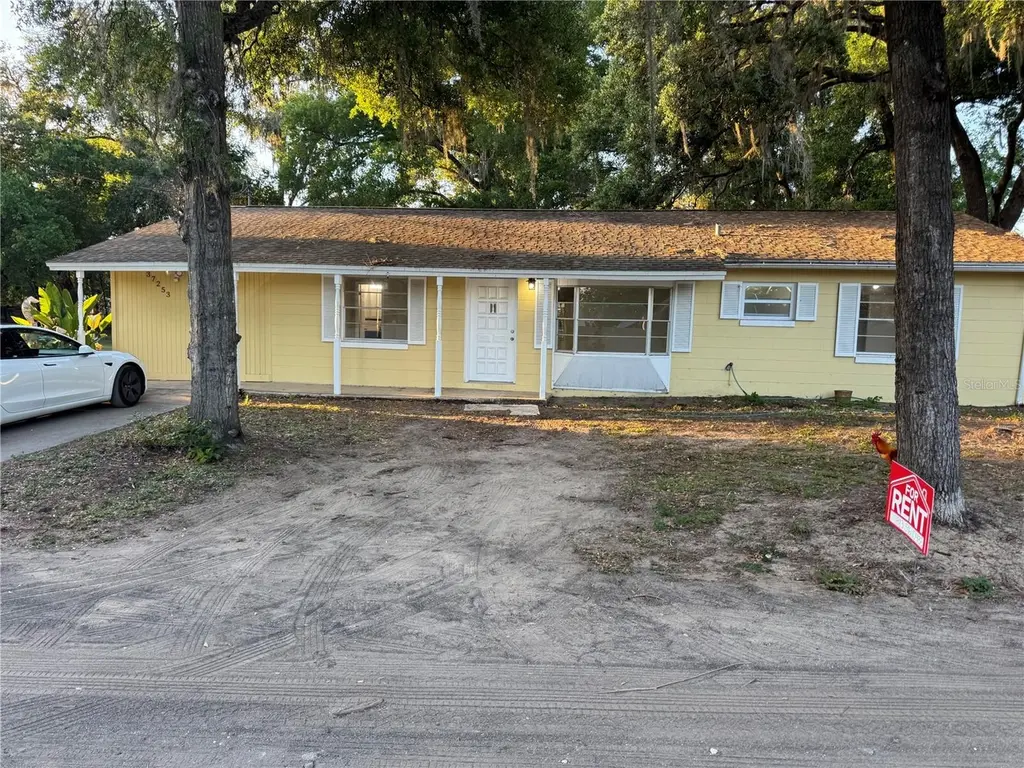
37253 Westview Ave · Dade City, FL
Flood risk 1/10 · Minimal
- FEMA flood zone
- X (unshaded)
- Chance of flooding over 30 yrs
- 0.0%
- Est. flood insurance / yr
- $507 – $1,088
Fire risk 3/10 · Minor
- Est. fire insurance / yr
- $947 – $1,759
Heat risk 9/10 · Severe
- Hot days now (above 109°F)
- 7 days/yr
- Hot days in 30 yrs
- 24 days/yr
Wind risk 9/10 · Severe
- Chance of severe wind over 30 yrs
- 99.0%
Air-quality risk 1/10 · Minimal
- Unhealthy air days now
- 0 days/yr
- Unhealthy air days in 30 yrs
- 0 days/yr
Risk factors via First Street. Map © Google.
Why this score? — see what drove the D- grade
The composite is a weighted blend of 9 inputs, each scored 0–100. Each bar is that input's sub-score; the figure is the points it added to the 100-point composite (weight × sub-score).
- Cash flow +11.4/30.0
- ARV discount +7.8/15.0
- Schools +4.3/10.0
- Livability +3.7/5.0
- DSCR +3.3/10.0
- Rent growth +3.3/5.0
- 1% rule +3.2/10.0
- Condition / age +2.5/5.0
- Appreciation +0.0/10.0
$286,000
🖨 Deal sheet 📄 Offer letter ✓ Due diligence
Listing remarks
Up for sale is a beautifully renovated 5 bedroom 2 bath home no HOA
Key facts
- 0.28 acre lot
- Built 1978
- Listed 17 days
Property features AI
Finance
- Other: Property type: Residential — Single Family Residence; Zoning: X; Universal property ID on record; Directions provided to property
- Financial info: No lease restrictions
- HOA & community: No association fees
Exterior
- Utilities: Public water; Public sewer; Other utilities; Electric water heater
- Home design: Single-family residence; One story; Faces south; Entry level: One
- Construction: Block and concrete construction; Shingle roof; Slab foundation; Built area approximately 1,556 total (living area appraiser-sourced 1,269)
- Exterior features: Dirt and gravel road access; Lot approximately 0.28 acres (1/4 to less than 1/2 acre)
Interior
- Kitchen: Range; Microwave; Refrigerator
- Bedrooms: 5 bedrooms
- Flooring: Tile
- Bathrooms: 2 full bathrooms
- Heating & cooling: Central heating; Central air conditioning
- Interior features: Thermostat; Walk-in closet(s)
- Laundry & utility: Dedicated laundry room; Electric water heater
Neighborhood map
What this means for you Summary
Snapshot
- This is a 3-bed/2.0-bath single-family listed at $286k.
Deal economics
- At list price, monthly cash flow is $-100 ($-1k/yr) — negative.
- To cash-flow at today's rent, offer at most $268k (6.2% below list).
- To meet the 1% rule (rent ≥ 1% of price), the offer needs to be $235k (17.7% below list).
- Recommended offer: $235k (17.7% below list) — sets the bar for 1% rule.
- Cap rate 5.9% vs local median 4.6% in Dade City — meaningfully above typical; check what's discounted (condition, days-on-market, listing class) to confirm the premium yield is real.
Location & tenants
- Location reads 73/100 on livability (#307 in FL) — a middle-class / working-renter tenant base. Strengths: cost of living A+, housing A+, health & safety A+; Watch: employment C-, schools D+, amenities F.
- Pasco (suburban): math 50% / reading 52% proficiency, ranked #32 of 73 in FL (top 44%) — acceptable for families but not a draw, mixed tenant base, ~2y average lease.
- Market conditions: Rents rising (+3.0%/yr); 667 active listings in the ZIP; 20 comparable units currently listed for rent nearby; rentals at typical pace (median 15d on market — plan ~3-4 weeks tenant-placement turnaround); 6,765 units permitted in Pasco County in 2024 (1,250 in 5+ unit buildings).
- This rent runs 41% of the median local income ($69k/yr) — at the standard rent-burdened threshold; future hikes will face affordability resistance.
Forward outlook
- Local home prices are declining (-3.0%/yr); year-one equity from $2k of loan paydown is wiped out by about $9k of value loss. Plan a longer hold.
- Pasco County population projected at +29% by 2050 — long-run rental-demand tailwind backs the buy-and-hold thesis.
Negotiation context
- It's been on market 18 days — a 2% lower offer ($282k) is reasonable based on typical stale-listing flexibility.
- 3 sale attempts since 7y ago with the ask held roughly flat each time — persistent listings suggest the price (not the market) is what's stuck; bring a comps-based counter.
- Current owner paid $100k; list at $286k implies a 186% gain — meaningful room to come down on a strong offer.
Risks & watch-outs
- Climate carrying-cost: severe wind risk, 99% chance of damaging wind over 30y; extreme-heat days projected 7→24/yr by 2055 (HVAC capex compounding) — expect insurance premiums to compound above CPI over the hold.
Questions for the listing agent
- What do current leases actually rent for vs. the listed asking? Can we see a recent rent roll and the last 12 months of T-12 income?
- Built in 1978 — when were the roof, HVAC, electrical panel, plumbing, and water heater last replaced?
- Is there a deadline driving the sale (1031 exchange, divorce, estate, relocation)? That informs how much negotiation room exists.
- Schools are D-rated, which usually means shorter tenancies and higher turnover. Who's the typical renter profile here, and what's been the actual vacancy rate?
- The area grade is low — what's the realistic commute time and amenity access for the typical tenant pool here? Any planned neighborhood developments (good or bad) we should know about?
- What's the average days-on-market for RENTAL listings here right now (not sales)? A rising rental-DOM trend means longer vacancies and softer asking-rent achievability than the comps imply.
- What's the recent tenant-quality profile in this submarket — average credit score on applications, eviction rate, late-payment / NSF rate, and stable-employment percentage? A property-management company in the area should have these aggregated.
- How much new for-sale + rental construction is in the pipeline within 1–3 miles? Heavy new supply typically softens prices + rents 12–24 months out; constrained supply supports both.
Investment metrics
- 1% rule
- 0.82% ✗
- Cap rate
- 5.87%
- Cash-on-cash
- -1.50%
- DSCR
- 0.93
- GRM
- 10.1
CMA / ARV
- ARV (on-the-fly)
- $288,063
- Comps found
- 12
Show comp detail 12 sales within ~0.75 mi
| Address | Dist | Beds/Ba | Sqft | Sold | Price | $/sf | Match |
|---|---|---|---|---|---|---|---|
| 37236 Poinsettia Ave | 0.16mi | 3/2.0 | 1,304 (+3%) | 5mo | $135,000 | $104 | 84 |
| 14348 Graham St | 0.70mi | 3/2.0 | 1,246 (-2%) | 4mo | $295,000 | $237 | 61 |
| 37950 Coleman Ave | 0.69mi | 3/2.0 | 1,311 (+3%) | 5mo | $330,000 | $252 | 58 |
| 37153 Mcminn Ave | 0.39mi | 3/2.0 | 1,144 (-10%) | 11mo | $325,000 | $284 | 56 |
| 37049 Suwanee Way | 0.61mi | 3/2.0 | 1,340 (+6%) | 8mo | $240,000 | $179 | 56 |
| 37137 Florida Ave | 0.23mi | 3/2.0 | 1,441 (+14%) | 14mo | $335,000 | $232 | 55 |
| 13922 12th St | 0.40mi | 3/2.0 | 1,386 (+9%) | 13mo | $209,000 | $151 | 55 |
| 37722 Granada Ave | 0.49mi | 3/2.0 | 1,144 (-10%) | 9mo | $260,000 | $227 | 54 |
| 37644 Florida Ave | 0.43mi | 3/2.0 | 1,418 (+12%) | 9mo | $344,900 | $243 | 53 |
| 38011 Dixie Ave | 0.74mi | 3/2.0 | 1,176 (-7%) | 3mo | $193,405 | $164 | 50 |
| 36547 Jackson Ave | 0.74mi | 3/2.0 | 1,102 (-13%) | 3mo | $232,000 | $211 | 42 |
| 14141 11th St | 0.61mi | 3/2.5 | 1,439 (+13%) | 12mo | $300,000 | $208 | 37 |
Match score weights: distance 35% · size 25% · config 20% · recency 20%. Top-matched comps best support the ARV.
Projected returns pro-forma
-3.0% appreciation · 3.02% rent growth · sell at horizon
- IRR
- -18.7%
- Equity multiple
- 0.34×
- Total profit
- $-52,649
- Equity at exit
- $42,644
- IRR
- -11.1%
- Equity multiple
- 0.33×
- Total profit
- $-53,759
- Equity at exit
- $24,728
Cash invested: $80,080 (down + closing). Projections, not guarantees.
Landlord ↔ Tenant lean methodology
- Overall (STATE)
- 87 Strongly Landlord-Friendly
- State Florida
- 87 Strongly Landlord-Friendly · R+3
- County
- — inherits STATE
- City
- — inherits STATE
ZIP-level market 33525
- Home prices YoY
- -15.4%
- Rents YoY
- 3.0%
- Active inventory
- 667
- Price-to-rent
- 10.1×
Monthly cashflow live
- Estimated rent
- $2,355 high interval (Pro) →
- Mortgage (P&I)
- −$1,500
- Tax from tax record
- −$341 /mo · $4,097/yr
- Insurance
- −$119
- HOA
- −$0
- Vacancy / Maint / Mgmt
- −$495
- Net cashflow
- $-100
Break-even live
UW: 25.0% down · 7.5% · 30yr · 1.5% tax · 5.0% vac · 8.0% maint · 8.0% mgmt
Financing live
Cash to close
- Down payment
- $71,500
- Closing costs
- $8,580
- Reserves months
- —
- Total cash needed
- —
Loan-product check · same deal, 3 products live
Conventional
25% down · 7.5% · 30yr
- Down + closing
- —
- Monthly P&I
- —
- Monthly cashflow
- —
- DSCR
- —
- Eligible?
- —
Personal DTI + credit; lowest rate.
DSCR
20% down · 8.5% · 30yr
- Down + closing
- —
- Monthly P&I
- —
- Monthly cashflow
- —
- DSCR
- —
- Eligible?
- —
No personal income docs; deal must DSCR.
Hard money
10% down · 12.0% · 12mo
- Down + closing
- —
- Monthly P&I
- —
- Monthly cashflow
- —
- DSCR
- —
- Eligible?
- —
Short-term bridge; refi at stabilization.
Rent comps 20 comps
| Address | Beds | Baths | Sqft | Rent | $/sqft | DOM | Units | Dist |
|---|---|---|---|---|---|---|---|---|
| 13911 19th St Dade City, FL | 2.0 | 1.0 | 1600 | $1,495 | $0.93 | 3d | 1 | 0.30mi |
| 13911 19th St Dade City, FL | 2.0 | 1.0 | 1600 | $1,495 | $0.93 | 4d | 1 | 0.30mi |
| 13921 19th St Unit 1234474P Dade City, FL | 2.0 | 1.0 | 936 | $2,013 | $2.15 | 16d | 1 | 0.30mi |
| 37215 Grassy Hill Ln Dade City, FL | 3.0 | 2.0 | 1212 | $1,495 | $1.23 | 24d | 1 | 0.46mi |
| 37135 Grassy Hill Ln Unit 1234475P Dade City, FL | 3.0 | 2.0 | 1205 | $3,535 | $2.93 | 2d | 1 | 0.48mi |
| 37135 Grassy Hill Ln Unit 1 Dade City, FL | 3.0 | 2.0 | 1212 | $3,500 | $2.89 | 24d | 1 | 0.48mi |
| 37228 Grassy Hill Ln Unit 1 Dade City, FL | 3.0 | 2.0 | 1212 | $1,750 | $1.44 | 3d | 1 | 0.48mi |
| 37132 Grassy Hill Ln Unit 1234477P Dade City, FL | 3.0 | 2.0 | 1205 | $3,594 | $2.98 | 2d | 1 | 0.50mi |
| 37132 Grassy Hill Ln Unit 1 Dade City, FL | 3.0 | 2.0 | 1212 | $3,500 | $2.89 | 24d | 1 | 0.50mi |
| 37329 Magnolia Ave Unit 1234471P Dade City, FL | 3.0 | 2.0 | 1216 | $3,391 | $2.79 | 4d | 1 | 0.60mi |
| 13650 5th St Dade City, FL | 2.0 | 1.0 | 900 | $1,350 | $1.50 | 12d | 1 | 0.71mi |
| 13917 2nd St Dade City, FL | 3.0 | 1.0 | 1312 | $1,950 | $1.49 | 24d | 1 | 0.89mi |
| 36350 Spanish Rose Dr Dade City, FL | 4.0 | 2.0 | 1828 | $2,149 | $1.18 | 4d | 1 | 0.93mi |
| 14635 State St Dade City, FL | 3.0 | 1.5 | 1040 | $1,761 | $1.69 | 21d | 1 | 0.98mi |
| 37802 Whitehouse Ave Dade City, FL | 2.0 | 1.0 | 1344 | $1,150 | $0.86 | 23d | 1 | 1.17mi |
| 12945 Ogden Glade Rd Dade City, FL | 4.0 | 2.0 | 1815 | $2,195 | $1.21 | 17d | 1 | 1.31mi |
| 36132 Trinity Glade Rd Dade City, FL | 3.0 | 2.0 | 1515 | $2,425 | $1.60 | 14d | 1 | 1.33mi |
| 37011 Bear Branch Dr Dade City, FL | 3.0–4.0 | 2.0–3.0 | 1730 | $1,837 | $1.06 | 1d | 16 | 1.35mi |
| 13253 Waterford Castle Dr Dade City, FL | 3.0 | 2.0 | 1189 | $1,749 | $1.47 | 2d | 1 | 1.35mi |
| 37015 Waldo Dr Dade City, FL | 4.0 | 2.0 | 1480 | $3,750 | $2.53 | 24d | 1 | 1.47mi |
Listing history 24 events
-
2026-06-15days on market $286,000 Active 18 DOM
-
2026-06-13days on market $286,000 Active 16 DOM
-
2026-06-09days on market $286,000 Active 12 DOM
-
2026-06-08days on market $286,000 Active 11 DOM
-
2026-06-07days on market $286,000 Active 10 DOM
-
2026-06-04days on market $286,000 Active 7 DOM
-
2026-06-03days on market $286,000 Active 6 DOM
-
2026-06-02days on market $286,000 Active 5 DOM
-
2026-06-01days on market $286,000 Active 4 DOM
-
2026-05-31days on market $286,000 Active 3 DOM
-
2026-05-28$286,000 Active
-
2020-04-02soldstatus $100,000
-
2020-03-01historical
-
2020-02-26price $125,000
-
2020-02-21price $127,500
-
2020-02-18price $128,500
-
2020-02-10price $129,000
-
2020-02-03price $129,999
-
2020-01-29price $132,500
-
2020-01-21status Active
-
2020-01-20status Pending
-
2020-01-11price $135,000
-
2019-12-22$139,900 Active
-
1999-11-04soldstatus $74,000
ⓘ Source: listings_history table (triggers on properties + properties_extension) + one-shot
backfill from property_details.listing_events for pre-trigger history.
Tax reassessment forecast FL · Resets to sale price
- Current annual tax
- $4,097 · $341/mo
- Projected year-2 tax
- $4,097 · $341/mo
- Expected delta
- $0/yr ($0/mo · 0.0%)
ⓘ Screening estimate from a state-policy table — verify with the county assessor before closing.
Climate risk First Street
- Flood 1/10 Low FEMA zone X (unshaded) · 0% chance over 30 yrs
- Wildfire 3/10 Moderate
- Heat 9/10 Extreme 7 d/yr ≥109°F today · 24 d/yr by 30 yrs out
- Wind 9/10 Extreme 99% chance of damaging wind over 30 yrs
- Air quality 1/10 Low 0 unhealthy d/yr today · 0 by 30 yrs out
Nearby sold comps map
Loading sold comps map…
Walkable amenities ~0.75 mi
Loading nearby amenities…
Taxation est. · year 1
- Rental income
- $28,257
- − Mortgage interest
- −$16,020
- − Property taxes
- −$4,097
- − Insurance
- −$1,430
- − Repairs & maintenance
- −$2,261
- − Management
- −$2,261
- − Depreciation
- −$8,320
- Taxable loss
- −$6,131
- Est. tax savings @ 24.0%
- +$1,472
- After-tax cash flow
- $270/yr
For passive investors: Depreciation is non-cash, so a rental often shows a tax loss while cash-flowing — sheltering income. Rental losses are passive: they offset passive income freely, and up to $25,000/yr can offset ordinary (W-2) income if you actively participate and your MAGI is under $100k (phasing out to $0 by $150k); unused losses carry forward. On sale, claimed depreciation is recaptured at up to 25%, and gains may owe capital-gains tax (a 1031 exchange can defer both). Figures are a year-1 estimate at your 24.0% rate — not tax advice; consult a CPA.
Schools (NCES district)
- District
- Pasco
- NCES district ID
- 1201530
- Math proficiency
- 50% ▼ -10.00%
- Reading proficiency
- 52% ▼ -5.00%
- Median HH income
- $45,039
- Composite
- 43.14/100
- National rank
- #3074
- State rank
- #32 of 73 in FL
Livability — Dade City
- Score
- 73/100
- State rank
- #307
- US rank
- #5215
Category grades
Schools grade is shown separately in the Schools card above.
Census & demographics
- Census place
- Dade City, FL
- County
- Pasco County · 524,098 people
- City population
- 21,077
- Metro
- Tampa-St. Petersburg-Clearwater, FL
- Population (ZIP)
- 21,077
- Household income
- $69,068
- Rent vs Own
- Severe rent burden
- 322.0
Population outlook (Pasco County) Hauer SSP2
- Today (2025)
- 570,045 people
- By 2030
- 605,844 · +6.3%
- By 2040
- 674,806 · +18.4%
- By 2050
- 736,022 · +29.1%
- By 2075
- 862,900 · +51.4%
- By 2100
- 906,364 · +59.0%
Race, ethnicity, and origin ACS 2023
- Neighborhood character
- Predominantly White (76%)
- Race & ethnicity
- White 76% Hispanic / Latino 16% Two or more races 7% Black 3%
- Hispanic origin (detail)
- Mexican 9% Puerto Rican 3%
- Common ancestry
- Lithuanian 2% Romanian 2% Serbian 2%
- Foreign-born
- 6% · Canada, Jamaica
- Languages at home
- 87% English-only · Spanish 11% Other Asian/Pacific 1% Other Indo-European 1%
Political lean MEDSL · Pasco
- 2024 margin
- Strong R (+25.2) · D 36.9% · R 62.1% · Other 1.0%
- 2008→2024 swing
- -21.6pp toward R · 2008: -3.6pp · 2024: -25.2pp
- All cycles
- 2024: R+25.2 2020: R+20.1 2016: R+21.6 2012: R+6.7 2008: R+3.6
Not yet ingested
- Civics
- —
Market trends
- HPI YoY
- ▼ -65.48%
- Current HPI
- 358.2149
- Rent YoY
- ▲ 3.02%
- Metro
- Tampa-St. Petersburg-Clearwater, FL
- State GDP YoY
- ▲ 3.28%
- F500 in state
- 36
Industry mix (Fortune 500 HQ in FL)
| Industry | F500 HQs | Revenue |
|---|---|---|
| Industrial Technology | 2 | $29B |
|
||
| Insurance | 2 | $17B |
|
||
| Retail | 1 | $60B |
|
||
| Technology Distribution | 1 | $58B |
|
||
| Homebuilding | 1 | $35B |
|
||
| Technology Manufacturing | 1 | $35B |
|
||
Price history
+286.5% since first listed14 events — show timeline
- 2026-05-28 Listed $286,000 Stellar MLS as Distributed by MLS Grid
- 2020-04-02 Sold (Public Records) $100,000 Public Records
- 2020-03-01 Listing Removed — Stellar MLS as Distributed by MLS Grid
- 2020-02-26 Price Changed $125,000 Stellar MLS as Distributed by MLS Grid
- 2020-02-21 Price Changed $127,500 Stellar MLS as Distributed by MLS Grid
- 2020-02-18 Price Changed $128,500 Stellar MLS as Distributed by MLS Grid
- 2020-02-10 Price Changed $129,000 Stellar MLS as Distributed by MLS Grid
- 2020-02-03 Price Changed $129,999 Stellar MLS as Distributed by MLS Grid
- 2020-01-29 Price Changed $132,500 Stellar MLS as Distributed by MLS Grid
- 2020-01-21 Relisted — Stellar MLS as Distributed by MLS Grid
- 2020-01-20 Pending — Stellar MLS as Distributed by MLS Grid
- 2020-01-11 Price Changed $135,000 Stellar MLS as Distributed by MLS Grid
- 2019-12-22 Listed $139,900 Stellar MLS as Distributed by MLS Grid
- 1999-11-04 Sold (Public Records) $74,000 Public Records
Property tax history
+5.4%/yrLatest (2025): $4,097 · +7.5% YoY. Source: county tax records.
Cash-flow waterfall
monthlySold comps — $/sqft
last 12 mo · ≤1 miLoading sold comps…