 Multi-family
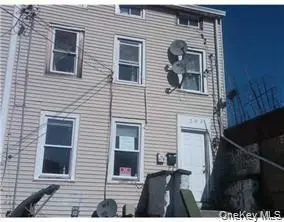
202 Ann St · Newburgh, NY
Flood risk 1/10 · Minimal
- FEMA flood zone
- X (unshaded)
- Chance of flooding over 30 yrs
- 0.0%
- Est. flood insurance / yr
- $473 – $860
Fire risk 3/10 · Minor
- Est. fire insurance / yr
- $691 – $1,283
Heat risk 5/10 · Moderate
- Hot days now (above 100°F)
- 7 days/yr
- Hot days in 30 yrs
- 16 days/yr
Wind risk 4/10 · Minor
- Chance of severe wind over 30 yrs
- 12.0%
Air-quality risk 3/10 · Minor
- Unhealthy air days now
- 2 days/yr
- Unhealthy air days in 30 yrs
- 3 days/yr
Risk factors via First Street. Map © Google.
Why this score? — see what drove the C grade
The composite is a weighted blend of 9 inputs, each scored 0–100. Each bar is that input's sub-score; the figure is the points it added to the 100-point composite (weight × sub-score).
- Cash flow +18.1/30.0
- ARV discount +14.7/15.0
- DSCR +5.7/10.0
- 1% rule +4.7/10.0
- Schools +3.5/10.0
- Livability +3.1/5.0
- Rent growth +2.7/5.0
- Condition / age +2.5/5.0
- Appreciation +0.0/10.0
$450,000
🖨 Deal sheet 📄 Offer letter ✓ Due diligence
Multi-family units
County records classify this as Multi-Family (2-4 Unit). Listing-text estimate: 1 unit. estimate disagrees with records
Listing remarks MLS
Great investment opportunity in good condition overall and fully rented. Low taxes. Close to shopping, restaurants, Hawys , and more Gross Income : $31,800.00
Key facts
- 1,800 sq ft lot
- Built 1950
- Listed 108 days
Neighborhood map
What this means for you Summary
Snapshot
- This is a 3-bed/2.0-bath multifamily listed at $450k.
Deal economics
- At list price, monthly cash flow is $394 ($5k/yr) — positive.
- The deal already cash-flows at list — no discount required.
- To meet the 1% rule (rent ≥ 1% of price), the offer needs to be $437k (2.8% below list).
- Recommended offer: $410k (9.0% below list) — sets the bar for market timing.
- Cap rate 7.3% vs local median 4.4% in Newburgh — top-decile yield for the area; either an underpriced asset or a hidden risk that comps aren't pricing in. Stress-test before assuming the spread holds.
Location & tenants
- Location reads 62/100 on livability (#878 in NY) — a middle-class / working-renter tenant base. Strengths: health & safety A+, housing B+, cost of living B; Watch: employment D+, schools D, crime F.
- Newburgh City School District (suburban): math 33% / reading 48% proficiency, ranked #500 of 590 in NY (top 85%) — families likely to look elsewhere, expect single-tenant / working-renter base with shorter leases; 61% free/reduced lunch — lower-income household profile, screen leases tightly.
- Market conditions: Rents flat; 383 active listings in the ZIP; 27 comparable units currently listed for rent nearby; rentals at typical pace (median 24d on market — plan ~3-4 weeks tenant-placement turnaround); 41% of comp listings sitting > 30 days — soft ceiling on asking rent; solid renter incomes; 1,746 units permitted in Orange County in 2024 (1,265 in 5+ unit buildings).
- At $4,373/mo this rent would consume 61% of the median local household income ($86k/yr) (locally 2412% of renters already pay >50% of income on rent) — very limited rent-growth headroom before tenants either downsize or default.
Forward outlook
- Local home prices are declining (-3.0%/yr); year-one equity from $3k of loan paydown is wiped out by about $14k of value loss. Plan a longer hold.
Negotiation context
- It's been on market 108 days — a 9% lower offer ($410k) is reasonable based on typical stale-listing flexibility.
- 3 sale attempts since 14y ago with the ask held roughly flat each time — persistent listings suggest the price (not the market) is what's stuck; bring a comps-based counter.
- Current owner paid $45k; list at $450k implies a 900% gain — meaningful room to come down on a strong offer.
Risks & watch-outs
- Watch-outs: built in 1950 — expect roof / HVAC / electrical / plumbing capex.
- Climate carrying-cost: extreme-heat days projected 7→16/yr by 2055 (HVAC capex compounding) — expect insurance premiums to compound above CPI over the hold.
Questions for the listing agent
- It's been on market 108 days. Have you received any prior offers? Is the seller open to a 9% concession, seller financing, or rate buy-down credit?
- Built in 1950 — when were the roof, HVAC, electrical panel, plumbing, and water heater last replaced?
- Why hasn't it sold? Are there any deal-killer items the seller is aware of (foundation, flood, title, zoning, code violations)?
- Is there a deadline driving the sale (1031 exchange, divorce, estate, relocation)? That informs how much negotiation room exists.
- Schools are D-rated, which usually means shorter tenancies and higher turnover. Who's the typical renter profile here, and what's been the actual vacancy rate?
- Crime grade is F in this area — have there been break-ins, vandalism, or insurance claims at this property in the last 3 years? What carrier currently insures it and at what premium?
- What's the average days-on-market for RENTAL listings here right now (not sales)? A rising rental-DOM trend means longer vacancies and softer asking-rent achievability than the comps imply.
- What's the recent tenant-quality profile in this submarket — average credit score on applications, eviction rate, late-payment / NSF rate, and stable-employment percentage? A property-management company in the area should have these aggregated.
- How much new apartment / multifamily construction is in the pipeline within 1–3 miles? Heavy new supply (>2% of stock underway) typically softens rents 12–24 months out; light construction supports rent growth.
Investment metrics
- 1% rule
- 0.97% ✗
- Cap rate
- 7.34%
- Cash-on-cash
- 3.76%
- DSCR
- 1.17
- GRM
- 8.6
CMA / ARV
- ARV (median comp)
- $536,267
- List price
- $450,000
- Delta
- -16.09%
- Verdict
- UNDERPRICED
- Comps
- 20 within 1.0 mi
Show comp detail 3 sales within ~0.75 mi
| Address | Dist | Beds/Ba | Sqft | Sold | Price | $/sf | Match |
|---|---|---|---|---|---|---|---|
| 42 Hasbrouck St | 0.17mi | 4/3.0 (+1) | 1,008 (-3%) | 3mo | $305,000 | $303 | 75 |
| 73 S Robinson Ave | 0.32mi | 4/2.0 (+1) | 1,000 (-4%) | 10mo | $345,000 | $345 | 66 |
| 28 Hasbrouck St | 0.16mi | 4/3.0 (+1) | 1,188 (+14%) | 3mo | $305,000 | $257 | 57 |
Match score weights: distance 35% · size 25% · config 20% · recency 20%. Top-matched comps best support the ARV.
Projected returns pro-forma
-3.0% appreciation · 0.63% rent growth · sell at horizon
- IRR
- -13.1%
- Equity multiple
- 0.54×
- Total profit
- $-57,950
- Equity at exit
- $67,096
- IRR
- -8.2%
- Equity multiple
- 0.54×
- Total profit
- $-57,832
- Equity at exit
- $38,908
Cash invested: $126,000 (down + closing). Projections, not guarantees.
Landlord ↔ Tenant lean methodology
- Overall (STATE)
- 15 Strongly Tenant-Friendly
- State New York
- 15 Strongly Tenant-Friendly · D+10
- County
- — inherits STATE
- City
- — inherits STATE
ZIP-level market 12550
- Home prices YoY
- -33.3%
- Rents YoY
- 0.6%
- Active inventory
- 383
- Price-to-rent
- 25.7×
Monthly cashflow live
- Estimated rent
- $4,373 medium interval (Pro) →
- Mortgage (P&I)
- −$2,360
- Tax from tax record
- −$513 /mo · $6,155/yr
- Insurance
- −$188
- HOA
- −$0
- Vacancy / Maint / Mgmt
- −$918
- Net cashflow
- $394
Break-even live
3-unit breakdown (identical units grouped — click to expand)
| Units | Beds | Baths | Est. rent |
|---|---|---|---|
| 3× units | 1 | 1 | $4,374 |
| #1 | 1 | 1 | $1,458 |
| #2 | 1 | 1 | $1,458 |
| #3 | 1 | 1 | $1,458 |
| Total (3 units) | $4,373 | ||
UW: 25.0% down · 7.5% · 30yr · 1.5% tax · 5.0% vac · 8.0% maint · 8.0% mgmt
Financing live
Cash to close
- Down payment
- $112,500
- Closing costs
- $13,500
- Reserves months
- —
- Total cash needed
- —
Loan-product check · same deal, 3 products live
Conventional
25% down · 7.5% · 30yr
- Down + closing
- —
- Monthly P&I
- —
- Monthly cashflow
- —
- DSCR
- —
- Eligible?
- —
Personal DTI + credit; lowest rate.
DSCR
20% down · 8.5% · 30yr
- Down + closing
- —
- Monthly P&I
- —
- Monthly cashflow
- —
- DSCR
- —
- Eligible?
- —
No personal income docs; deal must DSCR.
Hard money
10% down · 12.0% · 12mo
- Down + closing
- —
- Monthly P&I
- —
- Monthly cashflow
- —
- DSCR
- —
- Eligible?
- —
Short-term bridge; refi at stabilization.
Rent comps 27 comps
| Address | Beds | Baths | Sqft | Rent | $/sqft | DOM | Units | Dist |
|---|---|---|---|---|---|---|---|---|
| 27 Clark St Newburgh, NY | 3.0 | 1.0 | 785 | $1,950 | $2.48 | 44d | 1 | 0.09mi |
| 52 S Miller St Newburgh, NY | 3.0 | 1.0 | 889 | $1,900 | $2.14 | 44d | 1 | 0.17mi |
| 28 Hasbrouck St Newburgh, NY | 3.0 | 1.5 | 1188 | $2,700 | $2.27 | 44d | 1 | 0.19mi |
| 42 Hasbrouck St Newburgh, NY | 3.0 | 1.5 | 1008 | $2,550 | $2.53 | 44d | 1 | 0.20mi |
| 259 1st St Newburgh, NY | 3.0 | 2.0 | 883 | $2,000 | $2.27 | 44d | 1 | 0.20mi |
| 177 W Parmenter St Unit 1 Newburgh, NY | 2.0 | 1.0 | 1100 | $1,700 | $1.55 | 23d | 1 | 0.22mi |
| 51 Lander St Unit 1 Newburgh, NY | 2.0 | 1.0 | 1000 | $1,500 | $1.50 | 23d | 1 | 0.26mi |
| 57 Lander St Unit B Newburgh, NY | 2.0 | 1.5 | 1100 | $1,900 | $1.73 | 44d | 1 | 0.26mi |
| 96 Broadway Unit 2B Newburgh, NY | 2.0 | 1.0 | 750 | $1,750 | $2.33 | 23d | 1 | 0.27mi |
| 167 Liberty St Newburgh, NY | 2.0 | 1.0 | 900 | $1,900 | $2.11 | 44d | 1 | 0.28mi |
| 87 Broadway Unit 2 Newburgh, NY | 2.0 | 1.0 | 800 | $1,800 | $2.25 | 23d | 1 | 0.30mi |
| 4 Grand St Unit 1 Newburgh, NY | 2.0 | 1.0 | 900 | $2,400 | $2.67 | 23d | 1 | 0.34mi |
| 22 Benkard Ave Unit 1 Newburgh, NY | 3.0 | 1.0 | 1075 | $1,750 | $1.63 | 44d | 1 | 0.37mi |
| 276 Temple Hill Rd #2215 Newburgh, NY | 2.0 | 1.0 | 1026 | $2,100 | $2.05 | 23d | 1 | 0.37mi |
| 44 Johnes St Unit 108-J Newburgh, NY | 2.0 | 1.0 | 909 | $1,950 | $2.15 | 14d | 1 | 0.41mi |
| 196 Carson Ave Newburgh, NY | 2.0 | 1.0 | 1188 | $2,200 | $1.85 | 44d | 1 | 0.42mi |
| 271 Liberty St Unit 1 Newburgh, NY | 2.0 | 1.0 | 825 | $2,000 | $2.42 | 14d | 1 | 0.47mi |
| 193 South St Unit 2 Newburgh, NY | 3.0 | 1.5 | 1200 | $2,415 | $2.01 | 14d | 1 | 0.49mi |
| 22 Overlook Pl Newburgh, NY | 2.0 | 1.0 | 1013 | $2,000 | $1.97 | 21d | 1 | 0.55mi |
| 81 Liberty Street Washington Hts Unit 2 Newburgh, NY | 3.0 | 1.0 | 1362 | $2,950 | $2.17 | 44d | 1 | 0.64mi |
| 33 Bay View Ter Unit 1 Newburgh, NY | 2.0 | 1.0 | 950 | $2,200 | $2.32 | 14d | 1 | 0.69mi |
| 268 Carpenter Ave Unit 1 Newburgh, NY | 3.0 | 2.0 | 950 | $2,600 | $2.74 | 23d | 1 | 0.73mi |
| 9 Arlington Pl Newburgh, NY | 3.0 | 1.0 | 950 | $2,300 | $2.42 | 14d | 1 | 0.78mi |
| 317 Grand St Unit 1-1 Newburgh, NY | 2.0 | 2.0 | 1400 | $2,200 | $1.57 | 14d | 1 | 0.83mi |
| 171 West St Newburgh, NY | 3.0 | 1.5 | 1299 | $2,800 | $2.16 | 23d | 1 | 0.91mi |
| 109 Myrtle Ave New Windsor, NY | 2.0 | 1.0 | 1079 | $2,200 | $2.04 | 44d | 1 | 1.16mi |
| 20 Pierces Rd Unit 3 Newburgh, NY | 2.0 | 1.5 | 1071 | $1,900 | $1.77 | 23d | 1 | 1.29mi |
Listing history 26 events
-
2026-06-18days on market $450,000 Active 108 DOM
-
2026-06-17days on market $450,000 Active 107 DOM
-
2026-06-16days on market $450,000 Active 106 DOM
-
2026-06-15days on market $450,000 Active 105 DOM
-
2026-06-14days on market $450,000 Active 103 DOM
-
2026-06-13days on market $450,000 Active 102 DOM
-
2026-06-10days on market $450,000 Active 100 DOM
-
2026-06-09days on market $450,000 Active 99 DOM
-
2026-06-08days on market $450,000 Active 98 DOM
-
2026-06-07days on market $450,000 Active 97 DOM
-
2026-06-03days on market $450,000 Active 93 DOM
-
2026-06-02days on market $450,000 Active 92 DOM
-
2026-06-01days on market $450,000 Active 91 DOM
-
2026-05-31days on market $450,000 Active 90 DOM
-
2026-05-30days on market $450,000 Active 89 DOM
-
2026-03-02$450,000 Active 158-char remark
Show marketing remark (158 chars)
Great investment opportunity in good condition overall and fully rented. Low taxes. Close to shopping, restaurants, Hawys , and more Gross Income : $31,800.00
-
2012-10-02soldstatus $45,000
-
2012-06-21soldstatus $45,000 325-char remark
Show marketing remark (325 chars)
Great investment property in good condition overall. Apartment first floor was renovated recently. The upstairs apartment is move in condition. Short sale. Bank is waiting for an offer. Additional Information: AnnGarbageExpense:0,AnnOtherExpenses:0,AnnSuper_MaintExp:0,AnnUtilityExpense:0,AnnWaterExpense:0,AdjustedGOI:19200,
-
2012-06-21soldstatus $45,000
Show marketing remark (325 chars)
Great investment property in good condition overall. Apartment first floor was renovated recently. The upstairs apartment is move in condition. Short sale. Bank is waiting for an offer. Additional Information: AnnGarbageExpense:0,AnnOtherExpenses:0,AnnSuper_MaintExp:0,AnnUtilityExpense:0,AnnWaterExpense:0,AdjustedGOI:19200,
-
2012-06-18price $50,000
-
2012-06-18historical
-
2012-03-23$50,000 325-char remark
Show marketing remark (325 chars)
Great investment property in good condition overall. Apartment first floor was renovated recently. The upstairs apartment is move in condition. Short sale. Bank is waiting for an offer. Additional Information: AnnGarbageExpense:0,AnnOtherExpenses:0,AnnSuper_MaintExp:0,AnnUtilityExpense:0,AnnWaterExpense:0,AdjustedGOI:19200,
-
2012-03-23$45,000
Show marketing remark (325 chars)
Great investment property in good condition overall. Apartment first floor was renovated recently. The upstairs apartment is move in condition. Short sale. Bank is waiting for an offer. Additional Information: AnnGarbageExpense:0,AnnOtherExpenses:0,AnnSuper_MaintExp:0,AnnUtilityExpense:0,AnnWaterExpense:0,AdjustedGOI:19200,
-
2007-03-19soldstatus $158,000
-
1996-12-09soldstatus $50,000
-
1996-10-21soldstatus $20,000
ⓘ Source: listings_history table (triggers on properties + properties_extension) + one-shot
backfill from property_details.listing_events for pre-trigger history.
Tax reassessment forecast NY · Partial reset (capped growth)
- Current annual tax
- $6,155 · $513/mo
- Projected year-2 tax
- $6,880 · $573/mo
- Expected delta
- +$725/yr (+$60/mo · 11.8%)
ⓘ Screening estimate from a state-policy table — verify with the county assessor before closing.
Climate risk First Street
- Flood 1/10 Low FEMA zone X (unshaded) · 0% chance over 30 yrs
- Wildfire 3/10 Moderate
- Heat 5/10 Major 7 d/yr ≥100°F today · 16 d/yr by 30 yrs out
- Wind 4/10 Moderate 12% chance of damaging wind over 30 yrs
- Air quality 3/10 Moderate 2 unhealthy d/yr today · 3 by 30 yrs out
Nearby sold comps map
Loading sold comps map…
Walkable amenities ~0.75 mi
Loading nearby amenities…
Taxation est. · year 1
- Rental income
- $52,476
- − Mortgage interest
- −$25,207
- − Property taxes
- −$6,155
- − Insurance
- −$2,250
- − Repairs & maintenance
- −$4,198
- − Management
- −$4,198
- − Depreciation
- −$13,091
- Taxable loss
- −$2,623
- Est. tax savings @ 24.0%
- +$629
- After-tax cash flow
- $5,363/yr
For passive investors: Depreciation is non-cash, so a rental often shows a tax loss while cash-flowing — sheltering income. Rental losses are passive: they offset passive income freely, and up to $25,000/yr can offset ordinary (W-2) income if you actively participate and your MAGI is under $100k (phasing out to $0 by $150k); unused losses carry forward. On sale, claimed depreciation is recaptured at up to 25%, and gains may owe capital-gains tax (a 1031 exchange can defer both). Figures are a year-1 estimate at your 24.0% rate — not tax advice; consult a CPA.
Schools (NCES district)
- District
- Newburgh City School District
- NCES district ID
- 3620700
- Math proficiency
- 33% ▼ -8.00%
- Reading proficiency
- 48% ▲ 10.00%
- Median HH income
- $56,387
- Composite
- 35.46/100
- National rank
- #4927
- State rank
- #500 of 590 in NY
Livability — Newburgh
- Score
- 62/100
- State rank
- #878
- US rank
- #17021
Category grades
Schools grade is shown separately in the Schools card above.
Census & demographics
- Census place
- Newburgh, NY
- County
- Orange County · 267,004 people
- City population
- 55,152
- Metro
- Poughkeepsie-Newburgh-Middletown, NY
- Population (ZIP)
- 55,152
- Household income
- $85,697
- Rent vs Own
- Severe rent burden
- 2412.0
Population outlook (Orange County) Hauer SSP2
- Today (2025)
- 379,830 people
- By 2030
- 378,955 · -0.2%
- By 2040
- 375,444 · -1.2%
- By 2050
- 369,311 · -2.8%
- By 2075
- 354,233 · -6.7%
- By 2100
- 318,150 · -16.2%
Race, ethnicity, and origin ACS 2023
- Neighborhood character
- Diverse neighborhood (Simpson 0.68)
- Race & ethnicity
- Hispanic / Latino 39% White 36% Black 20% Two or more races 12% Asian 2%
- Hispanic origin (detail)
- Mexican 14% Puerto Rican 10% Dominican 2%
- Common ancestry
- Romanian 2% Hispanic 1% Lithuanian 1%
- Foreign-born
- 18% · Canada, Dominican Republic
- Languages at home
- 64% English-only · Spanish 30% French/Haitian/Cajun 1% Other Indo-European 1%
Political lean MEDSL · Orange
- 2024 margin
- Lean R (+8.4) · D 45.8% · R 54.2%
- 2008→2024 swing
- -12.5pp toward R · 2008: 4.1pp · 2024: -8.4pp
- All cycles
- 2024: R+8.4 2020: R+0.2 2016: R+6.5 2012: D+5.2 2008: D+4.1
Not yet ingested
- Civics
- —
Market trends
- HPI YoY
- ▼ -151.93%
- Current HPI
- 304.1046
- Rent YoY
- ▲ 0.63%
- Metro
- Poughkeepsie-Newburgh-Middletown, NY
- State GDP YoY
- ▲ 2.60%
- F500 in state
- 92
Industry mix (Fortune 500 HQ in NY)
| Industry | F500 HQs | Revenue |
|---|---|---|
| Financial Services | 10 | $950B |
|
||
| Consumer Goods | 9 | $162B |
|
||
| Insurance | 4 | $225B |
|
||
| Telecommunications | 2 | $144B |
|
||
| Pharmaceuticals | 2 | $112B |
|
||
| Media / Entertainment | 2 | $69B |
|
||
Price history
+2150.0% since first listed11 events — show timeline
- 2026-03-02 Listed $450,000 OneKey® MLS as Distributed by MLS Grid
- 2012-10-02 Sold (Public Records) $45,000 Public Records
- 2012-06-21 Sold (MLS) $45,000 HGMLS
- 2012-06-21 Sold (MLS) $45,000 OneKey® MLS as Distributed by MLS Grid
- 2012-06-18 Delisted — HGMLS
- 2012-06-18 Price Changed $50,000 HGMLS
- 2012-03-23 Listed $45,000 HGMLS
- 2012-03-23 Listed $50,000 OneKey® MLS as Distributed by MLS Grid
- 2007-03-19 Sold (Public Records) $158,000 Public Records
- 1996-12-09 Sold (Public Records) $50,000 Public Records
- 1996-10-21 Sold (Public Records) $20,000 Public Records
Property tax history
+2.8%/yrLatest (2025): $6,155 · -1.9% YoY. Source: county tax records.
Cash-flow waterfall
monthlySold comps — $/sqft
last 12 mo · ≤1 miLoading sold comps…