 6-Plex
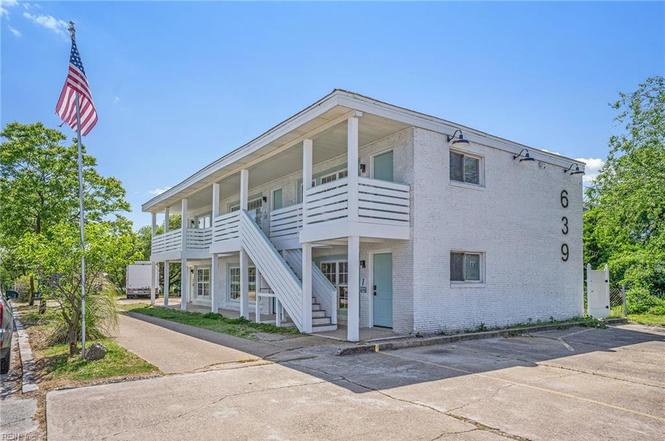
639 W Ocean View Ave · Norfolk, VA
Flood risk 10/10 · Severe
- FEMA flood zone
- AE
- Chance of flooding over 30 yrs
- 0.99%
- Est. flood insurance / yr
- $1,737 – $8,500
Fire risk 1/10 · Minimal
- Est. fire insurance / yr
- $666 – $1,236
Heat risk 9/10 · Severe
- Hot days now (above 105°F)
- 7 days/yr
- Hot days in 30 yrs
- 16 days/yr
Wind risk 8/10 · Major
- Chance of severe wind over 30 yrs
- 80.0%
Air-quality risk 2/10 · Minimal
- Unhealthy air days now
- 2 days/yr
- Unhealthy air days in 30 yrs
- 2 days/yr
Risk factors via First Street. Map © Google.
Why this score? — see what drove the C- grade
The composite is a weighted blend of 9 inputs, each scored 0–100. Each bar is that input's sub-score; the figure is the points it added to the 100-point composite (weight × sub-score).
- Cash flow +18.9/30.0
- ARV discount +7.5/15.0
- DSCR +6.0/10.0
- Livability +4.2/5.0
- 1% rule +4.0/10.0
- Rent growth +3.7/5.0
- Schools +3.5/10.0
- Condition / age +2.5/5.0
- Appreciation +0.0/10.0
$995,000
🖨 Deal sheet 📄 Offer letter ✓ Due diligence
Multi-family units
County records classify this as Multi-Family (5+ Unit). Listing-text estimate: 6 units. confirmed
5+ unit building — per-unit beds/baths from public records are typically unavailable; the breakdown below (if shown) is an estimate from the listing text.
Listing remarks
Discover a fully stabilized, turnkey 6 unit apartment building just blocks from Norfolk's premier Ocean View beaches. Each one bedroom residence has been thoughtfully renovated and conveys fully furnished with tasteful decor, offering immediate income, strong in place performance, and long term durability. The property features reserved parking for every unit, an on site laundry room at no additional cost to tenants, and consistent 100% occupancy. With quick access to I-64 and close proximity to major city center hubs, this location attracts strong rental demand year round. A rare opportunity to acquire a low maintenance coastal asset in one of Norfolk's most resilient rental corridors.
Key facts
- On site laundry room
- Reserved parking
- Quick access to i-64
Tags
Property features AI
Finance
- Financial info: Total of 6 units
Exterior
- Parking: Assigned/reserved parking; Multi-car parking; Driveway parking spaces
- Utilities: City water; City sewer; Electric service; Electric water heater
- Home design: Garden apartment; 2 stories; Simple ownership type
- Construction: Concrete construction; Brick and vinyl exterior siding; Asphalt shingle roof; Slab foundation; Built as a garden-style apartment
- Exterior features: Brick and vinyl siding; Asphalt shingle roof; Garden-style apartment property; Two-story building; Slab foundation; Concrete construction
Interior
- Kitchen: Six ranges; Six refrigerators
- Bedrooms: Six 1-bedroom units (each unit listed as 1 bedroom)
- Flooring: Laminate flooring
- Bathrooms: Six 1-bath units (each unit listed as 1 bath)
- Heating & cooling: Electric heating; Cooling: Other
- Interior features: Furnished; Laundry room; Laminate flooring
- Laundry & utility: Shared laundry room
Neighborhood map
What this means for you Summary
Snapshot
- This is a 6 × 3-bed/4.0-bath units multifamily listed at $995k.
Deal economics
- At list price, monthly cash flow is $601 ($7k/yr) — positive. Per door: $100/mo.
- The deal already cash-flows at list — no discount required.
- To meet the 1% rule (rent ≥ 1% of price), the offer needs to be $899k (9.6% below list).
- Recommended offer: $899k (9.6% below list) — sets the bar for 1% rule.
- Cap rate 7.5% vs local median 4.0% in Norfolk — top-decile yield for the area; either an underpriced asset or a hidden risk that comps aren't pricing in. Stress-test before assuming the spread holds.
Location & tenants
- Location reads 83/100 on livability (#43 in VA, #1,026 nationally) — a professional / high-income tenant draw. Strengths: amenities A+, commute A+, health & safety A+; Watch: employment C-, crime F.
- Norfolk City Public School District (urban): math 27% / reading 56% proficiency, ranked #118 of 131 in VA (top 90%) — families likely to look elsewhere, expect single-tenant / working-renter base with shorter leases.
- Zoned schools: Ocean View Elementary (math 20% / reading 53%, grade F, #953 of 1,108 statewide, top 86%, 456 students, 98% FRL); Granby High (math 33% / reading 80%, grade C, #270 of 319 statewide, top 86%, 1,837 students, 94% FRL) — zoned schools average 96% FRL vs 59% district-wide (37 pts higher); higher-poverty schools than district average — tighter screening recommended.
- Market conditions: Rents rising fast (+4.8%/yr); 192 active listings in the ZIP; 438 units permitted in Norfolk city in 2024 (273 in 5+ unit buildings).
- At $8,993/mo this rent would consume 160% of the median local household income ($68k/yr) (locally 1948% of renters already pay >50% of income on rent) — very limited rent-growth headroom before tenants either downsize or default.
Forward outlook
- Local home prices are declining (-3.0%/yr); year-one equity from $7k of loan paydown is wiped out by about $30k of value loss. Plan a longer hold.
Negotiation context
- It's been on market 70 days — a 6% lower offer ($935k) is reasonable based on typical stale-listing flexibility.
- Current owner paid $395k; list at $995k implies a 152% gain — meaningful room to come down on a strong offer.
Risks & watch-outs
- Watch-outs: flood insurance adds $427/mo.
- Climate carrying-cost: in FEMA flood zone AE (mandatory federal flood insurance); severe wind risk, 80% chance of damaging wind over 30y; extreme-heat days projected 7→16/yr by 2055 (HVAC capex compounding) — expect insurance premiums to compound above CPI over the hold.
Questions for the listing agent
- It's been on market 70 days. Have you received any prior offers? Is the seller open to a 10% concession, seller financing, or rate buy-down credit?
- Can we see the unit-by-unit rent roll, current vacancy, and any below-market leases? What's the average tenancy length?
- What capital expenditures (roof, boiler, parking lot, exteriors) have been made in the last 5 years, and what's planned in the next 2?
- Built in 1961 — when were the roof, HVAC, electrical panel, plumbing, and water heater last replaced?
- What's the actual annual flood-insurance premium (NFIP or private), and is the property in a SFHA with mandatory coverage?
- Why hasn't it sold? Are there any deal-killer items the seller is aware of (foundation, flood, title, zoning, code violations)?
- Is there a deadline driving the sale (1031 exchange, divorce, estate, relocation)? That informs how much negotiation room exists.
- Schools are A-rated — typically a magnet for longer-tenancy family renters. What's the average tenant stay here, and is there a school-zone premium baked into asking?
- Crime grade is F in this area — have there been break-ins, vandalism, or insurance claims at this property in the last 3 years? What carrier currently insures it and at what premium?
- What's the average days-on-market for RENTAL listings here right now (not sales)? A rising rental-DOM trend means longer vacancies and softer asking-rent achievability than the comps imply.
- What's the recent tenant-quality profile in this submarket — average credit score on applications, eviction rate, late-payment / NSF rate, and stable-employment percentage? A property-management company in the area should have these aggregated.
- How much new apartment / multifamily construction is in the pipeline within 1–3 miles? Heavy new supply (>2% of stock underway) typically softens rents 12–24 months out; light construction supports rent growth.
Investment metrics
- 1% rule
- 0.90% ✗
- Cap rate
- 7.53%
- Cash-on-cash
- 4.43%
- DSCR
- 1.20
- GRM
- 9.2
CMA / ARV
No comps found within radius.
Projected returns pro-forma
-3.0% appreciation · 4.76% rent growth · sell at horizon
- IRR
- -10.4%
- Equity multiple
- 0.62×
- Total profit
- $-106,843
- Equity at exit
- $148,358
- IRR
- 1.2%
- Equity multiple
- 1.09×
- Total profit
- $24,802
- Equity at exit
- $86,029
Cash invested: $278,600 (down + closing). Projections, not guarantees.
Landlord ↔ Tenant lean methodology
- Overall (STATE)
- 55 Moderately Landlord-Leaning
- State Virginia
- 55 Moderately Landlord-Leaning · D+2
- County
- — inherits STATE
- City
- — inherits STATE
ZIP-level market 23503
- Home prices YoY
- -19.9%
- Rents YoY
- 4.8%
- Active inventory
- 192
- Price-to-rent
- 55.3×
Monthly cashflow live
- Estimated rent
- $8,993 high interval (Pro) →
- Mortgage (P&I)
- −$5,218
- Tax from tax record
- −$444 /mo · $5,333/yr
- Insurance
- −$415
- Flood insurance flood zone
- −$427 /mo · $5,118/yr
- HOA
- −$0
- Vacancy / Maint / Mgmt
- −$1,889
- Net cashflow
- $601
Break-even live
6-unit breakdown (identical units grouped — click to expand)
| Units | Beds | Baths | Est. rent |
|---|---|---|---|
| 6× units | 3 | 4 | $8,994 |
| #1 | 3 | 4 | $1,499 |
| #2 | 3 | 4 | $1,499 |
| #3 | 3 | 4 | $1,499 |
| #4 | 3 | 4 | $1,499 |
| #5 | 3 | 4 | $1,499 |
| #6 | 3 | 4 | $1,499 |
| Total (6 units) | $8,993 | ||
UW: 25.0% down · 7.5% · 30yr · 1.5% tax · 5.0% vac · 8.0% maint · 8.0% mgmt
Financing live
Cash to close
- Down payment
- $248,750
- Closing costs
- $29,850
- Reserves months
- —
- Total cash needed
- —
Loan-product check · same deal, 3 products live
Conventional
25% down · 7.5% · 30yr
- Down + closing
- —
- Monthly P&I
- —
- Monthly cashflow
- —
- DSCR
- —
- Eligible?
- —
Personal DTI + credit; lowest rate.
DSCR
20% down · 8.5% · 30yr
- Down + closing
- —
- Monthly P&I
- —
- Monthly cashflow
- —
- DSCR
- —
- Eligible?
- —
No personal income docs; deal must DSCR.
Hard money
10% down · 12.0% · 12mo
- Down + closing
- —
- Monthly P&I
- —
- Monthly cashflow
- —
- DSCR
- —
- Eligible?
- —
Short-term bridge; refi at stabilization.
Listing history 4 events
-
2026-05-20status Under Contract
-
2026-05-01historical Active Under Contract
-
2026-03-10$995,000 Active
-
2020-11-18soldstatus $395,000
ⓘ Source: listings_history table (triggers on properties + properties_extension) + one-shot
backfill from property_details.listing_events for pre-trigger history.
Tax reassessment forecast VA · Resets to sale price
- Current annual tax
- $5,333 · $444/mo
- Projected year-2 tax
- $8,159 · $680/mo
- Expected delta
- +$2,826/yr (+$235/mo · 53.0%)
ⓘ Screening estimate from a state-policy table — verify with the county assessor before closing.
Climate risk First Street
- Flood 10/10 Extreme FEMA zone AE · 99% chance over 30 yrs
- Wildfire 1/10 Low
- Heat 9/10 Extreme 7 d/yr ≥105°F today · 16 d/yr by 30 yrs out
- Wind 8/10 Severe 80% chance of damaging wind over 30 yrs
- Air quality 2/10 Low 2 unhealthy d/yr today · 2 by 30 yrs out
Nearby sold comps map
Loading sold comps map…
Walkable amenities ~0.75 mi
Loading nearby amenities…
Taxation est. · year 1
- Rental income
- $107,916
- − Mortgage interest
- −$55,735
- − Property taxes
- −$5,333
- − Insurance
- −$10,094
- − Repairs & maintenance
- −$8,633
- − Management
- −$8,633
- − Depreciation
- −$28,945
- Taxable loss
- −$9,458
- Est. tax savings @ 24.0%
- +$2,270
- After-tax cash flow
- $9,482/yr
For passive investors: Depreciation is non-cash, so a rental often shows a tax loss while cash-flowing — sheltering income. Rental losses are passive: they offset passive income freely, and up to $25,000/yr can offset ordinary (W-2) income if you actively participate and your MAGI is under $100k (phasing out to $0 by $150k); unused losses carry forward. On sale, claimed depreciation is recaptured at up to 25%, and gains may owe capital-gains tax (a 1031 exchange can defer both). Figures are a year-1 estimate at your 24.0% rate — not tax advice; consult a CPA.
Schools (NCES district)
- District
- Norfolk City Public School District
- NCES district ID
- 5102670
- Math proficiency
- 27% ▼ -44.00%
- Reading proficiency
- 56% ▼ -10.00%
- Median HH income
- $44,358
- Composite
- 35.08/100
- National rank
- #5026
- State rank
- #118 of 131 in VA
Livability — Norfolk
- Score
- 83/100
- State rank
- #43
- US rank
- #1026
Category grades
Schools grade is shown separately in the Schools card above.
Census & demographics
- Census place
- Norfolk, VA
- County
- Norfolk City · 214,042 people
- City population
- 214,042
- Metro
- Virginia Beach-Norfolk-Newport News, VA-NC
- Population (ZIP)
- 30,216
- Household income
- $67,649
- Rent vs Own
- Severe rent burden
- 1948.0
Population outlook (Norfolk County) Hauer SSP2
- Today (2025)
- 249,032 people
- By 2030
- 252,347 · +1.3%
- By 2040
- 253,644 · +1.9%
- By 2050
- 251,913 · +1.2%
- By 2075
- 245,281 · -1.5%
- By 2100
- 219,548 · -11.8%
Race, ethnicity, and origin ACS 2023
- Neighborhood character
- Diverse neighborhood (Simpson 0.63)
- Race & ethnicity
- White 56% Black 20% Hispanic / Latino 13% Two or more races 9% Asian 3% Native American 1%
- Hispanic origin (detail)
- Mexican 5% Puerto Rican 2%
- Common ancestry
- Lithuanian 2% Slovak 2% Romanian 2%
- Foreign-born
- 9% · Canada, China
- Languages at home
- 87% English-only · Spanish 8% Tagalog/Filipino 1% Other Asian/Pacific 1%
Political lean MEDSL · Norfolk
- 2024 margin
- Solid D (+41.5) · D 70.0% · R 28.5% · Other 1.6%
- 2008→2024 swing
- -1.4pp toward R · 2008: 43.0pp · 2024: 41.5pp
- All cycles
- 2024: D+41.5 2020: D+45.6 2016: D+42.0 2012: D+44.0 2008: D+43.0
Not yet ingested
- Civics
- —
Market trends
- HPI YoY
- ▼ -78.48%
- Current HPI
- 316.1563
- Rent YoY
- ▲ 4.76%
- Metro
- Virginia Beach-Norfolk-Newport News, VA-NC
- State GDP YoY
- ▲ 2.40%
- F500 in state
- 50
Industry mix (Fortune 500 HQ in VA)
| Industry | F500 HQs | Revenue |
|---|---|---|
| Aerospace / Defense | 4 | $236B |
|
||
| Technology / Defense | 3 | $32B |
|
||
| Financial Services | 2 | $176B |
|
||
| Utilities | 2 | $27B |
|
||
| Insurance | 2 | $25B |
|
||
| Technology | 2 | $15B |
|
||
Price history
+151.9% since first listed4 events — show timeline
- 2026-05-20 Pending — REINMLS
- 2026-05-01 Contingent — REINMLS
- 2026-03-10 Listed $995,000 REINMLS
- 2020-11-18 Sold (Public Records) $395,000 Public Records
Property tax history
+5.1%/yrLatest (2025): $5,333 · +12.0% YoY. Source: county tax records.
Cash-flow waterfall
monthlySold comps — $/sqft
last 12 mo · ≤1 miLoading sold comps…