2336 Snyder Ave · Beaver Springs, PA
Flood risk 8/10 · Major
- FEMA flood zone
- X (unshaded)
- Chance of flooding over 30 yrs
- 0.99%
- Est. flood insurance / yr
- $507 – $1,088
Fire risk 3/10 · Minor
- Est. fire insurance / yr
- $511 – $949
Heat risk 4/10 · Minor
- Hot days now (above 94°F)
- 7 days/yr
- Hot days in 30 yrs
- 16 days/yr
Wind risk 2/10 · Minimal
- Chance of severe wind over 30 yrs
- 2.0%
Air-quality risk 2/10 · Minimal
- Unhealthy air days now
- 0 days/yr
- Unhealthy air days in 30 yrs
- 1 days/yr
Risk factors via First Street. Map © Google.
Why this score? — see what drove the D+ grade
The composite is a weighted blend of 9 inputs, each scored 0–100. Each bar is that input's sub-score; the figure is the points it added to the 100-point composite (weight × sub-score).
- Cash flow +14.3/30.0
- ARV discount +7.5/15.0
- 1% rule +4.9/10.0
- DSCR +4.4/10.0
- Appreciation +4.4/10.0
- Schools +4.1/10.0
- Livability +3.0/5.0
- Rent growth +2.5/5.0
- Condition / age +2.5/5.0
$125,000
🖨 Deal sheet (PDF) 📄 Offer letter ✓ Due diligence
Listing remarks
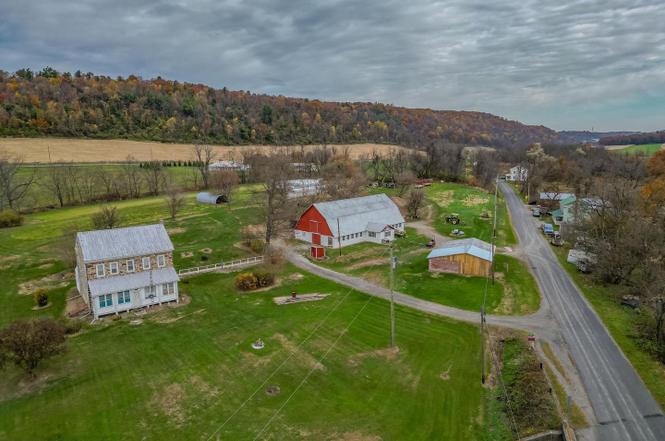
This property is going to onsite auction 4/11/2026 at 11:00 AM and is being sold with reserve. LISTED PRICE IS ONLY A SUGGESTED OPENING BID AND IS NOT INDICATIVE OF THE FINAL SALES PRICE WHICH WILL BE BY SELLER CONFIRMATION DAY OF AUCTION. Terms: Down payment of $25,000 required day of auction. Settlement on or before June 12, 2026. Transfer taxes to be paid by buyer. Real Estate taxes shall be prorated. Residual Lot: 27.40 acres with 4 bedrooms, 1.5 bath home and outbuildings. 40'x80' tie stall barn with loft are and 32'x40' shop. Road frontage along Snyder Ave and Rt 522. These 2 farms have been in the Stuck family for many years. Prime & rare opportunity to buy a
Key facts
- 27.4 acre lot
- Built 1900
- Listed 49 days
Neighborhood map
What this means for you Summary
Snapshot
- This is a 4-bed/1.5-bath single-family listed at $125k.
Deal economics
- At list price, monthly cash flow is $-42 ($-509/yr) — negative.
- To cash-flow at today's rent, offer at most $118k (6.0% below list).
- To meet the 1% rule (rent ≥ 1% of price), the offer needs to be $124k (0.7% below list).
- Recommended offer: $118k (6.0% below list) — sets the bar for cash-flow.
Location & tenants
- Location reads 60/100 on livability (#1,468 in PA) — a middle-class / working-renter tenant base. Strengths: cost of living A+, housing A; Watch: employment D+, amenities F, commute F.
- Midd-West SD (rural): math 41% / reading 55% proficiency, ranked #225 of 539 in PA (top 42%) — families likely to look elsewhere, expect single-tenant / working-renter base with shorter leases.
- Zoned schools: Midd-West Ms (math 40% / reading 54%, grade D+, #163 of 512 statewide, top 33%, 304 students, 100% FRL); Midd-West Hs (math 48% / reading 57%, grade C-, #110 of 437 statewide, top 25%, 764 students, 93% FRL) — zoned schools average 96% FRL vs 33% district-wide (64 pts higher); higher-poverty schools than district average — tighter screening recommended.
- Market conditions: 10 active listings in the ZIP; 48 units permitted in Snyder County in 2024 (0 in 5+ unit buildings).
Forward outlook
- Local home prices are declining (-1.2%/yr); year-one equity from $864 of loan paydown is wiped out by about $1k of value loss. Plan a longer hold.
- Snyder County population projected at +3% by 2050 — modest demand growth; plan on rents tracking national, not racing it.
Negotiation context
- It's been on market 49 days — a 3% lower offer ($121k) is reasonable based on typical stale-listing flexibility.
Risks & watch-outs
- Watch-outs: flood insurance adds $66/mo; built in 1900 — expect roof / HVAC / electrical / plumbing capex.
- Climate carrying-cost: severe flood risk — expect insurance premiums to compound above CPI over the hold.
Questions for the listing agent
- What do current leases actually rent for vs. the listed asking? Can we see a recent rent roll and the last 12 months of T-12 income?
- It's been on market 49 days. Have you received any prior offers? Is the seller open to a 6% concession, seller financing, or rate buy-down credit?
- Built in 1900 — when were the roof, HVAC, electrical panel, plumbing, and water heater last replaced?
- What's the actual annual flood-insurance premium (NFIP or private), and is the property in a SFHA with mandatory coverage?
- Is there a deadline driving the sale (1031 exchange, divorce, estate, relocation)? That informs how much negotiation room exists.
- The area grade is low — what's the realistic commute time and amenity access for the typical tenant pool here? Any planned neighborhood developments (good or bad) we should know about?
- What's the average days-on-market for RENTAL listings here right now (not sales)? A rising rental-DOM trend means longer vacancies and softer asking-rent achievability than the comps imply.
- What's the recent tenant-quality profile in this submarket — average credit score on applications, eviction rate, late-payment / NSF rate, and stable-employment percentage? A property-management company in the area should have these aggregated.
- How much new for-sale + rental construction is in the pipeline within 1–3 miles? Heavy new supply typically softens prices + rents 12–24 months out; constrained supply supports both.
Investment metrics
- 1% rule
- 0.99% ✗
- Cap rate
- 6.52%
- Cash-on-cash
- 0.82%
- DSCR
- 1.04
- GRM
- 8.4
CMA / ARV
No comps found within radius.
Projected returns pro-forma
-1.16% appreciation · 3.0% rent growth · sell at horizon
- IRR
- -8.6%
- Equity multiple
- 0.63×
- Total profit
- $-12,906
- Equity at exit
- $29,208
- IRR
- -1.6%
- Equity multiple
- 0.86×
- Total profit
- $-4,994
- Equity at exit
- $29,855
Cash invested: $35,000 (down + closing). Projections, not guarantees.
Landlord ↔ Tenant lean methodology
- Overall (STATE)
- 62 Landlord-Friendly
- State Pennsylvania
- 62 Landlord-Friendly · EVEN
- County
- — inherits STATE
- City
- — inherits STATE
ZIP-level market 17812
- Home prices YoY
- -1.1%
- Active inventory
- 10
- Price-to-rent
- 8.4×
Monthly cashflow live
- Estimated rent
- $1,241 medium interval (Pro) →
- Mortgage (P&I)
- −$656
- Tax from tax record
- −$249 /mo · $2,982/yr
- Insurance
- −$52
- Flood insurance flood zone
- −$66 /mo · $798/yr
- HOA
- −$0
- Vacancy / Maint / Mgmt
- −$261
- Net cashflow
- $-42
Break-even live
Sensitivity live
| Price | -10% $28 | -5% $-7 | +0% $-42 | +5% $-78 | +10% $-113 |
|---|---|---|---|---|---|
| Rent | -10% $-140 | -5% $-91 | +0% $-42 | +5% $7 | +10% $56 |
| Rate | -1.0pp $21 | -0.5pp $-11 | base $-42 | +0.5pp $-75 | +1.0pp $-108 |
UW: 25.0% down · 7.5% · 30yr · 1.5% tax · 5.0% vac · 8.0% maint · 8.0% mgmt
Financing live
Cash to close
- Down payment
- $31,250
- Closing costs
- $3,750
- Reserves months
- —
- Total cash needed
- —
Loan-product check · same deal, 3 products live
Conventional
25% down · 7.5% · 30yr
- Down + closing
- —
- Monthly P&I
- —
- Monthly cashflow
- —
- DSCR
- —
- Eligible?
- —
Personal DTI + credit; lowest rate.
DSCR
20% down · 8.5% · 30yr
- Down + closing
- —
- Monthly P&I
- —
- Monthly cashflow
- —
- DSCR
- —
- Eligible?
- —
No personal income docs; deal must DSCR.
Hard money
10% down · 12.0% · 12mo
- Down + closing
- —
- Monthly P&I
- —
- Monthly cashflow
- —
- DSCR
- —
- Eligible?
- —
Short-term bridge; refi at stabilization.
Listing history 2 events
-
2026-04-13status Pending
-
2026-02-23$125,000 Active
ⓘ Source: listings_history table (triggers on properties + properties_extension) + one-shot
backfill from property_details.listing_events for pre-trigger history.
Tax reassessment forecast PA · Partial reset (capped growth)
- Current annual tax
- $2,982 · $249/mo
- Projected year-2 tax
- $2,982 · $249/mo
- Expected delta
- $0/yr ($0/mo · 0.0%)
ⓘ Screening estimate from a state-policy table — verify with the county assessor before closing.
Climate risk First Street
- Flood 8/10 Severe FEMA zone X (unshaded) · 99% chance over 30 yrs
- Wildfire 3/10 Moderate
- Heat 4/10 Moderate 7 d/yr ≥94°F today · 16 d/yr by 30 yrs out
- Wind 2/10 Low 2% chance of damaging wind over 30 yrs
- Air quality 2/10 Low 0 unhealthy d/yr today · 1 by 30 yrs out
Nearby sold comps map
Loading sold comps map…
Walkable amenities ~0.75 mi
Loading nearby amenities…
Taxation est. · year 1
- Rental income
- $14,888
- − Mortgage interest
- −$7,002
- − Property taxes
- −$2,982
- − Insurance
- −$1,422
- − Repairs & maintenance
- −$1,191
- − Management
- −$1,191
- − Depreciation
- −$3,636
- Taxable loss
- −$2,537
- Est. tax savings @ 24.0%
- +$609
- After-tax cash flow
- $100/yr
For passive investors: Depreciation is non-cash, so a rental often shows a tax loss while cash-flowing — sheltering income. Rental losses are passive: they offset passive income freely, and up to $25,000/yr can offset ordinary (W-2) income if you actively participate and your MAGI is under $100k (phasing out to $0 by $150k); unused losses carry forward. On sale, claimed depreciation is recaptured at up to 25%, and gains may owe capital-gains tax (a 1031 exchange can defer both). Figures are a year-1 estimate at your 24.0% rate — not tax advice; consult a CPA.
Schools (NCES district)
- District
- Midd-West SD
- NCES district ID
- 4215210
- Math proficiency
- 41% ▼ -9.00%
- Reading proficiency
- 55% ▼ -8.00%
- Median HH income
- $45,875
- Composite
- 40.68/100
- National rank
- #3675
- State rank
- #225 of 539 in PA
Livability — Beaver Springs
- Score
- 60/100
- State rank
- #1468
- US rank
- #18933
Category grades
Schools grade is shown separately in the Schools card above.
Census & demographics
- Population (ZIP)
- 1,497
Population outlook (Snyder County) Hauer SSP2
- Today (2025)
- 41,720 people
- By 2030
- 42,207 · +1.2%
- By 2040
- 42,918 · +2.9%
- By 2050
- 43,125 · +3.4%
- By 2075
- 42,498 · +1.9%
- By 2100
- 39,544 · -5.2%
Race, ethnicity, and origin ACS 2023
- Neighborhood character
- Predominantly White (97%)
- Race & ethnicity
- White 97% Hispanic / Latino 1%
- Common ancestry
- Iranian 7% Romanian 4% Scotch-Irish 2%
- Foreign-born
- 0%
- Languages at home
- 96% English-only · German/W. Germanic 3% Spanish 2%
Political lean MEDSL · Snyder
- 2024 margin
- Solid R (+47.0) · D 26.1% · R 73.2%
- 2008→2024 swing
- -17.8pp toward R · 2008: -29.2pp · 2024: -47.0pp
- All cycles
- 2024: R+47.0 2020: R+47.4 2016: R+47.3 2012: R+35.9 2008: R+29.2
Not yet ingested
- Civics
- —
Market trends
- HPI YoY
- ▼ -1.16%
- Current HPI
- 99.3493
- Rent YoY
- —
- Metro
- —
- State GDP YoY
- ▲ 1.68%
- F500 in state
- 34
Industry mix (Fortune 500 HQ in PA)
| Industry | F500 HQs | Revenue |
|---|---|---|
| Healthcare | 2 | $309B |
|
||
| Insurance | 2 | $27B |
|
||
| Telecommunications / Media | 1 | $124B |
|
||
| Industrial Distribution | 1 | $22B |
|
||
| Financial Services | 1 | $20B |
|
||
| Chemicals / Materials | 1 | $18B |
|
||
Price history
2 events — show timeline
- 2026-04-13 Pending — BRIGHT MLS
- 2026-02-23 Listed $125,000 BRIGHT MLS
Property tax history
+1.9%/yrLatest (2026): $2,982 · +1.9% YoY. Source: county tax records.
Cash-flow waterfall
monthlySold comps — $/sqft
last 12 mo · ≤1 miLoading sold comps…