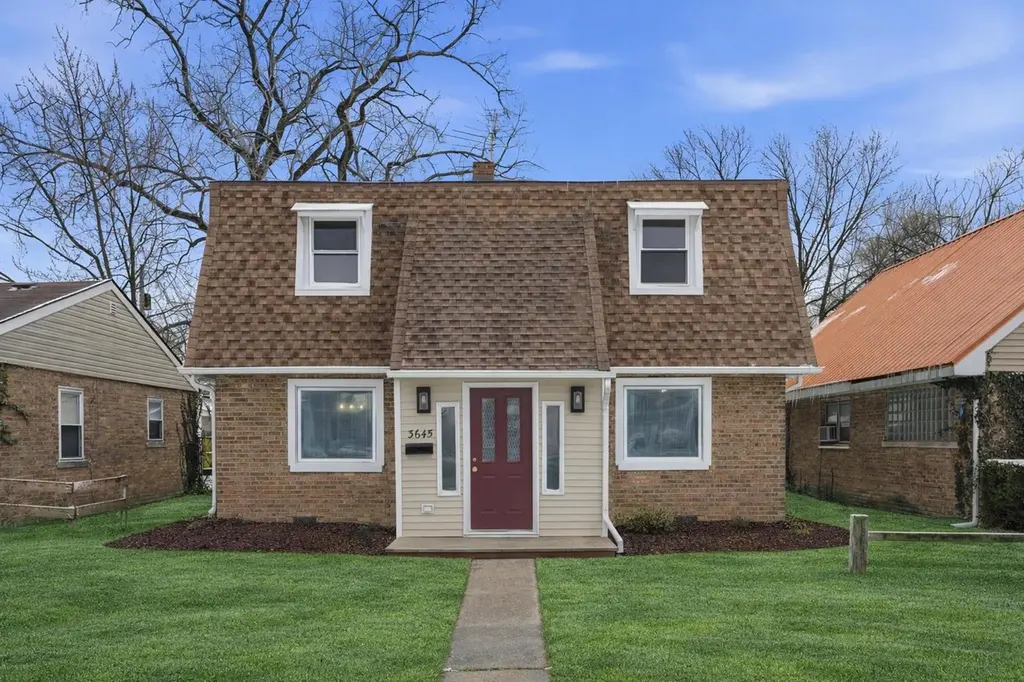
3645 177th Pl · Lansing, IL
Flood risk 3/10 · Minor
- FEMA flood zone
- X (shaded)
- Chance of flooding over 30 yrs
- 0.2%
- Est. flood insurance / yr
- $473 – $860
Fire risk 1/10 · Minimal
- Est. fire insurance / yr
- $804 – $1,492
Heat risk 3/10 · Minor
- Hot days now (above 102°F)
- 7 days/yr
- Hot days in 30 yrs
- 15 days/yr
Wind risk 2/10 · Minimal
- Chance of severe wind over 30 yrs
- 0.0%
Air-quality risk 4/10 · Minor
- Unhealthy air days now
- 5 days/yr
- Unhealthy air days in 30 yrs
- 6 days/yr
Risk factors via First Street. Map © Google.
Why this score? — see what drove the F grade
The composite is a weighted blend of 9 inputs, each scored 0–100. Each bar is that input's sub-score; the figure is the points it added to the 100-point composite (weight × sub-score).
- Cash flow +4.7/30.0
- Livability +3.7/5.0
- Rent growth +2.5/5.0
- Condition / age +2.5/5.0
- 1% rule +1.4/10.0
- Schools +1.0/10.0
- DSCR +0.0/10.0
- ARV discount +0.0/15.0
- Appreciation +0.0/10.0
$235,900
🖨 Deal sheet (PDF) 📄 Offer letter ✓ Due diligence
Listing remarks MLS
New luxury plank flooring, Needs a little TLC All offers welcome Fenced in backyard with patio and garage. Great location in Lansing. Possible 4th bedroom in loft upstairs. Ready to show Not far from schools, parks, restaurants and shops.
Key facts
- Open layout
- Brand new flooring
- Updated home
Tags
Neighborhood map
What this means for you Summary
Snapshot
- This is a 2-bed/1.0-bath single-family listed at $236k.
Deal economics
- At list price, monthly cash flow is $-582 ($-7k/yr) — negative.
- To cash-flow at today's rent, offer at most $133k (43.6% below list).
- To meet the 1% rule (rent ≥ 1% of price), the offer needs to be $151k (35.8% below list).
- Recommended offer: $133k (43.6% below list) — sets the bar for cash-flow.
- Cap rate 3.3% vs local median 5.9% in Lansing — below-typical yield; the buyer is paying a premium for something (appreciation thesis, condition, location) that the cap rate doesn't capture.
Location & tenants
- Location reads 73/100 on livability (#296 in IL) — a middle-class / working-renter tenant base. Strengths: commute A+, cost of living A+, housing A+; Watch: crime D+, health & safety D+, amenities F.
- Thornton Fractional Twp Hsd 215 (suburban): math 9% / reading 13% proficiency, ranked #563 of 620 in IL (top 91%) — low school quality limits family demand, transient renter base, plan for 1-2y turnover.
- Zoned schools: Coolidge Elementary School (math 5% / reading 27%, grade F, #1,231 of 2,056 statewide, top 60%, 666 students, 0% FRL); Memorial Jr High School (math 9% / reading 20%, grade F, #517 of 665 statewide, top 79%, 860 students, 0% FRL); Thornton Fractnl So High School (math 11% / reading 14%, grade F, #504 of 693 statewide, top 73%, 1,927 students, 0% FRL).
- Market conditions: 136 active listings in the ZIP; 12 comparable units currently listed for rent nearby; rentals leasing fast (median 1d on market — plan ~1-2 weeks tenant-placement turnaround); solid renter incomes; 6,272 units permitted in Cook County in 2024 (4,658 in 5+ unit buildings).
Forward outlook
- Local home prices are declining (-3.0%/yr); year-one equity from $2k of loan paydown is wiped out by about $7k of value loss. Plan a longer hold.
Negotiation context
- It's been on market 33 days — a 3% lower offer ($229k) is reasonable based on typical stale-listing flexibility.
- 7 sale attempts since 8y ago with the ask held roughly flat each time — persistent listings suggest the price (not the market) is what's stuck; bring a comps-based counter.
- Current owner paid $130k; list at $236k implies a 81% gain — meaningful room to come down on a strong offer.
Risks & watch-outs
- Watch-outs: built in 1947 — expect roof / HVAC / electrical / plumbing capex.
Questions for the listing agent
- What do current leases actually rent for vs. the listed asking? Can we see a recent rent roll and the last 12 months of T-12 income?
- It's been on market 33 days. Have you received any prior offers? Is the seller open to a 44% concession, seller financing, or rate buy-down credit?
- Built in 1947 — when were the roof, HVAC, electrical panel, plumbing, and water heater last replaced?
- Is there a deadline driving the sale (1031 exchange, divorce, estate, relocation)? That informs how much negotiation room exists.
- Schools are D-rated, which usually means shorter tenancies and higher turnover. Who's the typical renter profile here, and what's been the actual vacancy rate?
- Crime grade is D in this area — have there been break-ins, vandalism, or insurance claims at this property in the last 3 years? What carrier currently insures it and at what premium?
- The area grade is low — what's the realistic commute time and amenity access for the typical tenant pool here? Any planned neighborhood developments (good or bad) we should know about?
- What's the average days-on-market for RENTAL listings here right now (not sales)? A rising rental-DOM trend means longer vacancies and softer asking-rent achievability than the comps imply.
- What's the recent tenant-quality profile in this submarket — average credit score on applications, eviction rate, late-payment / NSF rate, and stable-employment percentage? A property-management company in the area should have these aggregated.
- How much new for-sale + rental construction is in the pipeline within 1–3 miles? Heavy new supply typically softens prices + rents 12–24 months out; constrained supply supports both.
Investment metrics
- 1% rule
- 0.64% ✗
- Cap rate
- 3.33%
- Cash-on-cash
- -10.58%
- DSCR
- 0.53
- GRM
- 13.0
CMA / ARV
- ARV (on-the-fly)
- $168,540
- Comps found
- 11
Show comp detail 11 sales within ~0.75 mi
| Address | Dist | Beds/Ba | Sqft | Sold | Price | $/sf | Match |
|---|---|---|---|---|---|---|---|
| 3659 Madison St | 0.33mi | 3/2.0 (+1) | 771 (-3%) | 2mo | $167,900 | $218 | 69 |
| 17617 Burnham Ave | 0.61mi | 2/1.0 | 812 (+2%) | 2mo | $130,100 | $160 | 66 |
| 17831 Walter St | 0.54mi | 2/1.0 | 854 (+7%) | 1mo | $185,900 | $218 | 62 |
| 3445 Adams St | 0.33mi | 2/1.0 | 768 (-3%) | 22mo | $195,000 | $254 | 61 |
| 7402 Harrison Ave | 0.73mi | 2/1.0 | 792 (-0%) | 7mo | $137,000 | $173 | 60 |
| 17642 Walter St | 0.56mi | 3/1.0 (+1) | 800 (+1%) | 12mo | $170,000 | $213 | 57 |
| 17552 Roy St | 0.54mi | 3/2.0 (+1) | 800 (+1%) | 12mo | $117,000 | $146 | 55 |
| 7536 Harrison Ave | 0.63mi | 2/1.0 | 786 (-1%) | 17mo | $149,900 | $191 | 54 |
| 17607 Community St | 0.44mi | 3/1.5 (+1) | 787 (-1%) | 22mo | $214,900 | $273 | 52 |
| 3127 179th St | 0.70mi | 2/1.0 | 868 (+9%) | 19mo | $168,500 | $194 | 36 |
| 3240 181st St | 0.66mi | 3/2.0 (+1) | 897 (+13%) | 22mo | $190,000 | $212 | 21 |
Match score weights: distance 35% · size 25% · config 20% · recency 20%. Top-matched comps best support the ARV.
Projected returns pro-forma
-3.0% appreciation · 3.0% rent growth · sell at horizon
- IRR
- -35.4%
- Equity multiple
- -0.14×
- Total profit
- $-75,201
- Equity at exit
- $35,173
- IRR
- -46.7%
- Equity multiple
- -0.71×
- Total profit
- $-112,779
- Equity at exit
- $20,396
Cash invested: $66,052 (down + closing). Projections, not guarantees.
Landlord ↔ Tenant lean methodology
- Overall (STATE)
- 43 Moderately Tenant-Leaning
- State Illinois
- 43 Moderately Tenant-Leaning · D+7
- County
- — inherits STATE
- City
- — inherits STATE
ZIP-level market 60438
- Active inventory
- 136
- Price-to-rent
- 13.0×
Monthly cashflow live
- Estimated rent
- $1,515 high interval (Pro) →
- Mortgage (P&I)
- −$1,237
- Tax from tax record
- −$444 /mo · $5,322/yr
- Insurance
- −$98
- HOA
- −$0
- Vacancy / Maint / Mgmt
- −$318
- Net cashflow
- $-582
Break-even live
Sensitivity live
| Price | -10% $-449 | -5% $-516 | +0% $-582 | +5% $-649 | +10% $-716 |
|---|---|---|---|---|---|
| Rent | -10% $-702 | -5% $-642 | +0% $-582 | +5% $-523 | +10% $-463 |
| Rate | -1.0pp $-464 | -0.5pp $-522 | base $-582 | +0.5pp $-643 | +1.0pp $-706 |
UW: 25.0% down · 7.5% · 30yr · 1.5% tax · 5.0% vac · 8.0% maint · 8.0% mgmt
Financing live
Cash to close
- Down payment
- $58,975
- Closing costs
- $7,077
- Reserves months
- —
- Total cash needed
- —
Loan-product check · same deal, 3 products live
Conventional
25% down · 7.5% · 30yr
- Down + closing
- —
- Monthly P&I
- —
- Monthly cashflow
- —
- DSCR
- —
- Eligible?
- —
Personal DTI + credit; lowest rate.
DSCR
20% down · 8.5% · 30yr
- Down + closing
- —
- Monthly P&I
- —
- Monthly cashflow
- —
- DSCR
- —
- Eligible?
- —
No personal income docs; deal must DSCR.
Hard money
10% down · 12.0% · 12mo
- Down + closing
- —
- Monthly P&I
- —
- Monthly cashflow
- —
- DSCR
- —
- Eligible?
- —
Short-term bridge; refi at stabilization.
Rent comps 12 comps
| Address | Beds | Baths | Sqft | Rent | $/sqft | DOM | Units | Dist |
|---|---|---|---|---|---|---|---|---|
| 3649 173rd Ct Lansing, IL | 2.0 | 2.0 | 972 | $1,357 | $1.40 | 26d | 1 | 0.45mi |
| 17104 Wentworth Ave Unit 4 Lansing, IL | 2.0 | 1.0 | 1100 | $1,400 | $1.27 | 1d | 1 | 0.78mi |
| 3020 178th St Unit C1 Lansing, IL | 2.0 | 1.0 | 900 | $1,550 | $1.72 | 1d | 1 | 0.82mi |
| 3020 178th St Apt C7 Lansing, IL | 2.0 | 1.0 | 900 | $1,550 | $1.72 | 26d | 1 | 0.83mi |
| 3069 Bernice Rd Apt 2N Lansing, IL | 3.0 | 1.0 | 950 | $1,535 | $1.62 | 22d | 1 | 0.85mi |
| 3069 Bernice Rd Apt 2S Lansing, IL | 3.0 | 1.0 | 950 | $1,535 | $1.62 | 4d | 1 | 0.85mi |
| 18335 Sherman St Unit 3 Lansing, IL | 3.0 | 1.0 | 1000 | $1,700 | $1.70 | 0d | 1 | 0.85mi |
| 3023 Bernice Rd Apt 2S Lansing, IL | 3.0 | 1.0 | 1000 | $1,600 | $1.60 | 0d | 1 | 0.90mi |
| 3023 Bernice Rd Unit 3030 3N Lansing, IL | 3.0 | 1.0 | 1000 | $1,400 | $1.40 | 1d | 1 | 0.90mi |
| 3007 Bernice Rd Unit 3007 1S Lansing, IL | 2.0 | 1.0 | 850 | $1,400 | $1.65 | 1d | 1 | 0.92mi |
| 1539 Wentworth Ave Unit 3W Calumet City, IL | 3.0 | 1.0 | 1100 | $1,700 | $1.55 | 14d | 1 | 1.09mi |
| 17723 Exchange Ave Unit 17723-1N Lansing, IL | 3.0 | 2.0 | 1100 | $1,800 | $1.64 | 0d | 1 | 1.21mi |
Listing history 33 events
-
2026-04-23status Pending
-
2026-03-28historical Contingent - Continue to Show
-
2026-03-20$235,900 Active
-
2025-09-09soldstatus $130,000
-
2025-08-15soldstatus $130,000 Closed 242-char remark
Show marketing remark (242 chars)
New luxury plank flooring, Needs a little TLC All offers welcome Fenced in backyard with patio and garage. Great location in Lansing. Possible 4th bedroom in loft upstairs. Ready to show Not far from schools, parks, restaurants and shops.
-
2025-08-07status Pending 242-char remark
Show marketing remark (242 chars)
New luxury plank flooring, Needs a little TLC All offers welcome Fenced in backyard with patio and garage. Great location in Lansing. Possible 4th bedroom in loft upstairs. Ready to show Not far from schools, parks, restaurants and shops.
-
2025-06-24$159,900 Active 242-char remark
Show marketing remark (242 chars)
New luxury plank flooring, Needs a little TLC All offers welcome Fenced in backyard with patio and garage. Great location in Lansing. Possible 4th bedroom in loft upstairs. Ready to show Not far from schools, parks, restaurants and shops.
-
2025-06-24historical
Show marketing remark (242 chars)
New luxury plank flooring, Needs a little TLC All offers welcome Fenced in backyard with patio and garage. Great location in Lansing. Possible 4th bedroom in loft upstairs. Ready to show Not far from schools, parks, restaurants and shops.
-
2025-06-01price
-
2025-05-22price
-
2025-05-10price
-
2021-06-29historical
-
2019-11-07soldstatus $80,500
-
2019-11-01soldstatus $80,500 Closed Sale
-
2019-10-04historical Contingent
-
2019-10-02status Reactivated
-
2019-09-27historical Contingent (Do Not Show)
-
2019-09-21$79,900 New
-
2019-08-13historical
-
2019-07-31status Contingent
-
2019-07-30historical
-
2019-07-24price
-
2019-06-22price
-
2019-05-31price
-
2019-04-11status Reactivated
-
2019-04-02historical
-
2019-03-30price
-
2019-02-03price
-
2019-01-10price
-
2018-12-08price
-
2018-11-13price
-
2018-11-10price
-
2018-10-12New
ⓘ Source: listings_history table (triggers on properties + properties_extension) + one-shot
backfill from property_details.listing_events for pre-trigger history.
Tax reassessment forecast IL · Partial reset (capped growth)
- Current annual tax
- $5,322 · $444/mo
- Projected year-2 tax
- $5,339 · $445/mo
- Expected delta
- +$16/yr (+$1/mo · 0.3%)
ⓘ Screening estimate from a state-policy table — verify with the county assessor before closing.
Climate risk First Street
- Flood 3/10 Moderate FEMA zone X (shaded) · 20% chance over 30 yrs
- Wildfire 1/10 Low
- Heat 3/10 Moderate 7 d/yr ≥102°F today · 15 d/yr by 30 yrs out
- Wind 2/10 Low 0% chance of damaging wind over 30 yrs
- Air quality 4/10 Moderate 5 unhealthy d/yr today · 6 by 30 yrs out
Nearby sold comps map
Loading sold comps map…
Walkable amenities ~0.75 mi
Loading nearby amenities…
Taxation est. · year 1
- Rental income
- $18,176
- − Mortgage interest
- −$13,214
- − Property taxes
- −$5,322
- − Insurance
- −$1,180
- − Repairs & maintenance
- −$1,454
- − Management
- −$1,454
- − Depreciation
- −$6,863
- Taxable loss
- −$11,311
- Est. tax savings @ 24.0%
- +$2,715
- After-tax cash flow
- $-4,273/yr
For passive investors: Depreciation is non-cash, so a rental often shows a tax loss while cash-flowing — sheltering income. Rental losses are passive: they offset passive income freely, and up to $25,000/yr can offset ordinary (W-2) income if you actively participate and your MAGI is under $100k (phasing out to $0 by $150k); unused losses carry forward. On sale, claimed depreciation is recaptured at up to 25%, and gains may owe capital-gains tax (a 1031 exchange can defer both). Figures are a year-1 estimate at your 24.0% rate — not tax advice; consult a CPA.
Schools (NCES district)
- District
- Thornton Fractional Twp Hsd 215
- NCES district ID
- 1738940
- Math proficiency
- 9% ▼ -3.00%
- Reading proficiency
- 13% ▼ -3.00%
- Median HH income
- $48,207
- Composite
- 10.27/100
- National rank
- #9793
- State rank
- #563 of 620 in IL
Livability — Lansing
- Score
- 73/100
- State rank
- #296
- US rank
- #5698
Category grades
Schools grade is shown separately in the Schools card above.
Census & demographics
- Census place
- Lansing, IL
- County
- Cook County · 4,486,803 people
- City population
- 28,806
- Metro
- Chicago-Naperville-Elgin, IL-IN-WI
- Population (ZIP)
- 28,806
- Household income
- $75,681
- Rent vs Own
- Severe rent burden
- 830.0
Population outlook (Cook County) Hauer SSP2
- Today (2025)
- 5,347,519 people
- By 2030
- 5,357,703 · +0.2%
- By 2040
- 5,324,924 · -0.4%
- By 2050
- 5,230,762 · -2.2%
- By 2075
- 4,785,735 · -10.5%
- By 2100
- 4,188,836 · -21.7%
Race, ethnicity, and origin ACS 2023
- Neighborhood character
- Diverse neighborhood (Simpson 0.65)
- Race & ethnicity
- Black 51% White 25% Hispanic / Latino 18% Two or more races 7% Asian 2%
- Hispanic origin (detail)
- Mexican 15%
- Common ancestry
- Romanian 5% Iranian 3% Lithuanian 1%
- Foreign-born
- 10% · Canada
- Languages at home
- 83% English-only · Spanish 12% Vietnamese 1% French/Haitian/Cajun 1%
Political lean MEDSL · Cook
- 2024 margin
- Solid D (+42.0) · D 70.4% · R 28.4% · Other 1.2%
- 2008→2024 swing
- -11.4pp toward R · 2008: 53.4pp · 2024: 42.0pp
- All cycles
- 2024: D+42.0 2020: D+50.3 2016: D+53.0 2012: D+49.4 2008: D+53.4
Not yet ingested
- Civics
- —
Market trends
- HPI YoY
- ▼ -151.65%
- Current HPI
- 210.3398
- Rent YoY
- —
- Metro
- Chicago-Naperville-Elgin, IL-IN-WI
- State GDP YoY
- ▲ 1.59%
- F500 in state
- 60
Industry mix (Fortune 500 HQ in IL)
| Industry | F500 HQs | Revenue |
|---|---|---|
| Insurance | 4 | $201B |
|
||
| Consumer Goods | 4 | $87B |
|
||
| Industrial Machinery | 3 | $64B |
|
||
| Healthcare | 2 | $55B |
|
||
| Retail / Pharmacy | 1 | $148B |
|
||
| Agriculture / Food | 1 | $86B |
|
||
Price history
+195.2% since first listed33 events — show timeline
- 2026-04-23 Pending — MRED as Distributed by MLS Grid
- 2026-03-28 Contingent — MRED as Distributed by MLS Grid
- 2026-03-20 Listed $235,900 MRED as Distributed by MLS Grid
- 2025-09-09 Sold (Public Records) $130,000 Public Records
- 2025-08-15 Sold (MLS) $130,000 MRED as Distributed by MLS Grid
- 2025-08-07 Pending — MRED as Distributed by MLS Grid
- 2025-06-24 Listing Removed — MRED as Distributed by MLS Grid
- 2025-06-24 Listed $159,900 MRED as Distributed by MLS Grid
- 2025-06-01 Price Changed — MRED as Distributed by MLS Grid
- 2025-05-22 Price Changed — MRED as Distributed by MLS Grid
- 2025-05-10 Price Changed — MRED as Distributed by MLS Grid
- 2021-06-29 Listing Removed — MRED as Distributed by MLS Grid
- 2019-11-07 Sold (Public Records) $80,500 Public Records
- 2019-11-01 Sold (MLS) $80,500 MRED as Distributed by MLS Grid
- 2019-10-04 Contingent — MRED as Distributed by MLS Grid
- 2019-10-02 Relisted — MRED as Distributed by MLS Grid
- 2019-09-27 Contingent — MRED as Distributed by MLS Grid
- 2019-09-21 Listed $79,900 MRED as Distributed by MLS Grid
- 2019-08-13 Listing Removed — MRED as Distributed by MLS Grid
- 2019-07-31 Relisted — MRED as Distributed by MLS Grid
- 2019-07-30 Listing Removed — MRED as Distributed by MLS Grid
- 2019-07-24 Price Changed — MRED as Distributed by MLS Grid
- 2019-06-22 Price Changed — MRED as Distributed by MLS Grid
- 2019-05-31 Price Changed — MRED as Distributed by MLS Grid
- 2019-04-11 Relisted — MRED as Distributed by MLS Grid
- 2019-04-02 Listing Removed — MRED as Distributed by MLS Grid
- 2019-03-30 Price Changed — MRED as Distributed by MLS Grid
- 2019-02-03 Price Changed — MRED as Distributed by MLS Grid
- 2019-01-10 Price Changed — MRED as Distributed by MLS Grid
- 2018-12-08 Price Changed — MRED as Distributed by MLS Grid
- 2018-11-13 Price Changed — MRED as Distributed by MLS Grid
- 2018-11-10 Price Changed — MRED as Distributed by MLS Grid
- 2018-10-12 Listed — MRED as Distributed by MLS Grid
Property tax history
+5.8%/yrLatest (2023): $5,322 · +4.6% YoY. Source: county tax records.
Cash-flow waterfall
monthlySold comps — $/sqft
last 12 mo · ≤1 miLoading sold comps…