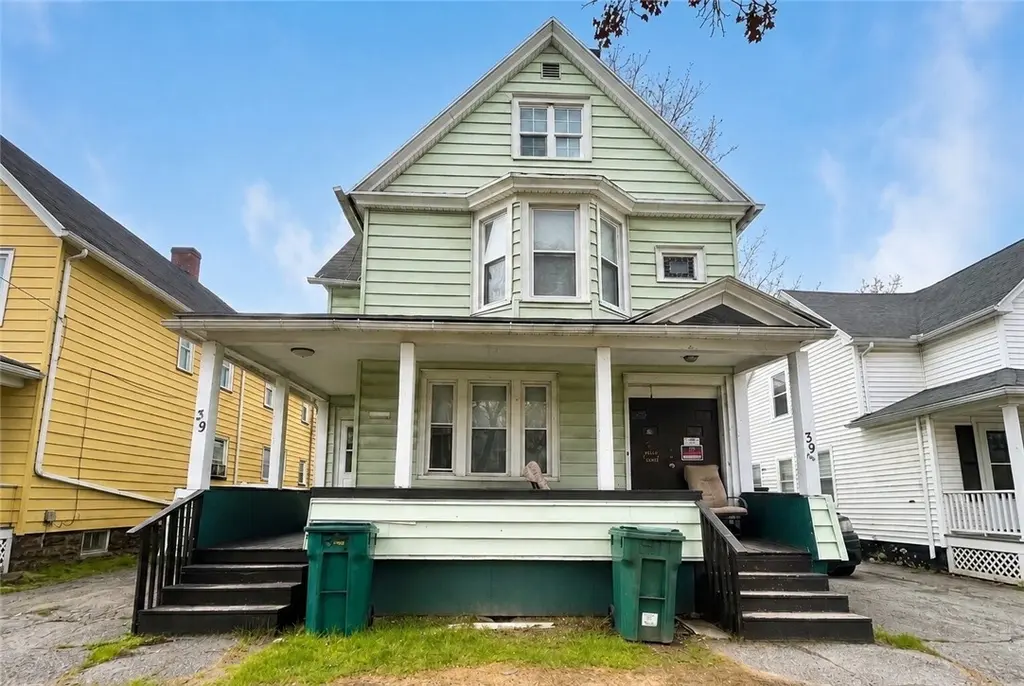
39 Austin St #39 · Rochester, NY
Flood risk 1/10 · Minimal
- FEMA flood zone
- X (unshaded)
- Chance of flooding over 30 yrs
- 0.0%
- Est. flood insurance / yr
- $473 – $860
Fire risk 1/10 · Minimal
- Est. fire insurance / yr
- $691 – $1,283
Heat risk 2/10 · Minimal
- Hot days now (above 96°F)
- 7 days/yr
- Hot days in 30 yrs
- 15 days/yr
Wind risk 1/10 · Minimal
- Chance of severe wind over 30 yrs
- —
Air-quality risk 2/10 · Minimal
- Unhealthy air days now
- 1 days/yr
- Unhealthy air days in 30 yrs
- 2 days/yr
Risk factors via First Street. Map © Google.
Why this score? — see what drove the B grade
The composite is a weighted blend of 9 inputs, each scored 0–100. Each bar is that input's sub-score; the figure is the points it added to the 100-point composite (weight × sub-score).
- Cash flow +30.0/30.0
- 1% rule +10.0/10.0
- DSCR +10.0/10.0
- ARV discount +7.7/15.0
- Rent growth +4.1/5.0
- Livability +3.8/5.0
- Condition / age +2.8/5.0
- Schools +1.9/10.0
- Appreciation +0.0/10.0
$122,500
🖨 Deal sheet 📄 Offer letter ✓ Due diligence
Listing remarks
Excellent investment opportunity in the heart of Rochester! Welcome to 39 Austin St, a spacious duplex offering strong income potential and immediate cash flow with tenants already in place. This well-sized multifamily property is an ideal addition to an investor’s portfolio or a great opportunity for an owner-occupant looking to offset expenses with rental income. Each unit features 3 generously sized bedrooms and 1 full bathroom, offering functional layouts, comfortable living spaces, and the room today’s tenants are looking for. Large windows bring in natural light throughout the property, while the spacious floor plans create a warm and inviting atmosphere. The property also
Key facts
- Large windows
- Immediate cash flow
- Spacious duplex
Tags
Property features AI
Finance
- Financial info: Two-unit building; Separate electric meters for each unit; One separate gas meter; Unit 1 rent $1,150 (actual); Unit 2 rent $1,025 (actual); Owner pays grounds care, trash collection, and water; Rent includes gardener, trash collection, and water; Operating expense details noted in remarks
Exterior
- Parking: Paved parking with two or more spaces
- Utilities: Electricity connected; High-speed internet available; Public water connected; Sewer connected
- Home design: 2-story multi-unit property; Resale property
- Construction: Vinyl siding; Asphalt roof; Existing structure
- Exterior features: Partial fencing; Covered porch; Porch; Near public transit; Rectangular residential lot; Lot dimensions approximately 39 x 120; Main thoroughfare / city street frontage
Interior
- Kitchen: Each unit includes an oven/range and refrigerator; Eat-in kitchen in each unit
- Bedrooms: Each unit has 3 bedrooms
- Flooring: Carpet; Vinyl; Varied flooring
- Bathrooms: Two full bathrooms total (one full bath in each unit)
- Heating & cooling: Gas forced-air heating
- Interior features: Storage
- Laundry & utility: Laundry in-unit (washer hookup); Gas water heater
Neighborhood map
What this means for you Summary
Snapshot
- This is a 6-bed/2.0-bath townhouse listed at $122k. Condition is rated average.
Deal economics
- At list price, monthly cash flow is $676 ($8k/yr) — positive.
- The deal already cash-flows at list — no discount required.
- Meets the 1% rule at list price ($2k rent vs $122k).
- Recommended offer: $121k (1.5% below list) — sets the bar for market timing.
- Cap rate 12.9% vs local median 9.3% in Rochester — top-decile yield for the area; either an underpriced asset or a hidden risk that comps aren't pricing in. Stress-test before assuming the spread holds.
Location & tenants
- Location reads 76/100 on livability (#222 in NY, #3,482 nationally) — a middle-class / working-renter tenant base. Strengths: commute A+, cost of living A+, housing A+; Watch: schools D+, crime F, employment F.
- Rochester City School District (urban): math 21% / reading 26% proficiency, ranked #589 of 590 in NY (top 100%) — low school quality limits family demand, transient renter base, plan for 1-2y turnover; 82% free/reduced lunch — lower-income household profile, screen leases tightly.
- Market conditions: Rents rising fast (+6.3%/yr); 124 active listings in the ZIP; 1 comparable units currently listed for rent nearby; 1,169 units permitted in Monroe County in 2024 (591 in 5+ unit buildings).
- This rent runs 41% of the median local income ($56k/yr) — at the standard rent-burdened threshold; future hikes will face affordability resistance.
Forward outlook
- Local home prices are declining (-3.0%/yr); year-one equity from $847 of loan paydown is wiped out by about $4k of value loss. Plan a longer hold.
- Monroe County population projected to shrink 6% by 2050 — rents likely to lag national; underwrite the cash flow, not the appreciation.
- At projected returns (-3.0% appreciation + 6.3% rent growth), your $34k cash investment doubles in ~5 years — after that, you're playing with house money.
Negotiation context
- It's been on market 26 days — a 2% lower offer ($121k) is reasonable based on typical stale-listing flexibility.
Risks & watch-outs
- Watch-outs: built in 1890 — expect roof / HVAC / electrical / plumbing capex.
Questions for the listing agent
- Built in 1890 — when were the roof, HVAC, electrical panel, plumbing, and water heater last replaced?
- Is there a deadline driving the sale (1031 exchange, divorce, estate, relocation)? That informs how much negotiation room exists.
- Schools are D-rated, which usually means shorter tenancies and higher turnover. Who's the typical renter profile here, and what's been the actual vacancy rate?
- Crime grade is F in this area — have there been break-ins, vandalism, or insurance claims at this property in the last 3 years? What carrier currently insures it and at what premium?
- What's the average days-on-market for RENTAL listings here right now (not sales)? A rising rental-DOM trend means longer vacancies and softer asking-rent achievability than the comps imply.
- What's the recent tenant-quality profile in this submarket — average credit score on applications, eviction rate, late-payment / NSF rate, and stable-employment percentage? A property-management company in the area should have these aggregated.
- How much new for-sale + rental construction is in the pipeline within 1–3 miles? Heavy new supply typically softens prices + rents 12–24 months out; constrained supply supports both.
Investment metrics
- 1% rule
- 1.57% ✓
- Cap rate
- 12.92%
- Cash-on-cash
- 23.67%
- DSCR
- 2.05
- GRM
- 5.3
CMA / ARV
- ARV (on-the-fly)
- $123,114
- Comps found
- 12
Show comp detail 12 sales within ~0.75 mi
| Address | Dist | Beds/Ba | Sqft | Sold | Price | $/sf | Match |
|---|---|---|---|---|---|---|---|
| 228 Sherman St | 0.28mi | 6/2.0 | 2,294 (-5%) | 11mo | $125,000 | $54 | 70 |
| 228 Parkway | 0.51mi | 6/2.0 | 2,276 (-6%) | 6mo | $116,000 | $51 | 62 |
| 1179-1177 Lyell Ave #1177 | 0.68mi | 6/2.0 | 2,432 (+1%) | 9mo | $160,000 | $66 | 60 |
| 12 Warner St | 0.15mi | 6/2.5 | 2,634 (+9%) | 19mo | $80,000 | $30 | 59 |
| 69 Locust St | 0.61mi | 6/2.0 | 2,425 (+0%) | 21mo | $83,000 | $34 | 54 |
| 53 Locust St | 0.64mi | 5/3.0 (-1) | 2,376 (-2%) | 9mo | $63,000 | $27 | 51 |
| 485 Child St | 0.43mi | 6/2.0 | 2,668 (+10%) | 20mo | $80,000 | $30 | 45 |
| 100-102 Parkway | 0.58mi | 5/2.0 (-1) | 2,130 (-12%) | 4mo | $130,000 | $61 | 45 |
| 463-465 Glenwood Ave | 0.66mi | 6/2.0 | 2,580 (+7%) | 16mo | $162,500 | $63 | 44 |
| 866 Smith St | 0.52mi | 5/2.0 (-1) | 2,071 (-14%) | 4mo | $65,000 | $31 | 44 |
| 121 Emerson St | 0.70mi | 6/2.0 | 2,288 (-5%) | 18mo | $95,000 | $42 | 44 |
| 145 Glendale Park | 0.60mi | 6/2.0 | 2,088 (-14%) | 11mo | $130,000 | $62 | 40 |
Match score weights: distance 35% · size 25% · config 20% · recency 20%. Top-matched comps best support the ARV.
Projected returns pro-forma
-3.0% appreciation · 6.28% rent growth · sell at horizon
- IRR
- 20.5%
- Equity multiple
- 1.87×
- Total profit
- $29,834
- Equity at exit
- $18,265
- IRR
- 30.8%
- Equity multiple
- 4.22×
- Total profit
- $110,422
- Equity at exit
- $10,592
Cash invested: $34,300 (down + closing). Projections, not guarantees.
Landlord ↔ Tenant lean methodology
- Overall (STATE)
- 15 Strongly Tenant-Friendly
- State New York
- 15 Strongly Tenant-Friendly · D+10
- County
- — inherits STATE
- City
- — inherits STATE
ZIP-level market 14606
- Home prices YoY
- -17.9%
- Rents YoY
- 6.3%
- Active inventory
- 124
- Price-to-rent
- 5.3×
Monthly cashflow live
- Estimated rent
- $1,928 medium interval (Pro) →
- Mortgage (P&I)
- −$642
- Tax est. 1.5%
- −$153 /mo · $1,838/yr
- Insurance
- −$51
- HOA
- −$0
- Vacancy / Maint / Mgmt
- −$405
- Net cashflow
- $676
Break-even live
UW: 25.0% down · 7.5% · 30yr · 1.5% tax · 5.0% vac · 8.0% maint · 8.0% mgmt
Financing live
Cash to close
- Down payment
- $30,625
- Closing costs
- $3,675
- Reserves months
- —
- Total cash needed
- —
Loan-product check · same deal, 3 products live
Conventional
25% down · 7.5% · 30yr
- Down + closing
- —
- Monthly P&I
- —
- Monthly cashflow
- —
- DSCR
- —
- Eligible?
- —
Personal DTI + credit; lowest rate.
DSCR
20% down · 8.5% · 30yr
- Down + closing
- —
- Monthly P&I
- —
- Monthly cashflow
- —
- DSCR
- —
- Eligible?
- —
No personal income docs; deal must DSCR.
Hard money
10% down · 12.0% · 12mo
- Down + closing
- —
- Monthly P&I
- —
- Monthly cashflow
- —
- DSCR
- —
- Eligible?
- —
Short-term bridge; refi at stabilization.
Rent comps 1 comps
| Address | Beds | Baths | Sqft | Rent | $/sqft | DOM | Units | Dist |
|---|---|---|---|---|---|---|---|---|
| 649 Jay St Rochester, NY | 5.0 | 2.0 | 2144 | $2,000 | $0.93 | 3d | 1 | 0.62mi |
Listing history 15 events
-
2026-06-18days on market $122,500 Active 26 DOM
-
2026-06-17days on market $122,500 Active 25 DOM
-
2026-06-16days on market $122,500 Active 24 DOM
-
2026-06-15days on market $122,500 Active 23 DOM
-
2026-06-13days on market $122,500 Active 21 DOM
-
2026-06-13days on market $122,500 Active 20 DOM
-
2026-06-10days on market $122,500 Active 18 DOM
-
2026-06-09days on market $122,500 Active 17 DOM
-
2026-06-09days on market $122,500 Active 16 DOM
-
2026-06-07days on market $122,500 Active 15 DOM
-
2026-06-05days on market $122,500 Active 12 DOM
-
2026-06-03days on market $122,500 Active 11 DOM
-
2026-06-03days on market $122,500 Active 10 DOM
-
2026-06-01days on market $122,500 Active 9 DOM
-
2026-05-31days on market $122,500 Active 8 DOM
ⓘ Source: listings_history table (triggers on properties + properties_extension) + one-shot
backfill from property_details.listing_events for pre-trigger history.
Climate risk First Street
- Flood 1/10 Low FEMA zone X (unshaded) · 0% chance over 30 yrs
- Wildfire 1/10 Low
- Heat 2/10 Low 7 d/yr ≥96°F today · 15 d/yr by 30 yrs out
- Wind 1/10 Low
- Air quality 2/10 Low 1 unhealthy d/yr today · 2 by 30 yrs out
Nearby sold comps map
Loading sold comps map…
Walkable amenities ~0.75 mi
Loading nearby amenities…
Taxation est. · year 1
- Rental income
- $23,135
- − Mortgage interest
- −$6,862
- − Property taxes
- −$1,838
- − Insurance
- −$612
- − Repairs & maintenance
- −$1,851
- − Management
- −$1,851
- − Depreciation
- −$3,564
- Taxable income
- $6,557
- Est. tax owed @ 24.0%
- −$1,574
- After-tax cash flow
- $6,544/yr
For passive investors: Depreciation is non-cash, so a rental often shows a tax loss while cash-flowing — sheltering income. Rental losses are passive: they offset passive income freely, and up to $25,000/yr can offset ordinary (W-2) income if you actively participate and your MAGI is under $100k (phasing out to $0 by $150k); unused losses carry forward. On sale, claimed depreciation is recaptured at up to 25%, and gains may owe capital-gains tax (a 1031 exchange can defer both). Figures are a year-1 estimate at your 24.0% rate — not tax advice; consult a CPA.
Condition & rehab AI · 1 photo
This townhouse presents an average condition with moderate repairs needed, primarily to the exterior siding and interior walls. Fresh paint and siding repairs would significantly enhance its curb appeal and value.
Repairs flagged
- Moderate exterior siding — Weathered appearance
- Moderate interior walls — Paint appears worn
Value-add opportunities
- Both paint interior walls — Fresh paint enhances curb appeal and interior aesthetics
- Both repair exterior siding — Fresh siding improves curb appeal and structural integrity
Renovation cost estimate screening
| Repair item | Severity | Est. cost |
|---|---|---|
| exterior siding · Weathered appearance | Moderate | $3,000–15,000 |
| interior walls · Paint appears worn | Moderate | $3,000–15,000 |
| Total estimated repair cost · 2 items | $6,000–30,000 |
Value-add ROI direction
- Both paint interior walls — Fresh paint enhances curb appeal and interior aesthetics ↑
- Both repair exterior siding — Fresh siding improves curb appeal and structural integrity ↑
ⓘ Cost ranges are severity-bucket heuristics (US national rule-of-thumb). Get contractor quotes + a written scope before underwriting a rehab budget.
Schools (NCES district)
- District
- Rochester City School District
- NCES district ID
- 3624750
- Math proficiency
- 21% ▬ 0.00%
- Reading proficiency
- 26% ▲ 4.00%
- Median HH income
- $30,923
- Composite
- 18.98/100
- National rank
- #8850
- State rank
- #589 of 590 in NY
Livability — Rochester
- Score
- 76/100
- State rank
- #222
- US rank
- #3482
Category grades
Schools grade is shown separately in the Schools card above.
Census & demographics
- Census place
- Rochester, NY
- County
- Monroe County · 674,131 people
- City population
- 432,803
- Metro
- Rochester, NY
- Population (ZIP)
- 25,538
- Household income
- $55,807
- Rent vs Own
- Severe rent burden
- 986.0
Population outlook (Monroe County) Hauer SSP2
- Today (2025)
- 759,460 people
- By 2030
- 757,154 · -0.3%
- By 2040
- 740,644 · -2.5%
- By 2050
- 714,443 · -5.9%
- By 2075
- 645,883 · -15.0%
- By 2100
- 547,084 · -28.0%
Race, ethnicity, and origin ACS 2023
- Neighborhood character
- Diverse neighborhood (Simpson 0.64)
- Race & ethnicity
- White 51% Black 26% Hispanic / Latino 17% Two or more races 8% Asian 3%
- Hispanic origin (detail)
- Puerto Rican 12% Cuban 2%
- Common ancestry
- Romanian 3% Lithuanian 1% Iranian 1%
- Foreign-born
- 10% · Canada, Vietnam, Philippines
- Languages at home
- 79% English-only · Spanish 12% Other Indo-European 3% Other Asian/Pacific 2%
Political lean MEDSL · Monroe
- 2024 margin
- D (+19.1) · D 59.5% · R 40.5%
- 2008→2024 swing
- +1.4pp toward D · 2008: 17.7pp · 2024: 19.1pp
- All cycles
- 2024: D+19.1 2020: D+21.0 2016: D+14.1 2012: D+17.4 2008: D+17.7
Not yet ingested
- Civics
- —
Market trends
- HPI YoY
- ▼ -62.59%
- Current HPI
- 287.6868
- Rent YoY
- ▲ 6.28%
- Metro
- Rochester, NY
- State GDP YoY
- ▲ 2.60%
- F500 in state
- 92
Industry mix (Fortune 500 HQ in NY)
| Industry | F500 HQs | Revenue |
|---|---|---|
| Financial Services | 10 | $950B |
|
||
| Consumer Goods | 9 | $162B |
|
||
| Insurance | 4 | $225B |
|
||
| Telecommunications | 2 | $144B |
|
||
| Pharmaceuticals | 2 | $112B |
|
||
| Media / Entertainment | 2 | $69B |
|
||
Price history
1 event — show timeline
- 2026-05-23 Listed $122,500 UNYREIS
Cash-flow waterfall
monthlySold comps — $/sqft
last 12 mo · ≤1 miLoading sold comps…