6421 Sunnyside Ranch Rd · Hill 'n Dale, FL
Flood risk 1/10 · Minimal
- FEMA flood zone
- X (unshaded)
- Chance of flooding over 30 yrs
- 0.0%
- Est. flood insurance / yr
- $507 – $1,088
Fire risk 6/10 · Moderate
- Est. fire insurance / yr
- $947 – $1,759
Heat risk 9/10 · Severe
- Hot days now (above 108°F)
- 7 days/yr
- Hot days in 30 yrs
- 24 days/yr
Wind risk 9/10 · Severe
- Chance of severe wind over 30 yrs
- 99.0%
Air-quality risk 1/10 · Minimal
- Unhealthy air days now
- 0 days/yr
- Unhealthy air days in 30 yrs
- 0 days/yr
Risk factors via First Street. Map © Google.
Why this score? — see what drove the D grade
The composite is a weighted blend of 9 inputs, each scored 0–100. Each bar is that input's sub-score; the figure is the points it added to the 100-point composite (weight × sub-score).
- Cash flow +13.9/30.0
- ARV discount +7.5/15.0
- DSCR +4.2/10.0
- Schools +4.2/10.0
- 1% rule +2.9/10.0
- Rent growth +2.5/5.0
- Livability +2.5/5.0
- Condition / age +2.5/5.0
- Appreciation +0.0/10.0
$275,000
🖨 Deal sheet (PDF) 📄 Offer letter ✓ Due diligence
Listing remarks
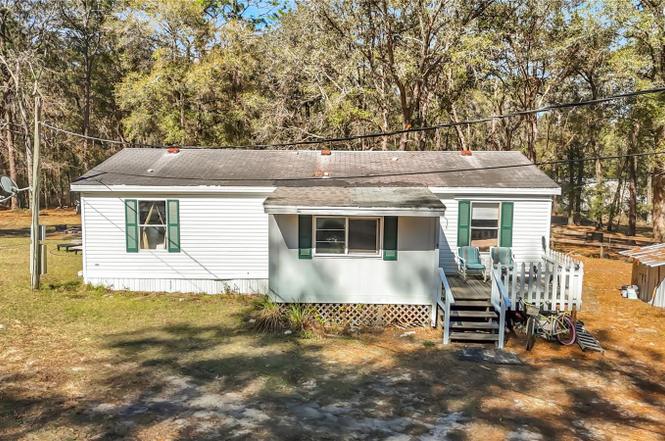
Welcome to your private paradise! This charming 3-bedroom, 2-bath home sits on nearly 3 acres of peaceful, partially cleared land while preserving a beautiful wooded setting. The property is perfect for horse lovers, featuring a brand-new 24x36 barn with two spacious horse stalls, a newly fenced pasture, and a fully fenced perimeter to ensure safety and privacy. Wander along the magical solar-lit woodland walkway that leads to a picturesque gazebo and cozy fire pit, creating a serene escape for relaxation and gatherings. With a loop-around driveway, there's ample space to park and turn trailers with ease. HOME IS LOCATED ON SLOPED PROPERTY, FLOOD ZONE X. No need to worry about flooding! Ins
Key facts
- Newly fenced pasture
- Nearly 3 acres
- Brand-new barn
Tags
Property features AI
Finance
- Other: Zoned AG (agricultural); Lot approximately 2.2 acres (2 to less than 5 acres); Roads on property are dirt and gravel; Barn features include horse barn and pole barn
- HOA & community: No HOA indicated
Exterior
- Parking: Driveway access
- Utilities: Private well water; Septic tank; Cable available and connected; Electricity available and connected; Water available and connected
- Home design: Manufactured double wide home; Single-story; Faces southeast; One-level entry
- Construction: Vinyl siding; Shingle roof; Crawlspace foundation; Built as manufactured home
- Exterior features: Dog run; Fire pit; Exterior lighting; Outdoor storage
Interior
- Kitchen: Refrigerator
- Bedrooms: 3 bedrooms
- Flooring: Carpet
- Bathrooms: 2 full bathrooms
- Heating & cooling: Central heating; Electric heating; Heat pump; Central air
- Interior features: Ceiling fans; High ceilings; Open floor plan; Solid surface counters; Split bedroom layout; Thermostat
- Laundry & utility: Washer; Dryer; Laundry in common area
Neighborhood map
What this means for you Summary
Snapshot
- This is a 3-bed/2.0-bath manufactured listed at $275k.
Deal economics
- At list price, monthly cash flow is $29 ($354/yr) — positive.
- The deal already cash-flows at list — no discount required.
- To meet the 1% rule (rent ≥ 1% of price), the offer needs to be $218k (20.8% below list).
- Recommended offer: $218k (20.8% below list) — sets the bar for 1% rule.
- Cap rate 6.4% vs local median 5.3% in Hill 'n Dale — meaningfully above typical; check what's discounted (condition, days-on-market, listing class) to confirm the premium yield is real.
Location & tenants
- Location reads: area grade D — affects rentability + tenant quality, not the cash-flow math above.
- Hernando (suburban): math 50% / reading 50% proficiency, ranked #38 of 73 in FL (top 52%) — acceptable for families but not a draw, mixed tenant base, ~2y average lease.
- Market conditions: 187 active listings in the ZIP; 3 comparable units currently listed for rent nearby; rentals at typical pace (median 25d on market — plan ~3-4 weeks tenant-placement turnaround); 2,505 units permitted in Hernando County in 2024 (318 in 5+ unit buildings).
Forward outlook
- Local home prices are declining (-3.0%/yr); year-one equity from $2k of loan paydown is wiped out by about $8k of value loss. Plan a longer hold.
- Hernando County population projected at +11% by 2050 — modest demand growth; plan on rents tracking national, not racing it.
Negotiation context
- It's been on market 139 days — a 12% lower offer ($242k) is reasonable based on typical stale-listing flexibility.
- 19 sale attempts since 23y ago with the ask held roughly flat each time — persistent listings suggest the price (not the market) is what's stuck; bring a comps-based counter.
- Current owner paid $115k; list at $275k implies a 139% gain — meaningful room to come down on a strong offer.
Risks & watch-outs
- Climate carrying-cost: severe wind risk, 99% chance of damaging wind over 30y; major wildfire risk; extreme-heat days projected 7→24/yr by 2055 (HVAC capex compounding) — expect insurance premiums to compound above CPI over the hold.
Questions for the listing agent
- It's been on market 139 days. Have you received any prior offers? Is the seller open to a 21% concession, seller financing, or rate buy-down credit?
- Why hasn't it sold? Are there any deal-killer items the seller is aware of (foundation, flood, title, zoning, code violations)?
- Is there a deadline driving the sale (1031 exchange, divorce, estate, relocation)? That informs how much negotiation room exists.
- The area grade is low — what's the realistic commute time and amenity access for the typical tenant pool here? Any planned neighborhood developments (good or bad) we should know about?
- What's the average days-on-market for RENTAL listings here right now (not sales)? A rising rental-DOM trend means longer vacancies and softer asking-rent achievability than the comps imply.
- What's the recent tenant-quality profile in this submarket — average credit score on applications, eviction rate, late-payment / NSF rate, and stable-employment percentage? A property-management company in the area should have these aggregated.
- How much new for-sale + rental construction is in the pipeline within 1–3 miles? Heavy new supply typically softens prices + rents 12–24 months out; constrained supply supports both.
Investment metrics
- 1% rule
- 0.79% ✗
- Cap rate
- 6.42%
- Cash-on-cash
- 0.46%
- DSCR
- 1.02
- GRM
- 10.5
CMA / ARV
No comps found within radius.
Projected returns pro-forma
-3.0% appreciation · 3.0% rent growth · sell at horizon
- IRR
- -15.6%
- Equity multiple
- 0.44×
- Total profit
- $-42,780
- Equity at exit
- $41,003
- IRR
- -7.2%
- Equity multiple
- 0.54×
- Total profit
- $-35,226
- Equity at exit
- $23,777
Cash invested: $77,000 (down + closing). Projections, not guarantees.
Landlord ↔ Tenant lean methodology
- Overall (STATE)
- 87 Strongly Landlord-Friendly
- State Florida
- 87 Strongly Landlord-Friendly · R+3
- County
- — inherits STATE
- City
- — inherits STATE
ZIP-level market 34602
- Home prices YoY
- -21.1%
- Active inventory
- 187
- Price-to-rent
- 10.5×
Monthly cashflow live
- Estimated rent
- $2,177 medium interval (Pro) →
- Mortgage (P&I)
- −$1,442
- Tax from tax record
- −$134 /mo · $1,604/yr
- Insurance
- −$115
- HOA
- −$0
- Vacancy / Maint / Mgmt
- −$457
- Net cashflow
- $29
Break-even live
Sensitivity live
| Price | -10% $185 | -5% $107 | +0% $29 | +5% $-48 | +10% $-126 |
|---|---|---|---|---|---|
| Rent | -10% $-143 | -5% $-57 | +0% $29 | +5% $115 | +10% $201 |
| Rate | -1.0pp $168 | -0.5pp $99 | base $29 | +0.5pp $-42 | +1.0pp $-114 |
UW: 25.0% down · 7.5% · 30yr · 1.5% tax · 5.0% vac · 8.0% maint · 8.0% mgmt
Financing live
Cash to close
- Down payment
- $68,750
- Closing costs
- $8,250
- Reserves months
- —
- Total cash needed
- —
Loan-product check · same deal, 3 products live
Conventional
25% down · 7.5% · 30yr
- Down + closing
- —
- Monthly P&I
- —
- Monthly cashflow
- —
- DSCR
- —
- Eligible?
- —
Personal DTI + credit; lowest rate.
DSCR
20% down · 8.5% · 30yr
- Down + closing
- —
- Monthly P&I
- —
- Monthly cashflow
- —
- DSCR
- —
- Eligible?
- —
No personal income docs; deal must DSCR.
Hard money
10% down · 12.0% · 12mo
- Down + closing
- —
- Monthly P&I
- —
- Monthly cashflow
- —
- DSCR
- —
- Eligible?
- —
Short-term bridge; refi at stabilization.
Rent comps 3 comps
| Address | Beds | Baths | Sqft | Rent | $/sqft | DOM | Units | Dist |
|---|---|---|---|---|---|---|---|---|
| 27108 Simona Ave Brooksville, FL | 3.0 | 1.0 | 1092 | $1,700 | $1.56 | 25d | 1 | 0.22mi |
| 6367 Enterprise Dr Unit 1234457P Brooksville, FL | 3.0 | 2.0 | 1119 | $3,367 | $3.01 | 0d | 1 | 0.35mi |
| 27008 Anthony Ave Brooksville, FL | 3.0 | 2.0 | 1043 | $1,795 | $1.72 | 25d | 1 | 0.35mi |
Listing history 50 events
-
2026-06-21days on market $275,000 Active 139 DOM
-
2026-06-18days on market $275,000 Active 136 DOM
-
2026-06-17days on market $275,000 Active 135 DOM
-
2026-06-16days on market $275,000 Active 134 DOM
-
2026-06-15days on market $275,000 Active 133 DOM
-
2026-06-13days on market $275,000 Active 131 DOM
-
2026-06-13days on market $275,000 Active 130 DOM
-
2026-06-09days on market $275,000 Active 127 DOM
-
2026-06-08days on market $275,000 Active 126 DOM
-
2026-06-07days on market $275,000 Active 125 DOM
-
2026-06-04days on market $275,000 Active 122 DOM
-
2026-06-03days on market $275,000 Active 121 DOM
-
2026-06-02days on market $275,000 Active 120 DOM
-
2026-06-01days on market $275,000 Active 119 DOM
-
2026-05-31days on market $275,000 Active 118 DOM
-
2026-02-02$275,000 Active
-
2025-12-04historical
-
2025-12-04historical
-
2025-01-13price $275,000
-
2025-01-13price $275,000
-
2024-10-17price $299,999
-
2024-10-17price $299,999
-
2024-09-20$325,000 Active
-
2024-09-20$325,000 Active
-
2024-07-23historical
-
2024-06-20status Active
-
2024-06-15historical
-
2024-06-02price $349,999
-
2024-05-22price $352,000
-
2024-05-20price $362,500
-
2024-04-25price $389,000
-
2024-03-19price $399,000
-
2024-03-06$425,000 Active
-
2022-04-01soldstatus $115,000
-
2022-03-30soldstatus $115,000 Closed
-
2022-03-30soldstatus $115,000 Closed
-
2022-03-30soldstatus $115,000
-
2022-02-09status Pending
-
2022-02-09historical Active Under Contract - Accepting Back Up Offers
-
2022-02-03price $127,900
-
2022-02-02price $127,900
-
2022-01-18status Active
-
2022-01-18status Active
-
2022-01-14status Pending
-
2022-01-14historical Active Under Contract - Accepting Back Up Offers
-
2022-01-12status Active
-
2022-01-12status Active
-
2021-12-29historical Active Under Contract - Accepting Back Up Offers
-
2021-12-29status Pending
-
2021-12-08price $137,900
ⓘ Source: listings_history table (triggers on properties + properties_extension) + one-shot
backfill from property_details.listing_events for pre-trigger history.
Tax reassessment forecast FL · Resets to sale price
- Current annual tax
- $1,604 · $134/mo
- Projected year-2 tax
- $2,282 · $190/mo
- Expected delta
- +$679/yr (+$57/mo · 42.3%)
ⓘ Screening estimate from a state-policy table — verify with the county assessor before closing.
Climate risk First Street
- Flood 1/10 Low FEMA zone X (unshaded) · 0% chance over 30 yrs
- Wildfire 6/10 Major
- Heat 9/10 Extreme 7 d/yr ≥108°F today · 24 d/yr by 30 yrs out
- Wind 9/10 Extreme 99% chance of damaging wind over 30 yrs
- Air quality 1/10 Low 0 unhealthy d/yr today · 0 by 30 yrs out
Nearby sold comps map
Loading sold comps map…
Walkable amenities ~0.75 mi
Loading nearby amenities…
Taxation est. · year 1
- Rental income
- $26,124
- − Mortgage interest
- −$15,404
- − Property taxes
- −$1,604
- − Insurance
- −$1,375
- − Repairs & maintenance
- −$2,090
- − Management
- −$2,090
- − Depreciation
- −$8,000
- Taxable loss
- −$4,439
- Est. tax savings @ 24.0%
- +$1,065
- After-tax cash flow
- $1,419/yr
For passive investors: Depreciation is non-cash, so a rental often shows a tax loss while cash-flowing — sheltering income. Rental losses are passive: they offset passive income freely, and up to $25,000/yr can offset ordinary (W-2) income if you actively participate and your MAGI is under $100k (phasing out to $0 by $150k); unused losses carry forward. On sale, claimed depreciation is recaptured at up to 25%, and gains may owe capital-gains tax (a 1031 exchange can defer both). Figures are a year-1 estimate at your 24.0% rate — not tax advice; consult a CPA.
Schools (NCES district)
- District
- Hernando
- NCES district ID
- 1200810
- Math proficiency
- 50% ▼ -8.00%
- Reading proficiency
- 50% ▼ -4.00%
- Median HH income
- $41,985
- Composite
- 42.03/100
- National rank
- #3329
- State rank
- #38 of 73 in FL
Livability — Hill 'n Dale
No livability data for this city. (Only ~50 U.S. cities are tracked.)
Census & demographics
- Population (ZIP)
- 10,391
Population outlook (Hernando County) Hauer SSP2
- Today (2025)
- 189,218 people
- By 2030
- 194,367 · +2.7%
- By 2040
- 203,398 · +7.5%
- By 2050
- 209,589 · +10.8%
- By 2075
- 218,452 · +15.4%
- By 2100
- 205,923 · +8.8%
Race, ethnicity, and origin ACS 2023
- Neighborhood character
- Predominantly White (71%)
- Race & ethnicity
- White 71% Hispanic / Latino 14% Black 11% Two or more races 7%
- Hispanic origin (detail)
- Mexican 5% Puerto Rican 4% Cuban 2%
- Common ancestry
- Romanian 3% Lithuanian 2% Slovak 1%
- Foreign-born
- 5% · Canada, Dominican Republic, China
- Languages at home
- 90% English-only · Spanish 8%
Political lean MEDSL · Hernando
- 2024 margin
- Solid R (+37.0) · D 31.1% · R 68.2%
- 2008→2024 swing
- -33.5pp toward R · 2008: -3.6pp · 2024: -37.0pp
- All cycles
- 2024: R+37.0 2020: R+30.2 2016: R+29.0 2012: R+8.5 2008: R+3.6
Not yet ingested
- Civics
- —
Market trends
- HPI YoY
- ▼ -75.28%
- Current HPI
- 282.3728
- Rent YoY
- —
- Metro
- —
- State GDP YoY
- ▲ 3.28%
- F500 in state
- 36
Industry mix (Fortune 500 HQ in FL)
| Industry | F500 HQs | Revenue |
|---|---|---|
| Industrial Technology | 2 | $29B |
|
||
| Insurance | 2 | $17B |
|
||
| Retail | 1 | $60B |
|
||
| Technology Distribution | 1 | $58B |
|
||
| Homebuilding | 1 | $35B |
|
||
| Technology Manufacturing | 1 | $35B |
|
||
Price history
+1685.7% since first listed56 events — show timeline
- 2026-02-02 Listed $275,000 Stellar MLS as Distributed by MLS Grid
- 2025-12-04 Listing Removed — HCAR
- 2025-12-04 Listing Removed — Stellar MLS as Distributed by MLS Grid
- 2025-01-13 Price Changed $275,000 Stellar MLS as Distributed by MLS Grid
- 2025-01-13 Price Changed $275,000 HCAR
- 2024-10-17 Price Changed $299,999 HCAR
- 2024-10-17 Price Changed $299,999 Stellar MLS as Distributed by MLS Grid
- 2024-09-20 Listed $325,000 HCAR
- 2024-09-20 Listed $325,000 Stellar MLS as Distributed by MLS Grid
- 2024-07-23 Listing Removed — Stellar MLS as Distributed by MLS Grid
- 2024-06-20 Relisted — Stellar MLS as Distributed by MLS Grid
- 2024-06-15 Listing Removed — Stellar MLS as Distributed by MLS Grid
- 2024-06-02 Price Changed $349,999 Stellar MLS as Distributed by MLS Grid
- 2024-05-22 Price Changed $352,000 Stellar MLS as Distributed by MLS Grid
- 2024-05-20 Price Changed $362,500 Stellar MLS as Distributed by MLS Grid
- 2024-04-25 Price Changed $389,000 Stellar MLS as Distributed by MLS Grid
- 2024-03-19 Price Changed $399,000 Stellar MLS as Distributed by MLS Grid
- 2024-03-06 Listed $425,000 Stellar MLS as Distributed by MLS Grid
- 2022-04-01 Sold (Public Records) $115,000 Public Records
- 2022-03-30 Sold (MLS) $115,000 St. Augustine and St. Johns County Board of REALTORS®
- 2022-03-30 Sold (MLS) $115,000 Stellar MLS as Distributed by MLS Grid
- 2022-03-30 Sold (MLS) $115,000 HCAR
- 2022-02-09 Pending — Stellar MLS as Distributed by MLS Grid
- 2022-02-09 Contingent — HCAR
- 2022-02-03 Price Changed $127,900 HCAR
- 2022-02-02 Price Changed $127,900 Stellar MLS as Distributed by MLS Grid
- 2022-01-18 Relisted — Stellar MLS as Distributed by MLS Grid
- 2022-01-18 Relisted — HCAR
- 2022-01-14 Pending — Stellar MLS as Distributed by MLS Grid
- 2022-01-14 Contingent — HCAR
- 2022-01-12 Relisted — HCAR
- 2022-01-12 Relisted — Stellar MLS as Distributed by MLS Grid
- 2021-12-29 Contingent — HCAR
- 2021-12-29 Pending — Stellar MLS as Distributed by MLS Grid
- 2021-12-08 Price Changed $137,900 HCAR
- 2021-12-08 Relisted — Stellar MLS as Distributed by MLS Grid
- 2021-12-08 Relisted — HCAR
- 2021-07-28 Price Changed $137,900 Stellar MLS as Distributed by MLS Grid
- 2021-07-28 Listing Removed — HCAR
- 2021-07-09 Relisted — HCAR
- 2021-07-09 Relisted — Stellar MLS as Distributed by MLS Grid
- 2021-07-03 Pending — HCAR
- 2021-07-03 Pending — Stellar MLS as Distributed by MLS Grid
- 2021-05-19 Listed $127,900 St. Augustine and St. Johns County Board of REALTORS®
- 2021-05-19 Listed $127,900 Stellar MLS as Distributed by MLS Grid
- 2021-05-19 Listed $127,900 HCAR
- 2019-11-11 Listing Removed — HCAR
- 2008-04-04 Listed $210,000 HCAR
- 2006-01-19 Sold (Public Records) $110,000 Public Records
- 2006-01-13 Sold (MLS) $110,000 HCAR
- 2005-12-14 Listed $118,900 HCAR
- 2005-05-11 Sold (Public Records) $79,000 Public Records
- 2003-06-16 Sold (Public Records) $69,700 Public Records
- 2003-03-29 Listed $72,900 HCAR
- 1999-01-27 Sold (Public Records) $15,400 Public Records
- 1995-10-11 Sold (Public Records) $15,400 Public Records
Property tax history
+4.1%/yrLatest (2025): $1,604 · -5.2% YoY. Source: county tax records.
Cash-flow waterfall
monthlySold comps — $/sqft
last 12 mo · ≤1 miLoading sold comps…