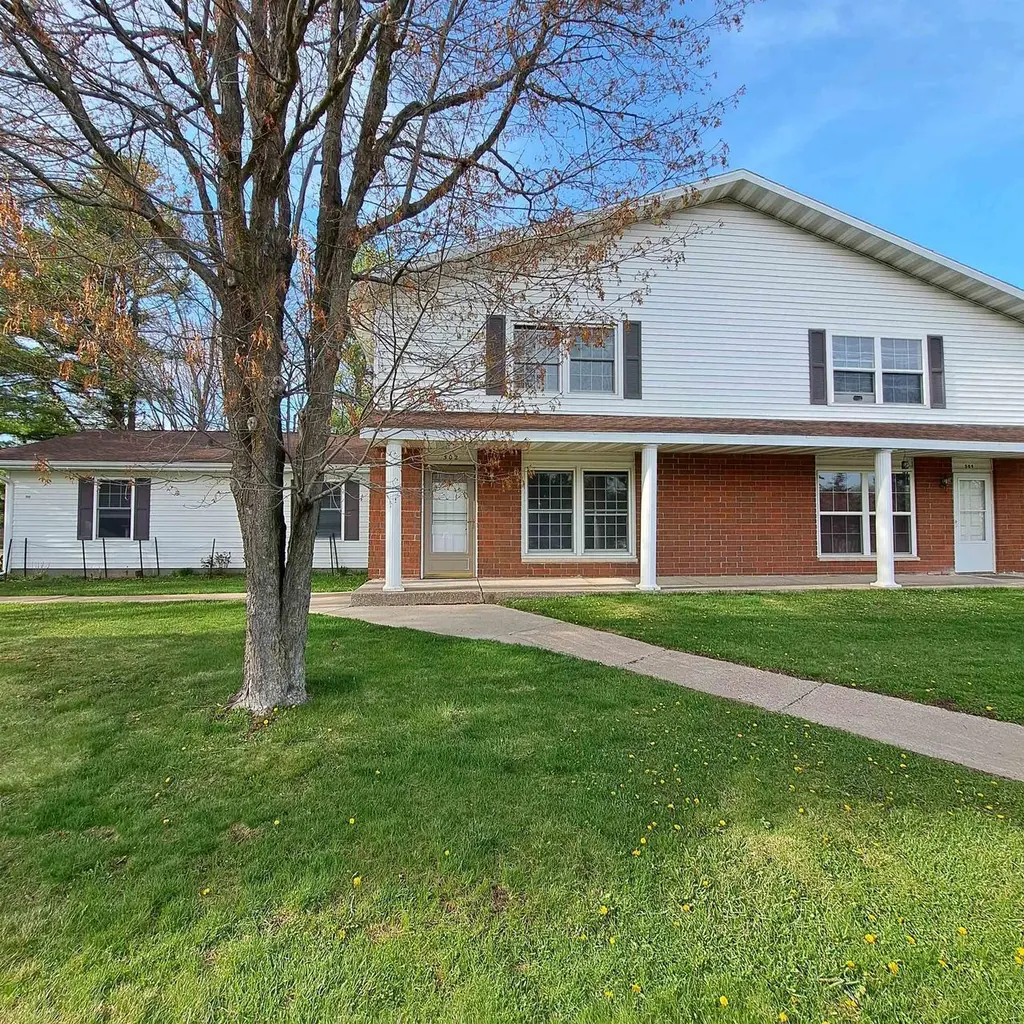
502B Johns Dr · Stevens Point, WI
Flood risk No data
- FEMA flood zone
- —
- Chance of flooding over 30 yrs
- —
- Est. flood insurance / yr
- —
Fire risk No data
- Est. fire insurance / yr
- —
Heat risk No data
- Hot days now (above threshold)
- —
- Hot days in 30 yrs
- —
Wind risk No data
- Chance of severe wind over 30 yrs
- —
Air-quality risk No data
- Unhealthy air days now
- —
- Unhealthy air days in 30 yrs
- —
Risk factors via First Street. Map © Google.
Why this score? — see what drove the C- grade
The composite is a weighted blend of 9 inputs, each scored 0–100. Each bar is that input's sub-score; the figure is the points it added to the 100-point composite (weight × sub-score).
- Cash flow +18.6/30.0
- ARV discount +7.5/15.0
- DSCR +5.9/10.0
- 1% rule +4.9/10.0
- Livability +4.2/5.0
- Rent growth +3.4/5.0
- Schools +3.2/10.0
- Condition / age +2.5/5.0
- Appreciation +0.0/10.0
$159,900
🖨 Deal sheet 📄 Offer letter ✓ Due diligence
Listing remarks MLS
Perfect place to start your home owner journey! Build equity for your future. This unit is in great condition and all ready for you to move in. The condo fees are $205/month and they take care of the lawn and snow removal. This unit includes a shared garage. 1 pet is permitted per the rules of the condominium bylaws.
Key facts
- Garage
- Built 1973
- Listed 33 days
Neighborhood map
What this means for you Summary
Snapshot
- This is a 2-bed/1.5-bath condo listed at $160k.
Deal economics
- At list price, monthly cash flow is $155 ($2k/yr) — positive.
- The deal already cash-flows at list — no discount required.
- To meet the 1% rule (rent ≥ 1% of price), the offer needs to be $158k (1.1% below list).
- Recommended offer: $155k (3.0% below list) — sets the bar for market timing.
- Cap rate 7.5% vs local median 2.6% in Stevens Point — top-decile yield for the area; either an underpriced asset or a hidden risk that comps aren't pricing in. Stress-test before assuming the spread holds.
Location & tenants
- Location reads 85/100 on livability (#27 in WI, #490 nationally) — a professional / high-income tenant draw. Strengths: crime A+, commute A+, cost of living A+; Watch: employment D+.
- Stevens Point Area Public School District (town): math 36% / reading 38% proficiency, ranked #203 of 342 in WI (top 59%) — families likely to look elsewhere, expect single-tenant / working-renter base with shorter leases.
- Market conditions: Rents rising (+3.6%/yr); 70 active listings in the ZIP; 2 comparable units currently listed for rent nearby; 255 units permitted in Portage County in 2024 (115 in 5+ unit buildings).
- This rent runs 32% of the median local income ($60k/yr) — at the standard rent-burdened threshold; future hikes will face affordability resistance.
Forward outlook
- Local home prices are declining (-3.0%/yr); year-one equity from $1k of loan paydown is wiped out by about $5k of value loss. Plan a longer hold.
Negotiation context
- It's been on market 34 days — a 3% lower offer ($155k) is reasonable based on typical stale-listing flexibility.
- Current owner paid $60k; list at $160k implies a 166% gain — meaningful room to come down on a strong offer.
Questions for the listing agent
- It's been on market 34 days. Have you received any prior offers? Is the seller open to a 3% concession, seller financing, or rate buy-down credit?
- Built in 1973 — when were the roof, HVAC, electrical panel, plumbing, and water heater last replaced?
- Any open or pending special assessments — roof, HVAC, plumbing, elevator, façade? What's the per-unit balance and payoff schedule, and is the seller paying it off at close or rolling it to the buyer?
- Is there a deadline driving the sale (1031 exchange, divorce, estate, relocation)? That informs how much negotiation room exists.
- What's the average days-on-market for RENTAL listings here right now (not sales)? A rising rental-DOM trend means longer vacancies and softer asking-rent achievability than the comps imply.
- What's the recent tenant-quality profile in this submarket — average credit score on applications, eviction rate, late-payment / NSF rate, and stable-employment percentage? A property-management company in the area should have these aggregated.
- How much new apartment / multifamily construction is in the pipeline within 1–3 miles? Heavy new supply (>2% of stock underway) typically softens rents 12–24 months out; light construction supports rent growth.
Investment metrics
- 1% rule
- 0.99% ✗
- Cap rate
- 7.46%
- Cash-on-cash
- 4.16%
- DSCR
- 1.19
- GRM
- 8.4
CMA / ARV
No comps found within radius.
Projected returns pro-forma
-3.0% appreciation · 3.64% rent growth · sell at horizon
- IRR
- -9.1%
- Equity multiple
- 0.67×
- Total profit
- $-14,978
- Equity at exit
- $23,842
- IRR
- 1.2%
- Equity multiple
- 1.09×
- Total profit
- $4,022
- Equity at exit
- $13,825
Cash invested: $44,772 (down + closing). Projections, not guarantees.
Landlord ↔ Tenant lean methodology
- Overall (STATE)
- 73 Landlord-Friendly
- State Wisconsin
- 73 Landlord-Friendly · R+2
- County
- — inherits STATE
- City
- — inherits STATE
ZIP-level market 54481
- Rents YoY
- 3.6%
- Active inventory
- 70
- Price-to-rent
- 8.4×
Monthly cashflow live
- Estimated rent
- $1,581 medium interval (Pro) →
- Mortgage (P&I)
- −$839
- Tax from tax record
- −$188 /mo · $2,261/yr
- Insurance
- −$67
- HOA
- −$0
- Vacancy / Maint / Mgmt
- −$332
- Net cashflow
- $155
Break-even live
UW: 25.0% down · 7.5% · 30yr · 1.5% tax · 5.0% vac · 8.0% maint · 8.0% mgmt
Financing live
Cash to close
- Down payment
- $39,975
- Closing costs
- $4,797
- Reserves months
- —
- Total cash needed
- —
Loan-product check · same deal, 3 products live
Conventional
25% down · 7.5% · 30yr
- Down + closing
- —
- Monthly P&I
- —
- Monthly cashflow
- —
- DSCR
- —
- Eligible?
- —
Personal DTI + credit; lowest rate.
DSCR
20% down · 8.5% · 30yr
- Down + closing
- —
- Monthly P&I
- —
- Monthly cashflow
- —
- DSCR
- —
- Eligible?
- —
No personal income docs; deal must DSCR.
Hard money
10% down · 12.0% · 12mo
- Down + closing
- —
- Monthly P&I
- —
- Monthly cashflow
- —
- DSCR
- —
- Eligible?
- —
Short-term bridge; refi at stabilization.
Rent comps 2 comps
| Address | Beds | Baths | Sqft | Rent | $/sqft | DOM | Units | Dist |
|---|---|---|---|---|---|---|---|---|
| 209 Division St Stevens Point, WI | 2.0 | 1.0–2.0 | 880 | $1,799 | $2.04 | 43d | 3 | 0.91mi |
| 1020 Centerpoint Dr Stevens Point, WI | 2.0 | 1.0–2.0 | 666 | $1,975 | $2.97 | 43d | 59 | 1.00mi |
HOA detail condo
- Monthly dues
- $0 · $0/yr
- Likely covers
- snow removal
- Assessments
- None detected in remarks — confirm with the listing agent.
Listing history 7 events
-
2026-06-02days on market $159,900 Active 34 DOM
-
2026-06-01days on market $159,900 Active 33 DOM
-
2026-05-31days on market $159,900 Active 32 DOM
-
2026-05-30days on market $159,900 Active 31 DOM
-
2026-04-25$159,900 Active 318-char remark
Show marketing remark (318 chars)
Perfect place to start your home owner journey! Build equity for your future. This unit is in great condition and all ready for you to move in. The condo fees are $205/month and they take care of the lawn and snow removal. This unit includes a shared garage. 1 pet is permitted per the rules of the condominium bylaws.
-
2018-07-03soldstatus $60,000
-
2008-10-24soldstatus $61,000
ⓘ Source: listings_history table (triggers on properties + properties_extension) + one-shot
backfill from property_details.listing_events for pre-trigger history.
Tax reassessment forecast WI · Partial reset (capped growth)
- Current annual tax
- $2,261 · $188/mo
- Projected year-2 tax
- $2,610 · $217/mo
- Expected delta
- +$348/yr (+$29/mo · 15.4%)
ⓘ Screening estimate from a state-policy table — verify with the county assessor before closing.
Nearby sold comps map
Loading sold comps map…
Walkable amenities ~0.75 mi
Loading nearby amenities…
Taxation est. · year 1
- Rental income
- $18,971
- − Mortgage interest
- −$8,957
- − Property taxes
- −$2,261
- − Insurance
- −$800
- − Repairs & maintenance
- −$1,518
- − Management
- −$1,518
- − Depreciation
- −$4,652
- Taxable loss
- −$734
- Est. tax savings @ 24.0%
- +$176
- After-tax cash flow
- $2,040/yr
For passive investors: Depreciation is non-cash, so a rental often shows a tax loss while cash-flowing — sheltering income. Rental losses are passive: they offset passive income freely, and up to $25,000/yr can offset ordinary (W-2) income if you actively participate and your MAGI is under $100k (phasing out to $0 by $150k); unused losses carry forward. On sale, claimed depreciation is recaptured at up to 25%, and gains may owe capital-gains tax (a 1031 exchange can defer both). Figures are a year-1 estimate at your 24.0% rate — not tax advice; consult a CPA.
Schools (NCES district)
- District
- Stevens Point Area Public School District
- NCES district ID
- 5514490
- Math proficiency
- 36% ▼ -8.00%
- Reading proficiency
- 38% ▼ -6.00%
- Median HH income
- $50,284
- Composite
- 32.03/100
- National rank
- #5825
- State rank
- #203 of 342 in WI
Livability — Stevens Point
- Score
- 85/100
- State rank
- #27
- US rank
- #490
Category grades
Schools grade is shown separately in the Schools card above.
Census & demographics
- Census place
- Stevens Point, WI
- County
- Portage County · 43,112 people
- City population
- 28,242
- Metro
- Stevens Point, WI
- Population (ZIP)
- 28,242
- Household income
- $59,545
- Rent vs Own
- Severe rent burden
- 945.0
Population outlook (Portage County) Hauer SSP2
- Today (2025)
- 71,902 people
- By 2030
- 72,387 · +0.7%
- By 2040
- 72,081 · +0.2%
- By 2050
- 70,729 · -1.6%
- By 2075
- 68,457 · -4.8%
- By 2100
- 65,574 · -8.8%
Race, ethnicity, and origin ACS 2023
- Neighborhood character
- Predominantly White (88%)
- Race & ethnicity
- White 88% Two or more races 5% Hispanic / Latino 4% Asian 4% Black 2%
- Common ancestry
- Romanian 24% Portuguese 6% Lithuanian 3%
- Foreign-born
- 3% · Canada, China
- Languages at home
- 96% English-only · Other Asian/Pacific 2% Spanish 1%
Political lean MEDSL · Portage
- 2024 margin
- Toss-up / Even · D 49.8% · R 48.6% · Other 1.6%
- 2008→2024 swing
- -26.7pp toward R · 2008: 27.9pp · 2024: 1.2pp
- All cycles
- 2024: D+1.2 2020: D+2.8 2016: D+3.2 2012: D+13.9 2008: D+27.9
Not yet ingested
- Civics
- —
Market trends
- HPI YoY
- ▼ -181.29%
- Current HPI
- 237.4151
- Rent YoY
- ▲ 3.64%
- Metro
- Stevens Point, WI
- State GDP YoY
- ▲ 2.10%
- F500 in state
- 20
Industry mix (Fortune 500 HQ in WI)
| Industry | F500 HQs | Revenue |
|---|---|---|
| Industrial Machinery | 4 | $23B |
|
||
| Industrial Technology | 2 | $36B |
|
||
| Insurance | 1 | $36B |
|
||
| Professional Services | 1 | $19B |
|
||
| Utilities | 1 | $9B |
|
||
| Consumer Goods | 1 | $3B |
|
||
Price history
+162.1% since first listed3 events — show timeline
- 2026-04-25 Listed $159,900 CWMLS
- 2018-07-03 Sold (Public Records) $60,000 Public Records
- 2008-10-24 Sold (Public Records) $61,000 Public Records
Property tax history
+6.3%/yrLatest (2025): $2,261 · +11.6% YoY. Source: county tax records.
Cash-flow waterfall
monthlySold comps — $/sqft
last 12 mo · ≤1 miLoading sold comps…