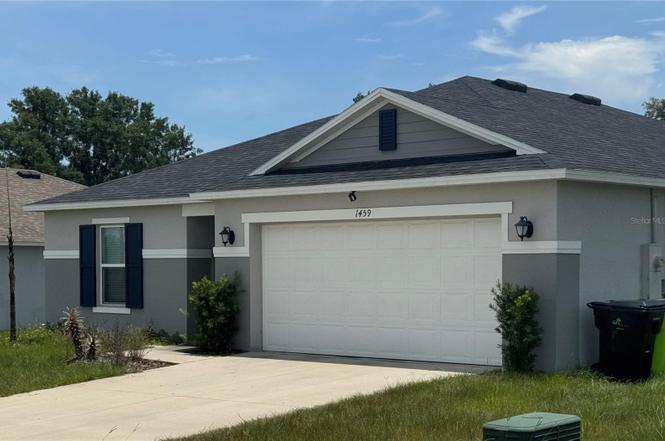
1459 Geranium Dr · Mascotte, FL
Flood risk 1/10 · Minimal
- FEMA flood zone
- X (unshaded)
- Chance of flooding over 30 yrs
- 0.0%
- Est. flood insurance / yr
- $507 – $1,088
Fire risk 6/10 · Moderate
- Est. fire insurance / yr
- $947 – $1,759
Heat risk 8/10 · Major
- Hot days now (above 108°F)
- 7 days/yr
- Hot days in 30 yrs
- 23 days/yr
Wind risk 9/10 · Severe
- Chance of severe wind over 30 yrs
- 99.0%
Air-quality risk 1/10 · Minimal
- Unhealthy air days now
- 0 days/yr
- Unhealthy air days in 30 yrs
- 0 days/yr
Risk factors via First Street. Map © Google.
Why this score? — see what drove the D- grade
The composite is a weighted blend of 9 inputs, each scored 0–100. Each bar is that input's sub-score; the figure is the points it added to the 100-point composite (weight × sub-score).
- Appreciation +10.0/10.0
- ARV discount +9.1/15.0
- Cash flow +5.9/30.0
- Schools +4.2/10.0
- Livability +3.6/5.0
- Rent growth +2.5/5.0
- Condition / age +2.5/5.0
- 1% rule +1.7/10.0
- DSCR +0.3/10.0
$359,990
🖨 Deal sheet (PDF) 📄 Offer letter ✓ Due diligence
Listing remarks
Welcome to your dream home in the highly sought-after neighborhood of Gardens II/LK Jackson! This stunning single-family home boasts 4 spacious bedrooms, 2 luxurious bathrooms, and a 2-car garage. The open floor plan is perfect for entertaining guests or simply enjoying quality time with your family. The gourmet kitchen features stainless steel appliances, granite countertops, and a large island for meal prep and casual dining. The office space is ideal for those who work from home or need a quiet place to focus. The master suite is a true retreat with a walk-in closet and a spa-like ensuite bathroom with a soaking tub and separate shower. Outside, the backyard is a private oasis with a
Key facts
- Office space
- Walk-in closet
- Gourmet kitchen
Tags
Property features AI
Finance
- Other: Lease restrictions apply
- HOA & community: HOA managed by EMPIRE MANAGEMENT; Association fees required; Monthly HOA approximately $50 (quarterly fee noted $150); Community playground; Cats and dogs allowed
Exterior
- Parking: Attached garage with 2 spaces
- Utilities: Public water; Septic tank sewer; Electricity connected
- Home design: Single family residence; One story; Faces northeast
- Construction: Block and stucco construction; Shingle roof; Slab foundation; Built on lot of about 0.2 acres
- Exterior features: Covered patio; Patio; Sidewalk
Interior
- Kitchen: Dishwasher; Range; Range hood; Refrigerator
- Bedrooms: 4 bedrooms
- Flooring: Carpet; Laminate
- Bathrooms: 2 full bathrooms
- Heating & cooling: Central heating; Central air conditioning
- Interior features: High ceilings; Open floorplan; Kitchen and family room combo; Walk-in closet(s)
- Laundry & utility: Laundry room inside
Neighborhood map
What this means for you Summary
Snapshot
- This is a 4-bed/2.0-bath single-family listed at $360k.
Deal economics
- At list price, monthly cash flow is $-704 ($-8k/yr) — negative.
- To cash-flow at today's rent, offer at most $236k (34.6% below list).
- To meet the 1% rule (rent ≥ 1% of price), the offer needs to be $241k (33.1% below list).
- Recommended offer: $236k (34.6% below list) — sets the bar for cash-flow.
Location & tenants
- Location reads 71/100 on livability (#405 in FL) — a middle-class / working-renter tenant base. Strengths: cost of living A+, housing A+, health & safety A+; Watch: amenities F, commute F.
- Lake (suburban): math 49% / reading 50% proficiency, ranked #37 of 73 in FL (top 51%) — families likely to look elsewhere, expect single-tenant / working-renter base with shorter leases.
- Zoned schools: Mascotte Elementary School (math 50% / reading 47%, grade D, #1,152 of 2,144 statewide, top 55%, 855 students, 62% FRL, charter); Gray Middle School (math 45% / reading 45%, grade D, #310 of 571 statewide, top 56%, 1,148 students, 47% FRL); South Lake High School (math 36% / reading 39%, grade F, #336 of 667 statewide, top 51%, 2,169 students, 40% FRL) — zoned schools at 50% FRL track the district average.
- Market conditions: 98 active listings in the ZIP; 11 comparable units currently listed for rent nearby; rentals at typical pace (median 20d on market — plan ~3-4 weeks tenant-placement turnaround); solid renter incomes; 4,799 units permitted in Lake County in 2024 (814 in 5+ unit buildings).
- This rent runs 34% of the median local income ($84k/yr) — at the standard rent-burdened threshold; future hikes will face affordability resistance.
Forward outlook
- In year one you build about $38k of equity ($2k loan paydown + $36k appreciation (10.0% local appreciation)).
- Lake County population projected at +37% by 2050 — long-run rental-demand tailwind backs the buy-and-hold thesis.
- By year 2, paydown + projected appreciation supports a ~$62k cash-out refi (75% LTV) — recoverable capital for the next deal without selling this one.
Negotiation context
- Only 11 days on market — expect competitive offers; lowballing is unlikely to land.
Risks & watch-outs
- Climate carrying-cost: severe wind risk, 99% chance of damaging wind over 30y; major wildfire risk; extreme-heat days projected 7→23/yr by 2055 (HVAC capex compounding) — expect insurance premiums to compound above CPI over the hold.
Questions for the listing agent
- What do current leases actually rent for vs. the listed asking? Can we see a recent rent roll and the last 12 months of T-12 income?
- What does the HOA fee cover, when was the last increase, and are there any pending special assessments or reserve-fund shortfalls?
- Is there a deadline driving the sale (1031 exchange, divorce, estate, relocation)? That informs how much negotiation room exists.
- Schools are D-rated, which usually means shorter tenancies and higher turnover. Who's the typical renter profile here, and what's been the actual vacancy rate?
- The area grade is low — what's the realistic commute time and amenity access for the typical tenant pool here? Any planned neighborhood developments (good or bad) we should know about?
- What's the average days-on-market for RENTAL listings here right now (not sales)? A rising rental-DOM trend means longer vacancies and softer asking-rent achievability than the comps imply.
- What's the recent tenant-quality profile in this submarket — average credit score on applications, eviction rate, late-payment / NSF rate, and stable-employment percentage? A property-management company in the area should have these aggregated.
- How much new for-sale + rental construction is in the pipeline within 1–3 miles? Heavy new supply typically softens prices + rents 12–24 months out; constrained supply supports both.
Investment metrics
- 1% rule
- 0.67% ✗
- Cap rate
- 3.95%
- Cash-on-cash
- -8.38%
- DSCR
- 0.63
- GRM
- 12.4
CMA / ARV
- ARV (on-the-fly)
- $373,120
- Comps found
- 8
Show comp detail 8 sales within ~0.75 mi
| Address | Dist | Beds/Ba | Sqft | Sold | Price | $/sf | Match |
|---|---|---|---|---|---|---|---|
| 1948 Piedmont Ct | 0.27mi | 3/2.0 (-1) | 1,673 (-1%) | 6mo | $305,000 | $182 | 75 |
| 3324 Pink Oleander Ave | 0.06mi | 3/2.0 (-1) | 1,541 (-9%) | 10mo | $338,350 | $220 | 69 |
| 1725 Garden View St | 0.66mi | 4/2.0 | 1,701 (+0%) | 7mo | $262,000 | $154 | 63 |
| 1651 Geranium Dr | 0.24mi | 3/2.0 (-1) | 1,541 (-9%) | 22mo | $348,000 | $226 | 50 |
| 290 Tuscanooga Rd | 0.49mi | 3/2.0 (-1) | 1,596 (-6%) | 16mo | $400,000 | $251 | 49 |
| 1638 Geranium Dr | 0.24mi | 3/2.0 (-1) | 1,541 (-9%) | 24mo | $343,980 | $223 | 48 |
| 1130 Union Ave | 0.51mi | 4/2.0 | 1,842 (+9%) | 18mo | $343,000 | $186 | 46 |
| 1665 Hideaway Flat St | 0.42mi | 5/3.0 (+1) | 1,944 (+15%) | 15mo | $335,000 | $172 | 35 |
Match score weights: distance 35% · size 25% · config 20% · recency 20%. Top-matched comps best support the ARV.
Projected returns pro-forma
10.0% appreciation · 3.0% rent growth · sell at horizon
- IRR
- 18.4%
- Equity multiple
- 2.50×
- Total profit
- $151,321
- Equity at exit
- $324,308
- IRR
- 17.1%
- Equity multiple
- 5.77×
- Total profit
- $481,104
- Equity at exit
- $699,381
Cash invested: $100,797 (down + closing). Projections, not guarantees.
Landlord ↔ Tenant lean methodology
- Overall (STATE)
- 87 Strongly Landlord-Friendly
- State Florida
- 87 Strongly Landlord-Friendly · R+3
- County
- — inherits STATE
- City
- — inherits STATE
ZIP-level market 34753
- Home prices YoY
- 7.2%
- Active inventory
- 98
- Price-to-rent
- 12.4×
Monthly cashflow live
- Estimated rent
- $2,410 high interval (Pro) →
- Mortgage (P&I)
- −$1,888
- Tax from tax record
- −$520 /mo · $6,243/yr
- Insurance
- −$150
- HOA
- −$50
- Vacancy / Maint / Mgmt
- −$506
- Net cashflow
- $-704
Break-even live
Sensitivity live
| Price | -10% $-500 | -5% $-602 | +0% $-704 | +5% $-806 | +10% $-908 |
|---|---|---|---|---|---|
| Rent | -10% $-895 | -5% $-799 | +0% $-704 | +5% $-609 | +10% $-514 |
| Rate | -1.0pp $-523 | -0.5pp $-613 | base $-704 | +0.5pp $-797 | +1.0pp $-892 |
UW: 25.0% down · 7.5% · 30yr · 1.5% tax · 5.0% vac · 8.0% maint · 8.0% mgmt
Financing live
Cash to close
- Down payment
- $89,998
- Closing costs
- $10,800
- Reserves months
- —
- Total cash needed
- —
Loan-product check · same deal, 3 products live
Conventional
25% down · 7.5% · 30yr
- Down + closing
- —
- Monthly P&I
- —
- Monthly cashflow
- —
- DSCR
- —
- Eligible?
- —
Personal DTI + credit; lowest rate.
DSCR
20% down · 8.5% · 30yr
- Down + closing
- —
- Monthly P&I
- —
- Monthly cashflow
- —
- DSCR
- —
- Eligible?
- —
No personal income docs; deal must DSCR.
Hard money
10% down · 12.0% · 12mo
- Down + closing
- —
- Monthly P&I
- —
- Monthly cashflow
- —
- DSCR
- —
- Eligible?
- —
Short-term bridge; refi at stabilization.
Rent comps 11 comps
| Address | Beds | Baths | Sqft | Rent | $/sqft | DOM | Units | Dist |
|---|---|---|---|---|---|---|---|---|
| 232 Boca Ciega Rd Mascotte, FL | 4.0 | 2.0 | 1280 | $2,095 | $1.64 | 14d | 1 | 0.29mi |
| 1665 Luft Ln Mascotte, FL | 3.0 | 2.0 | 1680 | $2,030 | $1.21 | 25d | 1 | 0.32mi |
| 1341 Brenway Dr Mascotte, FL | 4.0 | 2.0 | 1851 | $2,280 | $1.23 | 0d | 1 | 0.47mi |
| 1126 Union Ave Mascotte, FL | 5.0 | 3.0 | 1984 | $2,265 | $1.14 | 25d | 1 | 0.52mi |
| 1676 Gopher Tree St Mascotte, FL | 5.0 | 3.0 | 1984 | $2,285 | $1.15 | 6d | 1 | 0.55mi |
| 1864 Piedmont Ct Mascotte, FL | 5.0 | 3.0 | 1984 | $2,290 | $1.15 | 25d | 1 | 0.56mi |
| 2425 Begonia St Mascotte, FL | 4.0 | 2.0 | 1983 | $2,350 | $1.19 | 25d | 1 | 0.63mi |
| 614 Huey St Mascotte, FL | 3.0 | 2.0 | 1572 | $1,936 | $1.23 | 0d | 1 | 0.70mi |
| 1600 Mayaro Ct Mascotte, FL | 3.0 | 2.0 | 1503 | $2,000 | $1.33 | 19d | 1 | 0.71mi |
| 4025 E Cardinal Pines Dr Mascotte, FL | 3.0 | 2.0 | 1260 | $2,100 | $1.67 | 6d | 1 | 0.93mi |
| 405 Eventide Ave Mascotte, FL | 4.0 | 3.0 | 2000 | $2,250 | $1.12 | 22d | 1 | 1.12mi |
HOA detail
- Monthly dues
- $50 · $600/yr
Listing history 9 events
-
2026-06-21days on market $359,990 Active 11 DOM
-
2026-06-18days on market $359,990 Active 8 DOM
-
2026-06-17days on market $359,990 Active 7 DOM
-
2026-06-16days on market $359,990 Active 6 DOM
-
2026-06-15days on market $359,990 Active 5 DOM
-
2026-06-13pricedays on market $359,990 Active 3 DOM
-
2026-05-31days on market $349,000 Active 199 DOM
-
2025-12-09price $349,000
-
2025-11-13$360,000 Active
ⓘ Source: listings_history table (triggers on properties + properties_extension) + one-shot
backfill from property_details.listing_events for pre-trigger history.
Tax reassessment forecast FL · Resets to sale price
- Current annual tax
- $6,243 · $520/mo
- Projected year-2 tax
- $6,243 · $520/mo
- Expected delta
- $0/yr ($0/mo · 0.0%)
ⓘ Screening estimate from a state-policy table — verify with the county assessor before closing.
Climate risk First Street
- Flood 1/10 Low FEMA zone X (unshaded) · 0% chance over 30 yrs
- Wildfire 6/10 Major
- Heat 8/10 Severe 7 d/yr ≥108°F today · 23 d/yr by 30 yrs out
- Wind 9/10 Extreme 99% chance of damaging wind over 30 yrs
- Air quality 1/10 Low 0 unhealthy d/yr today · 0 by 30 yrs out
Nearby sold comps map
Loading sold comps map…
Walkable amenities ~0.75 mi
Loading nearby amenities…
Taxation est. · year 1
- Rental income
- $28,920
- − Mortgage interest
- −$20,165
- − Property taxes
- −$6,243
- − Insurance
- −$1,800
- − Repairs & maintenance
- −$2,314
- − Management
- −$2,314
- − HOA
- −$600
- − Depreciation
- −$10,472
- Taxable loss
- −$14,988
- Est. tax savings @ 24.0%
- +$3,597
- After-tax cash flow
- $-4,853/yr
For passive investors: Depreciation is non-cash, so a rental often shows a tax loss while cash-flowing — sheltering income. Rental losses are passive: they offset passive income freely, and up to $25,000/yr can offset ordinary (W-2) income if you actively participate and your MAGI is under $100k (phasing out to $0 by $150k); unused losses carry forward. On sale, claimed depreciation is recaptured at up to 25%, and gains may owe capital-gains tax (a 1031 exchange can defer both). Figures are a year-1 estimate at your 24.0% rate — not tax advice; consult a CPA.
Schools (NCES district)
- District
- Lake
- NCES district ID
- 1201050
- Math proficiency
- 49% ▼ -7.00%
- Reading proficiency
- 50% ▼ -4.00%
- Median HH income
- $46,632
- Composite
- 42.05/100
- National rank
- #3327
- State rank
- #37 of 73 in FL
Livability — Mascotte
- Score
- 71/100
- State rank
- #405
- US rank
- #7156
Category grades
Schools grade is shown separately in the Schools card above.
Census & demographics
- Census place
- Mascotte, FL
- County
- Lake County · 364,602 people
- City population
- 33,565
- Metro
- Orlando-Kissimmee-Sanford, FL
- Population (ZIP)
- 7,985
- Household income
- $83,868
- Rent vs Own
- Severe rent burden
- 16.0
Population outlook (Lake County) Hauer SSP2
- Today (2025)
- 386,640 people
- By 2030
- 417,107 · +7.9%
- By 2040
- 476,676 · +23.3%
- By 2050
- 531,296 · +37.4%
- By 2075
- 648,303 · +67.7%
- By 2100
- 698,530 · +80.7%
Race, ethnicity, and origin ACS 2023
- Neighborhood character
- Diverse neighborhood (Simpson 0.69)
- Race & ethnicity
- White 38% Hispanic / Latino 35% Two or more races 25% Black 20% Asian 3%
- Hispanic origin (detail)
- Mexican 11% Puerto Rican 12% Dominican 2%
- Common ancestry
- Slovak 1% Serbian 1% Romanian 1%
- Foreign-born
- 10% · Canada, Jamaica
- Languages at home
- 67% English-only · Spanish 32%
Political lean MEDSL · Lake
- 2024 margin
- Strong R (+24.7) · D 37.3% · R 62.0%
- 2008→2024 swing
- -11.2pp toward R · 2008: -13.5pp · 2024: -24.7pp
- All cycles
- 2024: R+24.7 2020: R+20.0 2016: R+23.1 2012: R+17.1 2008: R+13.5
Not yet ingested
- Civics
- —
Market trends
- HPI YoY
- ▲ 19.01%
- Current HPI
- 281.96
- Rent YoY
- —
- Metro
- Orlando-Kissimmee-Sanford, FL
- State GDP YoY
- ▲ 3.28%
- F500 in state
- 36
Industry mix (Fortune 500 HQ in FL)
| Industry | F500 HQs | Revenue |
|---|---|---|
| Industrial Technology | 2 | $29B |
|
||
| Insurance | 2 | $17B |
|
||
| Retail | 1 | $60B |
|
||
| Technology Distribution | 1 | $58B |
|
||
| Homebuilding | 1 | $35B |
|
||
| Technology Manufacturing | 1 | $35B |
|
||
Price history
-3.1% since first listed2 events — show timeline
- 2025-12-09 Price Changed $349,000 Stellar MLS as Distributed by MLS Grid
- 2025-11-13 Listed $360,000 Stellar MLS as Distributed by MLS Grid
Property tax history
+1.6%/yrLatest (2025): $6,243 · +1.6% YoY. Source: county tax records.
Cash-flow waterfall
monthlySold comps — $/sqft
last 12 mo · ≤1 miLoading sold comps…