 🏗️ New Construction
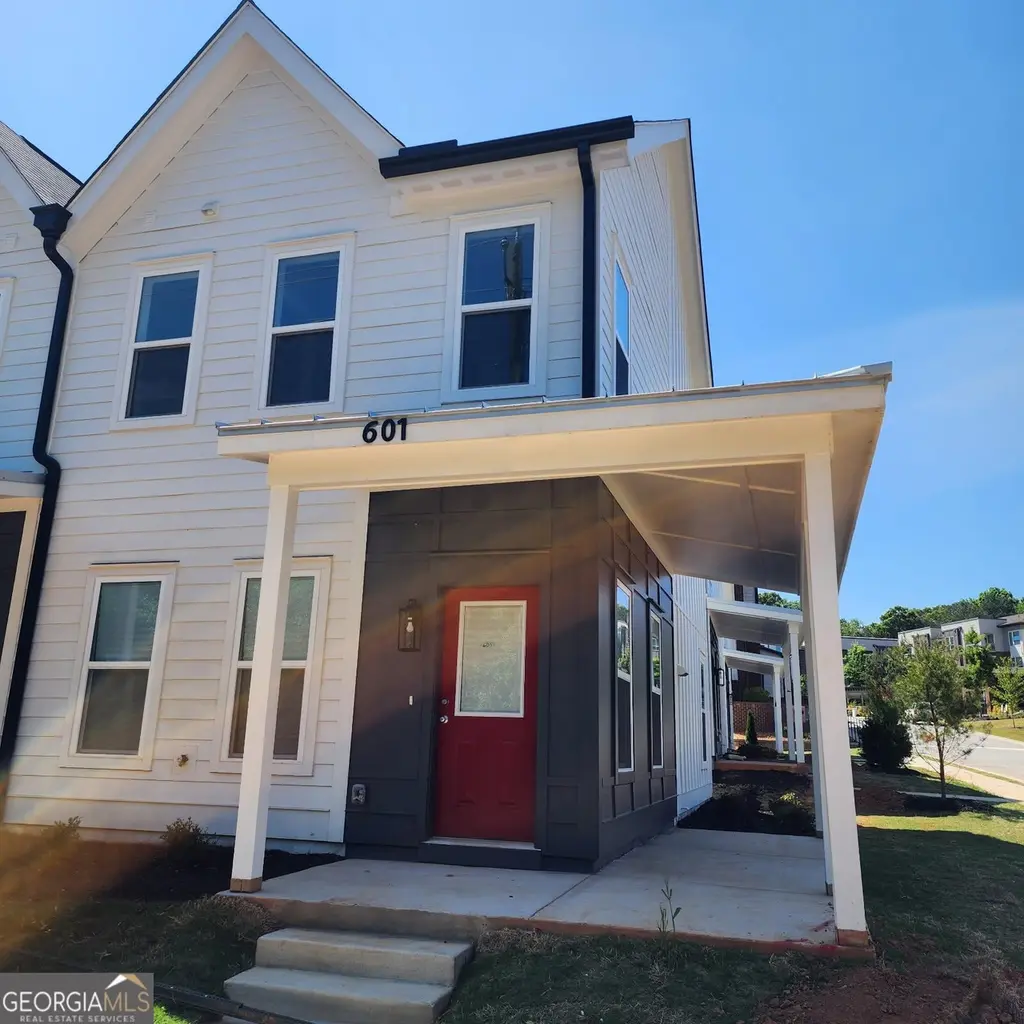
721 Fayetteville Rd SE #601 · Atlanta, GA
Flood risk No data
- FEMA flood zone
- —
- Chance of flooding over 30 yrs
- —
- Est. flood insurance / yr
- —
Fire risk No data
- Est. fire insurance / yr
- —
Heat risk No data
- Hot days now (above threshold)
- —
- Hot days in 30 yrs
- —
Wind risk No data
- Chance of severe wind over 30 yrs
- —
Air-quality risk No data
- Unhealthy air days now
- —
- Unhealthy air days in 30 yrs
- —
Risk factors via First Street. Map © Google.
Why this score? — see what drove the F grade
The composite is a weighted blend of 9 inputs, each scored 0–100. Each bar is that input's sub-score; the figure is the points it added to the 100-point composite (weight × sub-score).
- ARV discount +7.5/15.0
- Livability +4.2/5.0
- Cash flow +3.5/30.0
- Rent growth +3.1/5.0
- Schools +2.7/10.0
- Condition / age +2.5/5.0
- 1% rule +0.7/10.0
- DSCR +0.0/10.0
- Appreciation +0.0/10.0
$270,000
🖨 Deal sheet 📄 Offer letter ✓ Due diligence
Listing remarks
Ask about incentives and up to $45,000 in down payment assistance for qualified buyers, making homeownership feel more within reach. Introducing a ground breaking opportunity in one of Atlanta's most vibrant communities, own new construction in East Atlanta for under $270K at The Trust at East Lake, where luxury living meets affordability. This beautifully designed townhome blends modern style, quality craftsmanship, and everyday comfort in a way that feels both elevated and attainable. Enjoy a thoughtfully designed layout with inviting finishes and a full kitchen appliance package included, giving you everything you need from day one. Located in the heart of the East Lake community, this i
Key facts
- 0.66 acre lot
- Garage
- Built 2025
Property features AI
Finance
- Other: Land lease; Park nearby; Near public transport; Near shopping
- HOA & community: Association present; Association fee $2700; Association covers insurance, structure maintenance, grounds maintenance, management fees, tennis
Exterior
- Parking: Assigned parking; Detached parking
- Utilities: Public water; Public sewer; Electricity available; Sewer connected; Water available; High speed internet available; Cable available; Phone available; Underground utilities
- Home design: Single family residence (attached); New construction; Other structure type; Built in 2025; Entry on two levels
- Construction: Wood siding; Composition roof; Slab foundation
- Exterior features: Patio; Porch; City lot
Interior
- Kitchen: Dishwasher; Disposal; Microwave; Refrigerator; Stainless steel appliances; Electric water heater
- Bedrooms: 2 bedrooms
- Flooring: Vinyl
- Bathrooms: 1 full bathroom; 1 half bathroom (1.5 total bathrooms)
- Heating & cooling: Central heating (electric); Zoned heating; Central air conditioning (electric); Zoned cooling
- Interior features: High ceilings; Roommate plan; Tile bath; Two levels; No basement; 1 common wall (attached)
- Laundry & utility: Laundry in hall
Neighborhood map
What this means for you Summary
Snapshot
- This is a 2-bed/1.5-bath single-family listed at $270k.
Deal economics
- At list price, monthly cash flow is $-1k ($-13k/yr) — negative.
- To cash-flow at today's rent, offer at most $207k (23.4% below list).
- To meet the 1% rule (rent ≥ 1% of price), the offer needs to be $209k (22.5% below list).
- Recommended offer: $207k (23.4% below list) — sets the bar for cash-flow.
Location & tenants
- Location reads 83/100 on livability (#6 in GA, #919 nationally) — a professional / high-income tenant draw. Strengths: amenities A+, commute A+, housing A+; Watch: schools C-, cost of living C-.
- Atlanta Public Schools (urban): math 28% / reading 35% proficiency, ranked #80 of 174 in GA (top 46%) — families likely to look elsewhere, expect single-tenant / working-renter base with shorter leases; 71% free/reduced lunch — lower-income household profile, screen leases tightly.
- Market conditions: Rents rising (+2.3%/yr); 461 active listings in the ZIP; 40 comparable units currently listed for rent nearby; rentals at typical pace (median 24d on market — plan ~3-4 weeks tenant-placement turnaround); 45% of comp listings sitting > 30 days — soft ceiling on asking rent; solid renter incomes; 1,240 units permitted in DeKalb County in 2024 (385 in 5+ unit buildings).
Forward outlook
- Local home prices are declining (-3.0%/yr); year-one equity from $3k of loan paydown is wiped out by about $11k of value loss. Plan a longer hold.
- DeKalb County population projected at +28% by 2050 — long-run rental-demand tailwind backs the buy-and-hold thesis.
Negotiation context
- It's been on market 51 days — a 3% lower offer ($262k) is reasonable based on typical stale-listing flexibility.
Questions for the listing agent
- What do current leases actually rent for vs. the listed asking? Can we see a recent rent roll and the last 12 months of T-12 income?
- It's been on market 51 days. Have you received any prior offers? Is the seller open to a 23% concession, seller financing, or rate buy-down credit?
- What does the HOA fee cover, when was the last increase, and are there any pending special assessments or reserve-fund shortfalls?
- Is there a deadline driving the sale (1031 exchange, divorce, estate, relocation)? That informs how much negotiation room exists.
- The area grade is low — what's the realistic commute time and amenity access for the typical tenant pool here? Any planned neighborhood developments (good or bad) we should know about?
- What's the average days-on-market for RENTAL listings here right now (not sales)? A rising rental-DOM trend means longer vacancies and softer asking-rent achievability than the comps imply.
- What's the recent tenant-quality profile in this submarket — average credit score on applications, eviction rate, late-payment / NSF rate, and stable-employment percentage? A property-management company in the area should have these aggregated.
- How much new for-sale + rental construction is in the pipeline within 1–3 miles? Heavy new supply typically softens prices + rents 12–24 months out; constrained supply supports both.
Investment metrics
- 1% rule
- 0.57% ✗
- Cap rate
- 2.65%
- Cash-on-cash
- -13.00%
- DSCR
- 0.42
- GRM
- 14.7
CMA / ARV
- ARV (median comp)
- $368,525
- List price
- $270,000
- Delta
- -26.74%
- Verdict
- UNDERPRICED
- Comps
- 20 within 1.0 mi
Show comp detail 12 sales within ~0.75 mi
| Address | Dist | Beds/Ba | Sqft | Sold | Price | $/sf | Match |
|---|---|---|---|---|---|---|---|
| 2081 Glenwood Ave SE | 0.37mi | 2/1.0 | 1,066 (-3%) | 1mo | $320,000 | $300 | 75 |
| 1794 Pennington Pl | 0.19mi | 3/2.0 (+1) | 1,058 (-4%) | 5mo | $285,000 | $269 | 73 |
| 2051 Glenwood Ave SE | 0.41mi | 3/2.0 (+1) | 1,092 (-1%) | 0mo | $220,000 | $201 | 72 |
| 1907 Lomita Rd SE | 0.34mi | 3/2.0 (+1) | 1,095 (-0%) | 7mo | $349,900 | $320 | 71 |
| 1722 Donnalee Ave SE | 0.38mi | 3/1.0 (+1) | 1,066 (-3%) | 4mo | $185,000 | $174 | 67 |
| 2019 Swazey Dr | 0.37mi | 2/1.0 | 990 (-10%) | 0mo | $205,000 | $207 | 64 |
| 2026 Swazey Dr | 0.40mi | 3/1.0 (+1) | 1,107 (+1%) | 13mo | $340,000 | $307 | 63 |
| 2007 Glenwood Ave SE | 0.48mi | 2/2.0 | 1,065 (-3%) | 12mo | $330,000 | $310 | 60 |
| 2119 Glenwood Ave SE | 0.32mi | 3/2.0 (+1) | 1,204 (+10%) | 6mo | $410,000 | $341 | 57 |
| 1597 Terry Mill Rd SE | 0.50mi | 3/2.0 (+1) | 1,064 (-3%) | 10mo | $330,000 | $310 | 55 |
| 1667 Glencove Ave SE | 0.70mi | 2/1.0 | 992 (-10%) | 1mo | $210,000 | $212 | 48 |
| 1991 Mcafee Pl | 0.72mi | 2/2.0 | 944 (-14%) | 12mo | $282,500 | $299 | 30 |
Match score weights: distance 35% · size 25% · config 20% · recency 20%. Top-matched comps best support the ARV.
Projected returns pro-forma
-3.0% appreciation · 2.33% rent growth · sell at horizon
- IRR
- -41.3%
- Equity multiple
- -0.28×
- Total profit
- $-132,161
- Equity at exit
- $54,948
- IRR
- -73.5%
- Equity multiple
- -1.05×
- Total profit
- $-211,766
- Equity at exit
- $31,863
Cash invested: $103,187 (down + closing). Projections, not guarantees.
Landlord ↔ Tenant lean methodology
- Overall (STATE)
- 90 Strongly Landlord-Friendly
- State Georgia
- 90 Strongly Landlord-Friendly · R+3
- County
- — inherits STATE
- City
- — inherits STATE
ZIP-level market 30316
- Rents YoY
- 2.3%
- Active inventory
- 461
- Price-to-rent
- 10.7×
Monthly cashflow live
- Estimated rent
- $2,093 high interval (Pro) →
- Mortgage (P&I)
- −$1,933
- Tax est. 1.5%
- −$461 /mo · $5,528/yr
- Insurance
- −$154
- HOA
- −$225
- Vacancy / Maint / Mgmt
- −$440
- Net cashflow
- $-1,118
Break-even live
UW: 25.0% down · 7.5% · 30yr · 1.5% tax · 5.0% vac · 8.0% maint · 8.0% mgmt
Financing live
Cash to close
- Down payment
- $92,131
- Closing costs
- $11,056
- Reserves months
- —
- Total cash needed
- —
Loan-product check · same deal, 3 products live
Conventional
25% down · 7.5% · 30yr
- Down + closing
- —
- Monthly P&I
- —
- Monthly cashflow
- —
- DSCR
- —
- Eligible?
- —
Personal DTI + credit; lowest rate.
DSCR
20% down · 8.5% · 30yr
- Down + closing
- —
- Monthly P&I
- —
- Monthly cashflow
- —
- DSCR
- —
- Eligible?
- —
No personal income docs; deal must DSCR.
Hard money
10% down · 12.0% · 12mo
- Down + closing
- —
- Monthly P&I
- —
- Monthly cashflow
- —
- DSCR
- —
- Eligible?
- —
Short-term bridge; refi at stabilization.
Rent comps 40 comps
| Address | Beds | Baths | Sqft | Rent | $/sqft | DOM | Units | Dist |
|---|---|---|---|---|---|---|---|---|
| 773 Fayetteville Rd SE Atlanta, GA | 3.0 | 2.0 | 1085 | $2,100 | $1.94 | 43d | 1 | 0.14mi |
| 2201 Glenwood Ave SE Atlanta, GA | 2.0 | 1.0–2.0 | 819 | $2,699 | $3.30 | 20d | 5 | 0.16mi |
| 1881 2nd Ave Decatur, GA | 3.0 | 1.0–2.5 | 1010 | $3,007 | $2.98 | 2d | 60 | 0.17mi |
| 1761 Terry Mill Rd SE Atlanta, GA | 3.0 | 1.5 | 1296 | $1,900 | $1.47 | 16d | 1 | 0.26mi |
| 460 E Lake Blvd SE Atlanta, GA | 1.0–2.0 | 1.0–2.0 | 1104 | $1,699 | $1.54 | 2d | 6 | 0.26mi |
| 1986 Cogar Dr Decatur, GA | 2.0 | 1.0 | 750 | $1,300 | $1.73 | 43d | 1 | 0.33mi |
| 2000 Bencal Dr SE Atlanta, GA | 3.0 | 2.0 | 1500 | $1,850 | $1.23 | 24d | 1 | 0.41mi |
| 1624 Terry Mill Rd SE Atlanta, GA | 2.0 | 1.0 | 768 | $1,700 | $2.21 | 24d | 1 | 0.45mi |
| 2078 E Lilac Ln Decatur, GA | 3.0 | 1.0 | 1160 | $1,600 | $1.38 | 43d | 1 | 0.52mi |
| 2062 Bencal Dr SE Atlanta, GA | 3.0 | 2.0 | 1260 | $1,650 | $1.31 | 24d | 1 | 0.55mi |
| 1840 Camellia Dr Decatur, GA | 3.0 | 2.0 | 1394 | $2,100 | $1.51 | 43d | 1 | 0.56mi |
| 1840 Camellia Dr Decatur, GA | 3.0 | 2.0 | 1340 | $1,950 | $1.46 | 21d | 1 | 0.56mi |
| 2163 Lilac Ln Decatur, GA | 3.0 | 2.0 | 1107 | $2,150 | $1.94 | 43d | 1 | 0.64mi |
| 2043 Juanita St Decatur, GA | 3.0 | 2.0 | 1500 | $3,000 | $2.00 | 43d | 1 | 0.67mi |
| 1916 Longdale Dr Decatur, GA | 3.0 | 2.0 | 1176 | $2,395 | $2.04 | 43d | 1 | 0.71mi |
| 2006 McAfee Pl Decatur, GA | 3.0 | 2.0 | 1128 | $2,295 | $2.03 | 24d | 1 | 0.77mi |
| 1930 Flat Shoals Rd SE Atlanta, GA | 1.0–2.0 | 1.0–1.5 | 1045 | $1,479 | $1.42 | 5d | 17 | 0.87mi |
| 2234 Brunswick Ave Decatur, GA | 2.0 | 1.0 | 780 | $1,950 | $2.50 | 5d | 1 | 0.88mi |
| 1582 Lincoln Ave SE Atlanta, GA | 3.0 | 1.0 | 975 | $1,990 | $2.04 | 43d | 1 | 0.89mi |
| 170 Color Cir Atlanta, GA | 2.0 | 2.0 | 1120 | $2,800 | $2.50 | 24d | 1 | 0.92mi |
| 326 Wilkinson Dr SE Unit A Atlanta, GA | 2.0 | 1.5 | 1028 | $2,200 | $2.14 | 43d | 1 | 0.94mi |
| 1540 Millwood Pl SE Atlanta, GA | 3.0 | 3.5 | 1440 | $3,000 | $2.08 | 43d | 1 | 0.95mi |
| 202 Warren St SE Atlanta, GA | 3.0 | 2.0 | 1466 | $2,500 | $1.71 | 18d | 1 | 1.01mi |
| 200 Vineyard Walk Atlanta, GA | 2.0 | 1.0 | 884 | $1,294 | $1.46 | 1d | 6 | 1.07mi |
| 71 Howard St SE Atlanta, GA | 1.0–2.0 | 1.0–2.0 | 1031 | $2,611 | $2.53 | 1d | 9 | 1.07mi |
| 531 Allendale Dr Decatur, GA | 3.0 | 2.0 | 888 | $2,100 | $2.36 | 43d | 1 | 1.08mi |
| 183 Dearborn St SE Atlanta, GA | 2.0 | 1.0 | 876 | $2,300 | $2.63 | 13d | 1 | 1.10mi |
| 1800 Memorial Dr SE Atlanta, GA | 2.0 | 1.0 | 900 | $1,300 | $1.44 | 17d | 1 | 1.12mi |
| 2283 Scotty Cir Decatur, GA | 3.0 | 2.0 | 1298 | $2,150 | $1.66 | 43d | 1 | 1.17mi |
| 277 Clifton St SE Atlanta, GA | 1.0–3.0 | 1.0–3.5 | 1175 | $2,683 | $2.28 | 2d | 7 | 1.22mi |
| 99 Norwood Ave NE Unit B Atlanta, GA | 2.0 | 1.0 | 825 | $1,795 | $2.18 | 7d | 1 | 1.27mi |
| 149 Clay St SE Atlanta, GA | 3.0 | 1.0 | 1095 | $2,350 | $2.15 | 24d | 1 | 1.28mi |
| 2335 Scotty Cir Decatur, GA | 3.0 | 1.0 | 1010 | $1,495 | $1.48 | 43d | 1 | 1.28mi |
| 2912 Glenwood Ave SE Atlanta, GA | 2.0 | 1.0 | 1063 | $1,695 | $1.59 | 21d | 1 | 1.30mi |
| 2931 Glenwood Ave SE Atlanta, GA | 2.0 | 1.0 | 865 | $1,750 | $2.02 | 43d | 1 | 1.31mi |
| 2386 Cresta Dr Decatur, GA | 3.0 | 2.5 | 1107 | $2,000 | $1.81 | 43d | 1 | 1.33mi |
| 615 3rd Ave Unit D15 Decatur, GA | 2.0 | 1.0 | 875 | $1,395 | $1.59 | 24d | 1 | 1.36mi |
| 2435 Bouldercliff Way SE Unit B Atlanta, GA | 2.0 | 1.0 | 1236 | $1,600 | $1.29 | 43d | 1 | 1.38mi |
| 2435 Bouldercliff Way SE Atlanta, GA | 3.0 | 2.0 | 1236 | $1,950 | $1.58 | 43d | 1 | 1.38mi |
| 1670 Cecilia Dr SE Atlanta, GA | 3.0 | 2.0 | 1032 | $2,350 | $2.28 | 43d | 1 | 1.39mi |
HOA detail
- Monthly dues
- $225 · $2,700/yr
Listing history 15 events
-
2026-06-18days on market $270,000 Active 51 DOM
-
2026-06-17days on market $270,000 Active 50 DOM
-
2026-06-16days on market $270,000 Active 49 DOM
-
2026-06-15days on market $270,000 Active 48 DOM
-
2026-06-13days on market $270,000 Active 46 DOM
-
2026-06-13days on market $270,000 Active 45 DOM
-
2026-06-09days on market $270,000 Active 42 DOM
-
2026-06-08days on market $270,000 Active 41 DOM
-
2026-06-07days on market $270,000 Active 40 DOM
-
2026-06-04days on market $270,000 Active 37 DOM
-
2026-06-03days on market $270,000 Active 36 DOM
-
2026-06-02days on market $270,000 Active 35 DOM
-
2026-06-01days on market $270,000 Active 34 DOM
-
2026-05-31days on market $270,000 Active 33 DOM
-
2026-04-28$270,000 New 1246-char remark
ⓘ Source: listings_history table (triggers on properties + properties_extension) + one-shot
backfill from property_details.listing_events for pre-trigger history.
Nearby sold comps map
Loading sold comps map…
Walkable amenities ~0.75 mi
Loading nearby amenities…
Taxation est. · year 1
- Rental income
- $25,119
- − Mortgage interest
- −$20,643
- − Property taxes
- −$5,528
- − Insurance
- −$1,843
- − Repairs & maintenance
- −$2,010
- − Management
- −$2,010
- − HOA
- −$2,700
- − Depreciation
- −$10,721
- Taxable loss
- −$20,334
- Est. tax savings @ 24.0%
- +$4,880
- After-tax cash flow
- $-8,537/yr
For passive investors: Depreciation is non-cash, so a rental often shows a tax loss while cash-flowing — sheltering income. Rental losses are passive: they offset passive income freely, and up to $25,000/yr can offset ordinary (W-2) income if you actively participate and your MAGI is under $100k (phasing out to $0 by $150k); unused losses carry forward. On sale, claimed depreciation is recaptured at up to 25%, and gains may owe capital-gains tax (a 1031 exchange can defer both). Figures are a year-1 estimate at your 24.0% rate — not tax advice; consult a CPA.
Schools (NCES district)
- District
- Atlanta Public Schools
- NCES district ID
- 1300120
- Math proficiency
- 28% ▼ -6.00%
- Reading proficiency
- 35% ▼ -2.00%
- Median HH income
- $48,306
- Composite
- 27.27/100
- National rank
- #7006
- State rank
- #80 of 174 in GA
Livability — Atlanta
- Score
- 83/100
- State rank
- #6
- US rank
- #919
Category grades
Schools grade is shown separately in the Schools card above.
Census & demographics
- Census place
- Atlanta, GA
- County
- Dekalb County · 782,738 people
- City population
- 629,525
- Metro
- Atlanta-Sandy Springs-Alpharetta, GA
- Population (ZIP)
- 35,107
- Household income
- $102,891
- Rent vs Own
- Severe rent burden
- 1897.0
Population outlook (DeKalb County) Hauer SSP2
- Today (2025)
- 839,977 people
- By 2030
- 891,768 · +6.2%
- By 2040
- 988,894 · +17.7%
- By 2050
- 1,074,583 · +27.9%
- By 2075
- 1,245,026 · +48.2%
- By 2100
- 1,303,135 · +55.1%
Race, ethnicity, and origin ACS 2023
- Neighborhood character
- Diverse neighborhood (Simpson 0.64)
- Race & ethnicity
- Black 47% White 36% Hispanic / Latino 8% Two or more races 7% Asian 4%
- Hispanic origin (detail)
- Mexican 4%
- Common ancestry
- Lithuanian 2% Romanian 2% Slovak 1%
- Foreign-born
- 6% · Canada
- Languages at home
- 93% English-only · Spanish 4% French/Haitian/Cajun 1% Other Indo-European 1%
Political lean MEDSL · DeKalb
- 2024 margin
- Solid D (+64.8) · D 81.9% · R 17.1% · Other 1.0%
- 2008→2024 swing
- +6.1pp toward D · 2008: 58.6pp · 2024: 64.8pp
- All cycles
- 2024: D+64.8 2020: D+67.4 2016: D+64.8 2012: D+56.8 2008: D+58.6
Not yet ingested
- Civics
- —
Market trends
- HPI YoY
- ▼ -415.92%
- Current HPI
- 318.454
- Rent YoY
- ▲ 2.33%
- Metro
- Atlanta-Sandy Springs-Alpharetta, GA
- State GDP YoY
- ▲ 2.66%
- F500 in state
- 28
Industry mix (Fortune 500 HQ in GA)
| Industry | F500 HQs | Revenue |
|---|---|---|
| Paper / Packaging | 2 | $29B |
|
||
| Retail | 1 | $160B |
|
||
| Transportation / Logistics | 1 | $91B |
|
||
| Airlines | 1 | $62B |
|
||
| Consumer Goods | 1 | $47B |
|
||
| Utilities | 1 | $25B |
|
||
Price history
1 event — show timeline
- 2026-04-28 Listed $270,000 GAMLS
Cash-flow waterfall
monthlySold comps — $/sqft
last 12 mo · ≤1 miLoading sold comps…