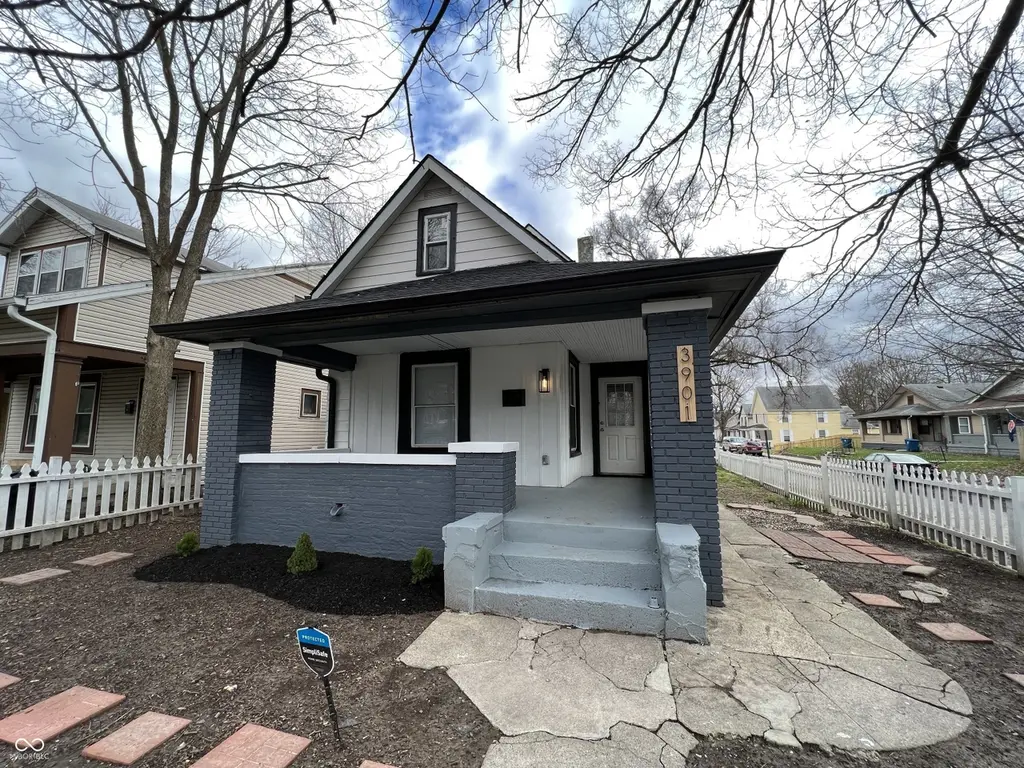
3901 Rookwood Ave · Indianapolis city (balance), IN
Flood risk 1/10 · Minimal
- FEMA flood zone
- X (unshaded)
- Chance of flooding over 30 yrs
- 0.0%
- Est. flood insurance / yr
- $473 – $860
Fire risk 1/10 · Minimal
- Est. fire insurance / yr
- $717 – $1,331
Heat risk 4/10 · Minor
- Hot days now (above 101°F)
- 7 days/yr
- Hot days in 30 yrs
- 19 days/yr
Wind risk 2/10 · Minimal
- Chance of severe wind over 30 yrs
- 0.0%
Air-quality risk 4/10 · Minor
- Unhealthy air days now
- 5 days/yr
- Unhealthy air days in 30 yrs
- 7 days/yr
Risk factors via First Street. Map © Google.
Why this score? — see what drove the C grade
The composite is a weighted blend of 9 inputs, each scored 0–100. Each bar is that input's sub-score; the figure is the points it added to the 100-point composite (weight × sub-score).
- Cash flow +18.5/30.0
- ARV discount +15.0/15.0
- 1% rule +5.9/10.0
- DSCR +5.8/10.0
- Rent growth +4.1/5.0
- Livability +2.5/5.0
- Condition / age +2.5/5.0
- Schools +1.4/10.0
- Appreciation +0.0/10.0
$195,000
🖨 Deal sheet 📄 Offer letter ✓ Due diligence
Listing remarks MLS
BUTLER TARKINGTON convenient to Downtown, Butler University , other Institutes of Higher Learning, Museums, Parks , shopping and public transportation. Home now has 4 bedrooms and 2 baths but could accommodate 2 more bedrooms. Could use some updating but is ready for move in. Being sold "as is"but priced accordingly. Build equity as you update on your own time. Preliminary title at Eagle Land Title
Key facts
- Spacious dining room
- Modern appliances
- Bright living room
Tags
Property features AI
Exterior
- Parking: Alley access; no garage
- Utilities: Public water; Municipal sewer connected; 100 amp electric service; Solid waste service available
- Home design: Single family residence; One-and-a-half story
- Construction: Brick and wood siding exterior; Other foundation
- Exterior features: Full fence; Corner lot with mature trees
Interior
- Kitchen: Electric oven; Refrigerator; Eat-in kitchen
- Bedrooms: Four bedrooms total — one on the main level and three on the upper level
- Flooring: Hardwood floors
- Bathrooms: Two full bathrooms total; Primary bathroom with tub and shower
- Heating & cooling: Forced air heating (natural gas); Central air conditioning
- Interior features: Attic access; Hardwood floors; Painted woodwork; Eat-in kitchen; Living room is formal; Cellar in basement; One fireplace (family room; currently non-functional)
- Laundry & utility: In-unit laundry; Gas water heater
Neighborhood map
What this means for you Summary
Snapshot
- This is a 6-bed/1.0-bath single-family listed at $195k.
Deal economics
- At list price, monthly cash flow is $186 ($2k/yr) — positive.
- The deal already cash-flows at list — no discount required.
- Meets the 1% rule at list price ($2k rent vs $195k).
- Recommended offer: $189k (3.0% below list) — sets the bar for market timing.
- Cap rate 7.4% vs local median 4.4% in Indianapolis city (balance) — top-decile yield for the area; either an underpriced asset or a hidden risk that comps aren't pricing in. Stress-test before assuming the spread holds.
Location & tenants
- Location reads: area grade C — affects rentability + tenant quality, not the cash-flow math above.
- Indianapolis Public Schools (urban): math 14% / reading 20% proficiency, ranked #286 of 301 in IN (top 95%) — low school quality limits family demand, transient renter base, plan for 1-2y turnover; 77% free/reduced lunch — lower-income household profile, screen leases tightly.
- Zoned schools: Shortridge High School (math 20% / reading 51%, grade F, #263 of 369 statewide, top 72%, 1,089 students, 70% FRL).
- Zoned-school proficiency averages 36% at this address vs 17% district-wide (+18 pts) — the actual schools serving this property are materially stronger than the Indianapolis Public Schools average implies; a family-tenant draw the district grade alone would hide.
- Market conditions: Rents rising fast (+6.4%/yr); 279 active listings in the ZIP; 1 comparable units currently listed for rent nearby; 1,906 units permitted in Marion County in 2024 (621 in 5+ unit buildings).
- This rent runs 43% of the median local income ($60k/yr) — at the standard rent-burdened threshold; future hikes will face affordability resistance.
Forward outlook
- Local home prices are declining (-3.0%/yr); year-one equity from $1k of loan paydown is wiped out by about $6k of value loss. Plan a longer hold.
- Marion County population projected at +18% by 2050 — long-run rental-demand tailwind backs the buy-and-hold thesis.
Negotiation context
- It's been on market 52 days — a 3% lower offer ($189k) is reasonable based on typical stale-listing flexibility.
- 5 sale attempts since 22y ago; this cycle's ask has dropped $20k (9%) from the opening price — seller is motivated, your offer sets the floor, not the list.
- Current owner paid $155k; 26% above their basis — modest negotiation headroom, anchor on the comps not their cost.
Risks & watch-outs
- Watch-outs: built in 1904 — expect roof / HVAC / electrical / plumbing capex.
Questions for the listing agent
- It's been on market 52 days. Have you received any prior offers? Is the seller open to a 3% concession, seller financing, or rate buy-down credit?
- Built in 1904 — when were the roof, HVAC, electrical panel, plumbing, and water heater last replaced?
- Is there a deadline driving the sale (1031 exchange, divorce, estate, relocation)? That informs how much negotiation room exists.
- What's the average days-on-market for RENTAL listings here right now (not sales)? A rising rental-DOM trend means longer vacancies and softer asking-rent achievability than the comps imply.
- What's the recent tenant-quality profile in this submarket — average credit score on applications, eviction rate, late-payment / NSF rate, and stable-employment percentage? A property-management company in the area should have these aggregated.
- How much new for-sale + rental construction is in the pipeline within 1–3 miles? Heavy new supply typically softens prices + rents 12–24 months out; constrained supply supports both.
Investment metrics
- 1% rule
- 1.09% ✓
- Cap rate
- 7.44%
- Cash-on-cash
- 4.08%
- DSCR
- 1.18
- GRM
- 7.6
CMA / ARV
- ARV (median comp)
- $235,064
- List price
- $195,000
- Delta
- -17.04%
- Verdict
- UNDERPRICED
- Comps
- 20 within 1.0 mi
Show comp detail 3 sales within ~0.75 mi
| Address | Dist | Beds/Ba | Sqft | Sold | Price | $/sf | Match |
|---|---|---|---|---|---|---|---|
| 714 Berkley Rd | 0.63mi | 6/3.0 | 2,783 (+14%) | 3mo | $355,000 | $128 | 36 |
| 4329 Sunset Ave | 0.59mi | 5/3.0 (-1) | 2,790 (+15%) | 4mo | $465,000 | $167 | 31 |
| 171 W 44th St | 0.69mi | 5/2.5 (-1) | 2,673 (+10%) | 12mo | $640,000 | $239 | 30 |
Match score weights: distance 35% · size 25% · config 20% · recency 20%. Top-matched comps best support the ARV.
Projected returns pro-forma
-3.0% appreciation · 6.43% rent growth · sell at horizon
- IRR
- -5.7%
- Equity multiple
- 0.78×
- Total profit
- $-12,050
- Equity at exit
- $29,075
- IRR
- 8.0%
- Equity multiple
- 1.71×
- Total profit
- $38,685
- Equity at exit
- $16,860
Cash invested: $54,600 (down + closing). Projections, not guarantees.
Landlord ↔ Tenant lean methodology
- Overall (STATE)
- 90 Strongly Landlord-Friendly
- State Indiana
- 90 Strongly Landlord-Friendly · R+11
- County
- — inherits STATE
- City
- — inherits STATE
ZIP-level market 46208
- Rents YoY
- 6.4%
- Active inventory
- 279
- Price-to-rent
- 7.6×
Monthly cashflow live
- Estimated rent
- $2,128 medium interval (Pro) →
- Mortgage (P&I)
- −$1,023
- Tax from tax record
- −$391 /mo · $4,694/yr
- Insurance
- −$81
- HOA
- −$0
- Vacancy / Maint / Mgmt
- −$447
- Net cashflow
- $186
Break-even live
UW: 25.0% down · 7.5% · 30yr · 1.5% tax · 5.0% vac · 8.0% maint · 8.0% mgmt
Financing live
Cash to close
- Down payment
- $48,750
- Closing costs
- $5,850
- Reserves months
- —
- Total cash needed
- —
Loan-product check · same deal, 3 products live
Conventional
25% down · 7.5% · 30yr
- Down + closing
- —
- Monthly P&I
- —
- Monthly cashflow
- —
- DSCR
- —
- Eligible?
- —
Personal DTI + credit; lowest rate.
DSCR
20% down · 8.5% · 30yr
- Down + closing
- —
- Monthly P&I
- —
- Monthly cashflow
- —
- DSCR
- —
- Eligible?
- —
No personal income docs; deal must DSCR.
Hard money
10% down · 12.0% · 12mo
- Down + closing
- —
- Monthly P&I
- —
- Monthly cashflow
- —
- DSCR
- —
- Eligible?
- —
Short-term bridge; refi at stabilization.
Rent comps 1 comps
| Address | Beds | Baths | Sqft | Rent | $/sqft | DOM | Units | Dist |
|---|---|---|---|---|---|---|---|---|
| 714 Berkley Rd Indianapolis, IN | 6.0 | 3.0 | 2783 | $2,500 | $0.90 | 43d | 1 | 0.61mi |
Listing history 28 events
-
2026-06-18days on market $195,000 Active 52 DOM
-
2026-06-17days on market $195,000 Active 51 DOM
-
2026-06-16days on market $195,000 Active 50 DOM
-
2026-06-15days on market $195,000 Active 49 DOM
-
2026-06-13days on market $195,000 Active 47 DOM
-
2026-06-13days on market $195,000 Active 46 DOM
-
2026-06-09days on market $195,000 Active 43 DOM
-
2026-06-08days on market $195,000 Active 42 DOM
-
2026-06-07pricedays on market $195,000 Active 41 DOM
-
2026-06-03days on market $199,000 Active 37 DOM
-
2026-06-02days on market $199,000 Active 36 DOM
-
2026-06-01days on market $199,000 Active 35 DOM
-
2026-05-31days on market $199,000 Active 34 DOM
-
2026-05-08price $210,000 1338-char remark
-
2026-04-26$215,000 Active 1338-char remark
-
2022-09-29historical
-
2022-06-02$289,900 Active
-
2022-05-12price $2,000
-
2021-11-04soldstatus $155,000 Closed
Show marketing remark (420 chars)
BUTLER TARKINGTON convenient to Downtown, Butler University , other Institutes of Higher Learning, Museums, Parks , shopping and public transportation. Home now has 4 bedrooms and 2 baths but could accommodate 2 more bedrooms. Could use some updating but is ready for move in. Being sold "as is"but priced accordingly. Build equity as you update on your own time. Preliminary title at Eagle Land Title
-
2021-10-23status Pending
Show marketing remark (420 chars)
BUTLER TARKINGTON convenient to Downtown, Butler University , other Institutes of Higher Learning, Museums, Parks , shopping and public transportation. Home now has 4 bedrooms and 2 baths but could accommodate 2 more bedrooms. Could use some updating but is ready for move in. Being sold "as is"but priced accordingly. Build equity as you update on your own time. Preliminary title at Eagle Land Title
-
2021-10-04price $185,000
Show marketing remark (420 chars)
BUTLER TARKINGTON convenient to Downtown, Butler University , other Institutes of Higher Learning, Museums, Parks , shopping and public transportation. Home now has 4 bedrooms and 2 baths but could accommodate 2 more bedrooms. Could use some updating but is ready for move in. Being sold "as is"but priced accordingly. Build equity as you update on your own time. Preliminary title at Eagle Land Title
-
2021-10-01$189,000 Active
Show marketing remark (420 chars)
BUTLER TARKINGTON convenient to Downtown, Butler University , other Institutes of Higher Learning, Museums, Parks , shopping and public transportation. Home now has 4 bedrooms and 2 baths but could accommodate 2 more bedrooms. Could use some updating but is ready for move in. Being sold "as is"but priced accordingly. Build equity as you update on your own time. Preliminary title at Eagle Land Title
-
2021-09-29soldstatus $94,900
-
2010-11-18historical
-
2010-11-17soldstatus $7,000
-
2010-07-16$22,000
-
2004-12-06soldstatus $36,000
-
2004-10-24$35,900
ⓘ Source: listings_history table (triggers on properties + properties_extension) + one-shot
backfill from property_details.listing_events for pre-trigger history.
Tax reassessment forecast IN · Partial reset (capped growth)
- Current annual tax
- $4,694 · $391/mo
- Projected year-2 tax
- $4,694 · $391/mo
- Expected delta
- $0/yr ($0/mo · 0.0%)
ⓘ Screening estimate from a state-policy table — verify with the county assessor before closing.
Climate risk First Street
- Flood 1/10 Low FEMA zone X (unshaded) · 0% chance over 30 yrs
- Wildfire 1/10 Low
- Heat 4/10 Moderate 7 d/yr ≥101°F today · 19 d/yr by 30 yrs out
- Wind 2/10 Low 0% chance of damaging wind over 30 yrs
- Air quality 4/10 Moderate 5 unhealthy d/yr today · 7 by 30 yrs out
Nearby sold comps map
Loading sold comps map…
Walkable amenities ~0.75 mi
Loading nearby amenities…
Taxation est. · year 1
- Rental income
- $25,531
- − Mortgage interest
- −$10,923
- − Property taxes
- −$4,694
- − Insurance
- −$975
- − Repairs & maintenance
- −$2,042
- − Management
- −$2,042
- − Depreciation
- −$5,673
- Taxable loss
- −$819
- Est. tax savings @ 24.0%
- +$197
- After-tax cash flow
- $2,426/yr
For passive investors: Depreciation is non-cash, so a rental often shows a tax loss while cash-flowing — sheltering income. Rental losses are passive: they offset passive income freely, and up to $25,000/yr can offset ordinary (W-2) income if you actively participate and your MAGI is under $100k (phasing out to $0 by $150k); unused losses carry forward. On sale, claimed depreciation is recaptured at up to 25%, and gains may owe capital-gains tax (a 1031 exchange can defer both). Figures are a year-1 estimate at your 24.0% rate — not tax advice; consult a CPA.
Schools (NCES district)
- District
- Indianapolis Public Schools
- NCES district ID
- 1804770
- Math proficiency
- 14% ▼ -7.00%
- Reading proficiency
- 20% ▼ -3.00%
- Median HH income
- $32,034
- Composite
- 13.69/100
- National rank
- #9499
- State rank
- #286 of 301 in IN
Livability — Indianapolis city (balance)
No livability data for this city. (Only ~50 U.S. cities are tracked.)
Census & demographics
- Census place
- Indianapolis city (balance), IN
- County
- Marion County · 998,460 people
- City population
- 881,119
- Metro
- Indianapolis-Carmel-Anderson, IN
- Population (ZIP)
- 22,379
- Household income
- $60,062
- Rent vs Own
- Severe rent burden
- 978.0
Population outlook (Marion County) Hauer SSP2
- Today (2025)
- 1,025,572 people
- By 2030
- 1,065,727 · +3.9%
- By 2040
- 1,141,577 · +11.3%
- By 2050
- 1,208,920 · +17.9%
- By 2075
- 1,367,288 · +33.3%
- By 2100
- 1,438,201 · +40.2%
Race, ethnicity, and origin ACS 2023
- Neighborhood character
- Diverse neighborhood (Simpson 0.62)
- Race & ethnicity
- White 46% Black 40% Hispanic / Latino 8% Two or more races 6% Asian 2%
- Hispanic origin (detail)
- Mexican 4%
- Common ancestry
- Romanian 2% Slovak 2% Italian 1%
- Foreign-born
- 4% · Canada
- Languages at home
- 93% English-only · Spanish 5% French/Haitian/Cajun 1% Other Indo-European 1%
Political lean MEDSL · Marion
- 2024 margin
- Strong D (+27.7) · D 63.0% · R 35.3% · Other 1.7%
- 2008→2024 swing
- -0.7pp no change · 2008: 28.4pp · 2024: 27.7pp
- All cycles
- 2024: D+27.7 2020: D+29.1 2016: D+22.8 2012: D+22.2 2008: D+28.4
Not yet ingested
- Civics
- —
Market trends
- HPI YoY
- ▼ -324.63%
- Current HPI
- 319.7725
- Rent YoY
- ▲ 6.43%
- Metro
- Indianapolis-Carmel-Anderson, IN
- State GDP YoY
- ▲ 2.90%
- F500 in state
- 18
Industry mix (Fortune 500 HQ in IN)
| Industry | F500 HQs | Revenue |
|---|---|---|
| Industrial Machinery | 2 | $37B |
|
||
| Healthcare | 1 | $177B |
|
||
| Pharmaceuticals | 1 | $45B |
|
||
| Metals / Steel | 1 | $18B |
|
||
| Agriculture | 1 | $17B |
|
||
| Packaging | 1 | $12B |
|
||
Price history
+443.2% since first listed17 events — show timeline
- 2026-06-05 Price Changed $195,000 MIBOR as Distributed by MLS Grid
- 2026-05-19 Price Changed $199,000 MIBOR as Distributed by MLS Grid
- 2026-05-08 Price Changed $210,000 MIBOR as Distributed by MLS Grid
- 2026-04-26 Listed $215,000 MIBOR as Distributed by MLS Grid
- 2022-09-29 Listing Removed — MIBOR as Distributed by MLS Grid
- 2022-06-02 Listed $289,900 MIBOR as Distributed by MLS Grid
- 2022-05-12 Price Changed $2,000 RENT.
- 2021-11-04 Sold (MLS) $155,000 MIBOR as Distributed by MLS Grid
- 2021-10-23 Pending — MIBOR as Distributed by MLS Grid
- 2021-10-04 Price Changed $185,000 MIBOR as Distributed by MLS Grid
- 2021-10-01 Listed $189,000 MIBOR as Distributed by MLS Grid
- 2021-09-29 Sold (Public Records) $94,900 Public Records
- 2010-11-18 Listing Removed — MIBOR as Distributed by MLS Grid
- 2010-11-17 Sold (MLS) $7,000 MIBOR as Distributed by MLS Grid
- 2010-07-16 Listed $22,000 MIBOR as Distributed by MLS Grid
- 2004-12-06 Sold (MLS) $36,000 MIBOR as Distributed by MLS Grid
- 2004-10-24 Listed $35,900 MIBOR as Distributed by MLS Grid
Property tax history
+3.0%/yrLatest (2025): $4,694 · +167.9% YoY. Source: county tax records.
Cash-flow waterfall
monthlySold comps — $/sqft
last 12 mo · ≤1 miLoading sold comps…