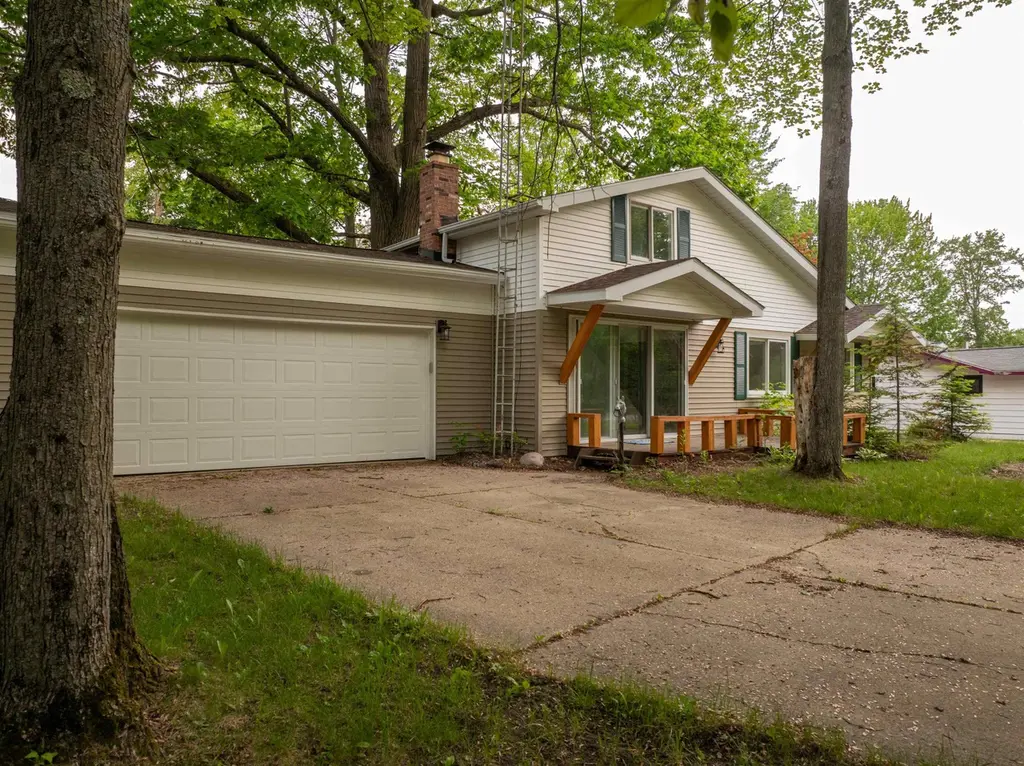
4177 Seminole St · Gladwin, MI
Flood risk 1/10 · Minimal
- FEMA flood zone
- X (unshaded)
- Chance of flooding over 30 yrs
- 0.0%
- Est. flood insurance / yr
- $507 – $1,088
Fire risk 3/10 · Minor
- Est. fire insurance / yr
- $784 – $1,456
Heat risk 2/10 · Minimal
- Hot days now (above 95°F)
- 7 days/yr
- Hot days in 30 yrs
- 13 days/yr
Wind risk 1/10 · Minimal
- Chance of severe wind over 30 yrs
- —
Air-quality risk 2/10 · Minimal
- Unhealthy air days now
- 0 days/yr
- Unhealthy air days in 30 yrs
- 1 days/yr
Risk factors via First Street. Map © Google.
Why this score? — see what drove the B grade
The composite is a weighted blend of 9 inputs, each scored 0–100. Each bar is that input's sub-score; the figure is the points it added to the 100-point composite (weight × sub-score).
- Cash flow +28.7/30.0
- ARV discount +15.0/15.0
- DSCR +10.0/10.0
- 1% rule +8.0/10.0
- Livability +3.6/5.0
- Schools +2.9/10.0
- Rent growth +2.5/5.0
- Condition / age +2.5/5.0
- Appreciation +0.0/10.0
$169,900
🖨 Deal sheet 📄 Offer letter ✓ Due diligence
Listing remarks
COMPLETE REMODEL 4bed/1bath home! Located in the Secord Lake community just a hop/skip/jump from the CLEMENT TWP public boat launch & beach. This home sits on a roomy double corner lot and boasts the following NEW IN 2024-2025: roof, septic, well, home furnace, garage heating/cooling, flooring, drywall, ceilings, lighting, kitchen (granite countertops) & bath. Ok, maybe it's easier to tell you what ISN'T new: water heater, bladder tank and the fencing which encloses the entire back yard. Home has immediate occupancy and includes all appliances seen on premise. Laundry hook up is located in the heated roomy 2 car garage. Home is centrally located between Gladwin and West Branch w
Key facts
- Complete remodel
- New furnace
- New well
Tags
Property features AI
Finance
- Other: No pet restrictions; Outbuildings include garages; Located in Hiawatha Shores Resort subdivision
Exterior
- Parking: Attached garage (2 spaces) — approx. 24 x 24; Additional parking for 3+ vehicles
- Utilities: Private well water; Septic system; Electricity connected; Cable and hard-line internet available (DSL and Spectrum); Phone service available; Well and septic inspection complete
- Home design: Residential 1 1/2-story structure; Built in 1980
- Construction: Vinyl siding construction; Crawl foundation
- Exterior features: Vinyl siding; Fenced yard (owned fence); Porch; Storm windows/screens; All-sports lake access with lake/river privileges and sandy bottom; Interior lake legal water access only; Corner lot in a subdivision with deep and large lot characteristics; Rural view
Interior
- Kitchen: Range/oven; Refrigerator; Kitchen on main floor with laminate flooring (approx. 14 x 11)
- Bedrooms: First-floor bedrooms (two) with carpeted floors; Second-floor bedrooms (two) with carpeted floors
- Flooring: Carpet in bedrooms; Laminate in living, dining, family/sitting rooms, and bathroom; Concrete in laundry room
- Bathrooms: Main floor full bathroom with laminate flooring (approx. 7 x 8)
- Heating & cooling: Electric heating with heat pump(s); Supplemental natural gas space heat; Central air conditioning and heat pump(s); Electric water heater
- Interior features: Cable and DSL available; Living room fireplace with gas/natural fuel and fireplace screen; 10 total rooms
- Laundry & utility: Main-level laundry room (approx. 10 x 6) with concrete flooring
Neighborhood map
What this means for you Summary
Snapshot
- This is a 4-bed/1.0-bath single-family listed at $170k.
Deal economics
- At list price, monthly cash flow is $565 ($7k/yr) — positive.
- The deal already cash-flows at list — no discount required.
- Meets the 1% rule at list price ($2k rent vs $170k).
- Cap rate 10.3% vs local median 7.7% in Gladwin — top-decile yield for the area; either an underpriced asset or a hidden risk that comps aren't pricing in. Stress-test before assuming the spread holds.
Location & tenants
- Location reads 72/100 on livability (#253 in MI) — a middle-class / working-renter tenant base. Strengths: cost of living A+, housing A+, health & safety A+; Watch: crime F, amenities F, commute F.
- West Branch-Rose City Area Schools (rural): math 27% / reading 43% proficiency, ranked #306 of 540 in MI (top 57%) — families likely to look elsewhere, expect single-tenant / working-renter base with shorter leases.
- Market conditions: 287 active listings in the ZIP; 90 units permitted in Gladwin County in 2024 (0 in 5+ unit buildings).
Forward outlook
- Local home prices are declining (-3.0%/yr); year-one equity from $1k of loan paydown is wiped out by about $5k of value loss. Plan a longer hold.
- Gladwin County population projected at -25% by 2050 — secular population decline; favor cash flow + early exit over multi-decade hold.
- At projected returns (-3.0% appreciation + 3.0% rent growth), your $48k cash investment doubles in ~9 years — after that, you're playing with house money.
Negotiation context
- Only 10 days on market — expect competitive offers; lowballing is unlikely to land.
- 6 sale attempts since 2y ago; this cycle's ask has dropped $15k (8%) from the opening price — seller is motivated, your offer sets the floor, not the list.
- Current owner paid $70k; list at $170k implies a 143% gain — meaningful room to come down on a strong offer.
Questions for the listing agent
- Is there a deadline driving the sale (1031 exchange, divorce, estate, relocation)? That informs how much negotiation room exists.
- Crime grade is F in this area — have there been break-ins, vandalism, or insurance claims at this property in the last 3 years? What carrier currently insures it and at what premium?
- What's the average days-on-market for RENTAL listings here right now (not sales)? A rising rental-DOM trend means longer vacancies and softer asking-rent achievability than the comps imply.
- What's the recent tenant-quality profile in this submarket — average credit score on applications, eviction rate, late-payment / NSF rate, and stable-employment percentage? A property-management company in the area should have these aggregated.
- How much new for-sale + rental construction is in the pipeline within 1–3 miles? Heavy new supply typically softens prices + rents 12–24 months out; constrained supply supports both.
Investment metrics
- 1% rule
- 1.30% ✓
- Cap rate
- 10.28%
- Cash-on-cash
- 14.24%
- DSCR
- 1.63
- GRM
- 6.4
CMA / ARV
- ARV (on-the-fly)
- $302,388
- Comps found
- 5
Show comp detail 5 sales within ~0.75 mi
| Address | Dist | Beds/Ba | Sqft | Sold | Price | $/sf | Match |
|---|---|---|---|---|---|---|---|
| 4271 Rose Ln | 0.18mi | 4/3.0 | 1,420 (+5%) | 12mo | $655,000 | $461 | 66 |
| 4100 N Three Rivers Rd | 0.35mi | 3/2.0 (-1) | 1,300 (-4%) | 15mo | $169,000 | $130 | 55 |
| 1543 Loebrich Dr | 0.39mi | 3/2.0 (-1) | 1,544 (+14%) | 10mo | $344,500 | $223 | 42 |
| 1634 Deerhaven Rd | 0.62mi | 3/2.0 (-1) | 1,232 (-9%) | 21mo | $269,000 | $218 | 29 |
| 3944 THENDARA Dr | 0.68mi | 3/2.0 (-1) | 1,169 (-14%) | 11mo | $385,000 | $329 | 27 |
Match score weights: distance 35% · size 25% · config 20% · recency 20%. Top-matched comps best support the ARV.
Projected returns pro-forma
-3.0% appreciation · 3.0% rent growth · sell at horizon
- IRR
- 4.6%
- Equity multiple
- 1.18×
- Total profit
- $8,458
- Equity at exit
- $25,333
- IRR
- 14.1%
- Equity multiple
- 2.13×
- Total profit
- $53,799
- Equity at exit
- $14,690
Cash invested: $47,572 (down + closing). Projections, not guarantees.
Landlord ↔ Tenant lean methodology
- Overall (STATE)
- 62 Landlord-Friendly
- State Michigan
- 62 Landlord-Friendly · EVEN
- County
- — inherits STATE
- City
- — inherits STATE
ZIP-level market 48624
- Home prices YoY
- -23.4%
- Active inventory
- 287
- Price-to-rent
- 6.4×
Monthly cashflow live
- Estimated rent
- $2,201 medium interval (Pro) →
- Mortgage (P&I)
- −$891
- Tax est. 1.5%
- −$212 /mo · $2,548/yr
- Insurance
- −$71
- HOA
- −$0
- Vacancy / Maint / Mgmt
- −$462
- Net cashflow
- $565
Break-even live
UW: 25.0% down · 7.5% · 30yr · 1.5% tax · 5.0% vac · 8.0% maint · 8.0% mgmt
Financing live
Cash to close
- Down payment
- $42,475
- Closing costs
- $5,097
- Reserves months
- —
- Total cash needed
- —
Loan-product check · same deal, 3 products live
Conventional
25% down · 7.5% · 30yr
- Down + closing
- —
- Monthly P&I
- —
- Monthly cashflow
- —
- DSCR
- —
- Eligible?
- —
Personal DTI + credit; lowest rate.
DSCR
20% down · 8.5% · 30yr
- Down + closing
- —
- Monthly P&I
- —
- Monthly cashflow
- —
- DSCR
- —
- Eligible?
- —
No personal income docs; deal must DSCR.
Hard money
10% down · 12.0% · 12mo
- Down + closing
- —
- Monthly P&I
- —
- Monthly cashflow
- —
- DSCR
- —
- Eligible?
- —
Short-term bridge; refi at stabilization.
Listing history 7 events
-
2026-06-13days on market $169,900 Active 10 DOM
-
2026-06-12days on market $169,900 Active 9 DOM
-
2026-06-09days on market $169,900 Active 6 DOM
-
2026-06-08days on market $169,900 Active 5 DOM
-
2026-06-07days on market $169,900 Active 4 DOM
-
2026-06-07remarks 691-char remark
-
2026-06-07$169,900 Active 3 DOM
ⓘ Source: listings_history table (triggers on properties + properties_extension) + one-shot
backfill from property_details.listing_events for pre-trigger history.
Climate risk First Street
- Flood 1/10 Low FEMA zone X (unshaded) · 0% chance over 30 yrs
- Wildfire 3/10 Moderate
- Heat 2/10 Low 7 d/yr ≥95°F today · 13 d/yr by 30 yrs out
- Wind 1/10 Low
- Air quality 2/10 Low 0 unhealthy d/yr today · 1 by 30 yrs out
Nearby sold comps map
Loading sold comps map…
Walkable amenities ~0.75 mi
Loading nearby amenities…
Taxation est. · year 1
- Rental income
- $26,410
- − Mortgage interest
- −$9,517
- − Property taxes
- −$2,548
- − Insurance
- −$850
- − Repairs & maintenance
- −$2,113
- − Management
- −$2,113
- − Depreciation
- −$4,943
- Taxable income
- $4,327
- Est. tax owed @ 24.0%
- −$1,038
- After-tax cash flow
- $5,736/yr
For passive investors: Depreciation is non-cash, so a rental often shows a tax loss while cash-flowing — sheltering income. Rental losses are passive: they offset passive income freely, and up to $25,000/yr can offset ordinary (W-2) income if you actively participate and your MAGI is under $100k (phasing out to $0 by $150k); unused losses carry forward. On sale, claimed depreciation is recaptured at up to 25%, and gains may owe capital-gains tax (a 1031 exchange can defer both). Figures are a year-1 estimate at your 24.0% rate — not tax advice; consult a CPA.
Schools (NCES district)
- District
- West Branch-Rose City Area Schools
- NCES district ID
- 2635850
- Math proficiency
- 27% ▼ -14.00%
- Reading proficiency
- 43% ▼ -10.00%
- Median HH income
- $38,145
- Composite
- 29.15/100
- National rank
- #6580
- State rank
- #306 of 540 in MI
Livability — Gladwin
- Score
- 72/100
- State rank
- #253
- US rank
- #6296
Category grades
Schools grade is shown separately in the Schools card above.
Census & demographics
- Population (ZIP)
- 16,269
Population outlook (Gladwin County) Hauer SSP2
- Today (2025)
- 23,440 people
- By 2030
- 22,281 · -4.9%
- By 2040
- 19,867 · -15.2%
- By 2050
- 17,667 · -24.6%
- By 2075
- 12,909 · -44.9%
- By 2100
- 8,629 · -63.2%
Race, ethnicity, and origin ACS 2023
- Neighborhood character
- Predominantly White (94%)
- Race & ethnicity
- White 94% Two or more races 4% Hispanic / Latino 2%
- Common ancestry
- Romanian 8% Lithuanian 3% Iranian 3%
- Foreign-born
- 1%
- Languages at home
- 95% English-only · German/W. Germanic 4% Spanish 1%
Political lean MEDSL · Gladwin
- 2024 margin
- Solid R (+40.7) · D 29.1% · R 69.8% · Other 1.1%
- 2008→2024 swing
- -42.2pp toward R · 2008: 1.5pp · 2024: -40.7pp
- All cycles
- 2024: R+40.7 2020: R+36.8 2016: R+34.7 2012: R+7.2 2008: D+1.5
Not yet ingested
- Civics
- —
Market trends
- HPI YoY
- ▼ -72.67%
- Current HPI
- 238.0744
- Rent YoY
- —
- Metro
- —
- State GDP YoY
- ▲ 1.37%
- F500 in state
- 28
Industry mix (Fortune 500 HQ in MI)
| Industry | F500 HQs | Revenue |
|---|---|---|
| Automotive Parts | 3 | $48B |
|
||
| Automotive | 2 | $372B |
|
||
| Chemicals | 1 | $45B |
|
||
| Automotive Retail | 1 | $29B |
|
||
| Healthcare / Medical Devices | 1 | $23B |
|
||
| Automotive Technology | 1 | $20B |
|
||
Price history
+126.5% since first listed27 events — show timeline
- 2026-06-05 Price Changed $169,900 MiRealSource-MiMLS
- 2026-06-03 Listed $184,900 MiRealSource-MiMLS
- 2025-09-14 Listing Removed — MiRealSource-MiMLS
- 2025-09-14 Listing Removed — MiRealSource-MiMLS
- 2025-09-14 Listing Removed — REALCOMP
- 2025-06-23 Price Changed $189,900 MiRealSource-MiMLS
- 2025-06-22 Price Changed $189,900 MiRealSource-MiMLS
- 2025-06-22 Price Changed $189,900 REALCOMP
- 2025-06-20 Price Changed $199,000 MiRealSource-MiMLS
- 2025-06-20 Price Changed $199,000 MiRealSource-MiMLS
- 2025-06-20 Price Changed $199,000 REALCOMP
- 2025-06-19 Relisted — REALCOMP
- 2025-06-19 Listing Removed — REALCOMP
- 2025-04-20 Price Changed $209,900 MiRealSource-MiMLS
- 2025-04-19 Price Changed $209,900 MiRealSource-MiMLS
- 2025-04-19 Price Changed $209,900 REALCOMP
- 2025-03-19 Price Changed $219,900 MiRealSource-MiMLS
- 2025-03-19 Price Changed $219,900 MiRealSource-MiMLS
- 2025-03-19 Price Changed $219,900 REALCOMP
- 2025-03-13 Listed $234,900 MiRealSource-MiMLS
- 2025-03-13 Listed $234,900 MiRealSource-MiMLS
- 2025-03-13 Listed $234,900 REALCOMP
- 2024-05-02 Sold (Public Records) $70,011 Public Records
- 2024-05-01 Sold (MLS) $70,011 MiRealSource-MiMLS
- 2024-04-29 Pending — MiRealSource-MiMLS
- 2024-04-22 Contingent — MiRealSource-MiMLS
- 2024-04-06 Listed $75,011 MiRealSource-MiMLS
Property tax history
-12.1%/yrLatest (2024): $231 · +7.8% YoY. Source: county tax records.
Cash-flow waterfall
monthlySold comps — $/sqft
last 12 mo · ≤1 miLoading sold comps…