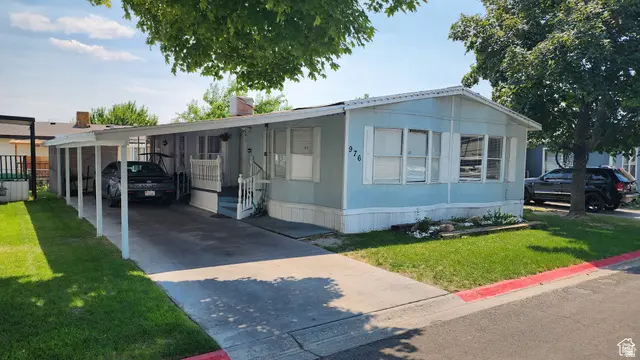
976 E 1230 S · Provo, UT
Flood risk No data
- FEMA flood zone
- —
- Chance of flooding over 30 yrs
- —
- Est. flood insurance / yr
- —
Fire risk No data
- Est. fire insurance / yr
- —
Heat risk No data
- Hot days now (above threshold)
- —
- Hot days in 30 yrs
- —
Wind risk No data
- Chance of severe wind over 30 yrs
- —
Air-quality risk No data
- Unhealthy air days now
- —
- Unhealthy air days in 30 yrs
- —
Risk factors via First Street. Map © Google.
Why this score? — see what drove the B grade
The composite is a weighted blend of 9 inputs, each scored 0–100. Each bar is that input's sub-score; the figure is the points it added to the 100-point composite (weight × sub-score).
- Cash flow +30.0/30.0
- DSCR +10.0/10.0
- 1% rule +9.9/10.0
- ARV discount +7.5/15.0
- Livability +4.2/5.0
- Condition / age +4.0/5.0
- Schools +3.5/10.0
- Rent growth +3.1/5.0
- Appreciation +0.0/10.0
$125,000
🖨 Deal sheet 📄 Offer letter ✓ Due diligence
Listing remarks MLS
Very easy to show. Cheaper than rent.
Key facts
- 2 parking spots
- Built 1985
- Listed 90 days
Neighborhood map
What this means for you Summary
Snapshot
- This is a 4-bed/2.0-bath manufactured listed at $125k. Condition is rated good.
Deal economics
- At list price, monthly cash flow is $611 ($7k/yr) — positive.
- The deal already cash-flows at list — no discount required.
- Meets the 1% rule at list price ($2k rent vs $125k).
- Recommended offer: $118k (6.0% below list) — sets the bar for market timing.
Location & tenants
- Location reads 85/100 on livability (#15 in UT, #602 nationally) — a professional / high-income tenant draw. Strengths: amenities A+, commute A+, health & safety A.
- Provo District (urban): math 38% / reading 46% proficiency, ranked #44 of 80 in UT (top 55%) — families likely to look elsewhere, expect single-tenant / working-renter base with shorter leases.
- Market conditions: Rents rising (+2.2%/yr); 130 active listings in the ZIP; 14 comparable units currently listed for rent nearby; rentals at typical pace (median 23d on market — plan ~3-4 weeks tenant-placement turnaround); 6,326 units permitted in Utah County in 2024 (1,053 in 5+ unit buildings).
- This rent runs 42% of the median local income ($53k/yr) — at the standard rent-burdened threshold; future hikes will face affordability resistance.
Forward outlook
- Local home prices are declining (-3.0%/yr); year-one equity from $864 of loan paydown is wiped out by about $4k of value loss. Plan a longer hold.
- Utah County population projected at +49% by 2050 — long-run rental-demand tailwind backs the buy-and-hold thesis.
- At projected returns (-3.0% appreciation + 2.2% rent growth), your $35k cash investment doubles in ~7 years — after that, you're playing with house money.
Negotiation context
- It's been on market 90 days — a 6% lower offer ($118k) is reasonable based on typical stale-listing flexibility.
- 2 sale attempts with the ask held roughly flat each time — persistent listings suggest the price (not the market) is what's stuck; bring a comps-based counter.
Questions for the listing agent
- It's been on market 90 days. Have you received any prior offers? Is the seller open to a 6% concession, seller financing, or rate buy-down credit?
- Why hasn't it sold? Are there any deal-killer items the seller is aware of (foundation, flood, title, zoning, code violations)?
- Is there a deadline driving the sale (1031 exchange, divorce, estate, relocation)? That informs how much negotiation room exists.
- What's the average days-on-market for RENTAL listings here right now (not sales)? A rising rental-DOM trend means longer vacancies and softer asking-rent achievability than the comps imply.
- What's the recent tenant-quality profile in this submarket — average credit score on applications, eviction rate, late-payment / NSF rate, and stable-employment percentage? A property-management company in the area should have these aggregated.
- How much new for-sale + rental construction is in the pipeline within 1–3 miles? Heavy new supply typically softens prices + rents 12–24 months out; constrained supply supports both.
Investment metrics
- 1% rule
- 1.49% ✓
- Cap rate
- 12.15%
- Cash-on-cash
- 20.93%
- DSCR
- 1.93
- GRM
- 5.6
CMA / ARV
No comps found within radius.
Projected returns pro-forma
-3.0% appreciation · 2.2% rent growth · sell at horizon
- IRR
- 12.5%
- Equity multiple
- 1.49×
- Total profit
- $17,171
- Equity at exit
- $18,638
- IRR
- 20.7%
- Equity multiple
- 2.69×
- Total profit
- $59,124
- Equity at exit
- $10,808
Cash invested: $35,000 (down + closing). Projections, not guarantees.
Landlord ↔ Tenant lean methodology
- Overall (STATE)
- 86 Strongly Landlord-Friendly
- State Utah
- 86 Strongly Landlord-Friendly · R+15
- County
- — inherits STATE
- City
- — inherits STATE
ZIP-level market 84606
- Rents YoY
- 2.2%
- Active inventory
- 130
- Price-to-rent
- 5.6×
Monthly cashflow live
- Estimated rent
- $1,866 high interval (Pro) →
- Mortgage (P&I)
- −$656
- Tax est. 1.5%
- −$156 /mo · $1,875/yr
- Insurance
- −$52
- HOA
- −$0
- Vacancy / Maint / Mgmt
- −$392
- Net cashflow
- $611
Break-even live
UW: 25.0% down · 7.5% · 30yr · 1.5% tax · 5.0% vac · 8.0% maint · 8.0% mgmt
Financing live
Cash to close
- Down payment
- $31,250
- Closing costs
- $3,750
- Reserves months
- —
- Total cash needed
- —
Loan-product check · same deal, 3 products live
Conventional
25% down · 7.5% · 30yr
- Down + closing
- —
- Monthly P&I
- —
- Monthly cashflow
- —
- DSCR
- —
- Eligible?
- —
Personal DTI + credit; lowest rate.
DSCR
20% down · 8.5% · 30yr
- Down + closing
- —
- Monthly P&I
- —
- Monthly cashflow
- —
- DSCR
- —
- Eligible?
- —
No personal income docs; deal must DSCR.
Hard money
10% down · 12.0% · 12mo
- Down + closing
- —
- Monthly P&I
- —
- Monthly cashflow
- —
- DSCR
- —
- Eligible?
- —
Short-term bridge; refi at stabilization.
Rent comps 14 comps
| Address | Beds | Baths | Sqft | Rent | $/sqft | DOM | Units | Dist |
|---|---|---|---|---|---|---|---|---|
| 1156 S 1420 E Provo, UT | 4.0 | 3.5 | 1616 | $2,499 | $1.55 | 23d | 1 | 0.36mi |
| 757 E 950 S Provo, UT | 3.0 | 1.5 | 1300 | $1,600 | $1.23 | 23d | 1 | 0.40mi |
| 755 E 950 South St Provo, UT | 3.0 | 1.5 | 1300 | $1,600 | $1.23 | 19d | 1 | 0.40mi |
| 1391 S 1420 E Provo, UT | 3.0 | 1.5 | 1385 | $1,950 | $1.41 | 23d | 1 | 0.42mi |
| 688 E 500 S Provo, UT | 3.0 | 3.0 | 1630 | $2,200 | $1.35 | 23d | 1 | 0.74mi |
| 389 S State St Provo, UT | 2.0–3.0 | 1.5–2.0 | 1134 | $1,550 | $1.37 | 11d | 1 | 0.84mi |
| 338 S 900 E Provo, UT | 3.0 | 2.0 | 1660 | $2,400 | $1.45 | 23d | 1 | 0.85mi |
| 472 S 300 E Provo, UT | 4.0 | 2.0 | 1654 | $1,850 | $1.12 | 19d | 1 | 0.99mi |
| 111 S 1000 E Provo, UT | 3.0 | 1.0 | 1059 | $1,549 | $1.46 | 14d | 1 | 1.06mi |
| 809 E 50 S Provo, UT | 3.0 | 1.0 | 926 | $1,450 | $1.57 | 23d | 1 | 1.11mi |
| 237 W 1020 S #3 Provo, UT | 3.0 | 2.0 | 1000 | $2,000 | $2.00 | 14d | 1 | 1.16mi |
| 237 W 1020 S #3 Provo, UT | 3.0 | 2.0 | 1000 | $2,000 | $2.00 | 23d | 1 | 1.16mi |
| 1662 S 400 W Provo, UT | 3.0 | 2.0 | 1205 | $1,775 | $1.47 | 2d | 1 | 1.37mi |
| 364 N Seven Peaks Blvd #226 Provo, UT | 3.0 | 2.0 | 1224 | $620 | $0.51 | 21d | 1 | 1.50mi |
Listing history 19 events
-
2026-06-18days on market $125,000 Active 90 DOM
-
2026-06-17days on market $125,000 Active 89 DOM
-
2026-06-16days on market $125,000 Active 88 DOM
-
2026-06-15days on market $125,000 Active 87 DOM
-
2026-06-14days on market $125,000 Active 85 DOM
-
2026-06-10days on market $125,000 Active 82 DOM
-
2026-06-09days on market $125,000 Active 81 DOM
-
2026-06-08days on market $125,000 Active 80 DOM
-
2026-06-07days on market $125,000 Active 79 DOM
-
2026-06-03days on market $125,000 Active 75 DOM
-
2026-06-02days on market $125,000 Active 74 DOM
-
2026-06-01days on market $125,000 Active 73 DOM
-
2026-05-31days on market $125,000 Active 72 DOM
-
2026-05-31days on market $125,000 Active 71 DOM
-
2026-03-20$125,000 Active 37-char remark
Show marketing remark (37 chars)
Very easy to show. Cheaper than rent.
-
2026-01-28historical
-
2025-09-26price $140,000
-
2025-08-27price $155,000
-
2025-07-27$164,900 Active
ⓘ Source: listings_history table (triggers on properties + properties_extension) + one-shot
backfill from property_details.listing_events for pre-trigger history.
Nearby sold comps map
Loading sold comps map…
Walkable amenities ~0.75 mi
Loading nearby amenities…
Taxation est. · year 1
- Rental income
- $22,397
- − Mortgage interest
- −$7,002
- − Property taxes
- −$1,875
- − Insurance
- −$625
- − Repairs & maintenance
- −$1,792
- − Management
- −$1,792
- − Depreciation
- −$3,636
- Taxable income
- $5,675
- Est. tax owed @ 24.0%
- −$1,362
- After-tax cash flow
- $5,965/yr
For passive investors: Depreciation is non-cash, so a rental often shows a tax loss while cash-flowing — sheltering income. Rental losses are passive: they offset passive income freely, and up to $25,000/yr can offset ordinary (W-2) income if you actively participate and your MAGI is under $100k (phasing out to $0 by $150k); unused losses carry forward. On sale, claimed depreciation is recaptured at up to 25%, and gains may owe capital-gains tax (a 1031 exchange can defer both). Figures are a year-1 estimate at your 24.0% rate — not tax advice; consult a CPA.
Condition & rehab AI · 10 photos
This manufactured home is in good condition with cosmetic updates, ready for a new owner or renter.
Value-add opportunities
- Both Paint exterior siding — Enhances curb appeal and value.
- Both Replace carpet with hardwood flooring — Improves aesthetics and increases value.
- Both Install smart home devices — Enhances convenience and adds modern appeal.
Renovation cost estimate screening
Value-add ROI direction
- Both Paint exterior siding — Enhances curb appeal and value. ↑
- Both Replace carpet with hardwood flooring — Improves aesthetics and increases value. ↑
- Both Install smart home devices — Enhances convenience and adds modern appeal. ↑
ⓘ Cost ranges are severity-bucket heuristics (US national rule-of-thumb). Get contractor quotes + a written scope before underwriting a rehab budget.
Schools (NCES district)
- District
- Provo District
- NCES district ID
- 4900810
- Math proficiency
- 38% ▼ -10.00%
- Reading proficiency
- 46% ▼ -6.00%
- Median HH income
- $40,698
- Composite
- 35.24/100
- National rank
- #4980
- State rank
- #44 of 80 in UT
Livability — Provo
- Score
- 85/100
- State rank
- #15
- US rank
- #602
Category grades
Schools grade is shown separately in the Schools card above.
Census & demographics
- Census place
- Provo, UT
- County
- Utah County · 661,754 people
- City population
- 112,727
- Metro
- Provo-Orem, UT
- Population (ZIP)
- 35,690
- Household income
- $52,811
- Rent vs Own
- Severe rent burden
- 1982.0
Population outlook (Utah County) Hauer SSP2
- Today (2025)
- 693,420 people
- By 2030
- 757,324 · +9.2%
- By 2040
- 893,178 · +28.8%
- By 2050
- 1,035,842 · +49.4%
- By 2075
- 1,376,733 · +98.5%
- By 2100
- 1,609,388 · +132.1%
Race, ethnicity, and origin ACS 2023
- Neighborhood character
- Predominantly White (71%)
- Race & ethnicity
- White 71% Hispanic / Latino 16% Two or more races 12% Asian 2% Pacific Islander 1% Black 1%
- Hispanic origin (detail)
- Mexican 10% Puerto Rican 1%
- Common ancestry
- Italian 4% Slovak 4% Portuguese 2%
- Foreign-born
- 12% · Canada, South Korea, Jamaica
- Languages at home
- 72% English-only · Spanish 18% Other Indo-European 3% Other Asian/Pacific 2%
Political lean MEDSL · Utah
- 2024 margin
- Solid R (+39.8) · D 28.5% · R 68.3% · Other 3.2%
- 2008→2024 swing
- +19.1pp toward D · 2008: -58.9pp · 2024: -39.8pp
- All cycles
- 2024: R+39.8 2020: R+41.0 2016: R+37.3 2012: R+78.5 2008: R+58.9
Not yet ingested
- Civics
- —
Market trends
- HPI YoY
- ▼ -273.12%
- Current HPI
- 282.591
- Rent YoY
- ▲ 2.20%
- Metro
- Provo-Orem, UT
- State GDP YoY
- ▲ 3.54%
- F500 in state
- 2
Industry mix (Fortune 500 HQ in UT)
| Industry | F500 HQs | Revenue |
|---|---|---|
| Financial Services | 1 | $3B |
|
||
Price history
-24.2% since first listed5 events — show timeline
- 2026-03-20 Listed $125,000 WFRMLS
- 2026-01-28 Listing Removed — WFRMLS
- 2025-09-26 Price Changed $140,000 WFRMLS
- 2025-08-27 Price Changed $155,000 WFRMLS
- 2025-07-27 Listed $164,900 WFRMLS
Cash-flow waterfall
monthlySold comps — $/sqft
last 12 mo · ≤1 miLoading sold comps…