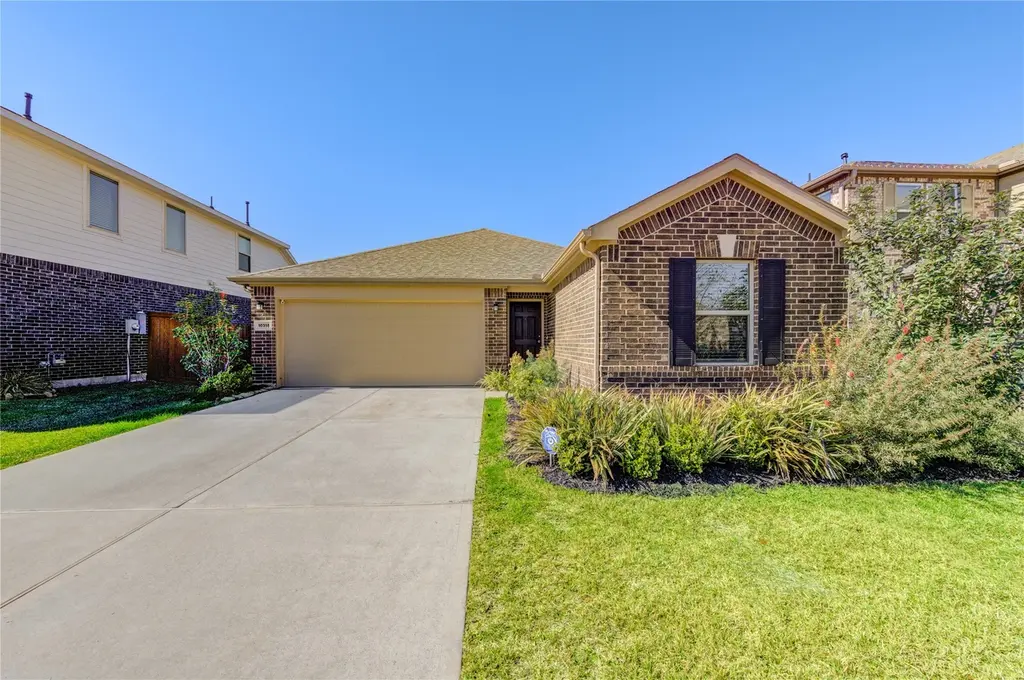
10314 Russell Pines Dr · Iowa Colony, TX
Flood risk 7/10 · Major
- FEMA flood zone
- X (unshaded)
- Chance of flooding over 30 yrs
- 0.99%
- Est. flood insurance / yr
- $507 – $1,088
Fire risk 6/10 · Moderate
- Est. fire insurance / yr
- $1,222 – $2,270
Heat risk 9/10 · Severe
- Hot days now (above 110°F)
- 7 days/yr
- Hot days in 30 yrs
- 23 days/yr
Wind risk 9/10 · Severe
- Chance of severe wind over 30 yrs
- 99.0%
Air-quality risk 2/10 · Minimal
- Unhealthy air days now
- 1 days/yr
- Unhealthy air days in 30 yrs
- 2 days/yr
Risk factors via First Street. Map © Google.
Why this score? — see what drove the D grade
The composite is a weighted blend of 9 inputs, each scored 0–100. Each bar is that input's sub-score; the figure is the points it added to the 100-point composite (weight × sub-score).
- ARV discount +11.4/15.0
- Cash flow +8.3/30.0
- 1% rule +4.9/10.0
- Condition / age +4.0/5.0
- Schools +3.9/10.0
- Livability +3.2/5.0
- Rent growth +2.6/5.0
- DSCR +2.3/10.0
- Appreciation +0.0/10.0
$275,000
🖨 Deal sheet 📄 Offer letter ✓ Due diligence
Listing remarks MLS
Step into comfort and style in this beautifully maintained single-story home in the desirable Sierra Vista community. Featuring 3 beds and 2 baths, this open-concept layout includes ceramic floors, and a light-filled design perfect for modern living. The kitchen shines with soft mat color cabinetry, quartz counters, farmhouse sink, stainless steel appliances (new microwave), and an oversized island ideal for entertaining. The spacious primary suite offers dual vanities, soaker tub, a walk-in shower. Enjoy upgrades like cover patio and in wall pest defense system. Fully fenced yard, ideal for relaxing or play. Smart home with wireless thermostat and garage. Sensor & touch kitchen faucet. Community perks include resort-style pools, fitness centers, pickleball, playgrounds, scenic trails, and more! With easy access to Hwy 288, commuting to Houston or the Medical Center is a breeze.
Key facts
- Quartz counters
- Dual vanities
- Ceramic floors
Tags
Neighborhood map
What this means for you Summary
Snapshot
- This is a 3-bed/2.0-bath single-family listed at $275k. Condition is rated good.
Deal economics
- At list price, monthly cash flow is $-318 ($-4k/yr) — negative.
- To cash-flow at today's rent, offer at most $219k (20.4% below list).
- To meet the 1% rule (rent ≥ 1% of price), the offer needs to be $273k (0.6% below list).
- Recommended offer: $219k (20.4% below list) — sets the bar for cash-flow.
- Cap rate 5.2% vs local median 4.2% in Iowa Colony — meaningfully above typical; check what's discounted (condition, days-on-market, listing class) to confirm the premium yield is real.
Location & tenants
- Location reads 64/100 on livability (#757 in TX) — a middle-class / working-renter tenant base. Strengths: crime A+, employment A+, cost of living A+; Watch: schools F, amenities F, commute F.
- Alvin ISD (suburban): math 39% / reading 48% proficiency, ranked #255 of 826 in TX (top 31%) — families likely to look elsewhere, expect single-tenant / working-renter base with shorter leases.
- Market conditions: Rents flat; 1139 active listings in the ZIP; 18 comparable units currently listed for rent nearby; rentals leasing fast (median 13d on market — plan ~1-2 weeks tenant-placement turnaround); high-income renter base; 3,960 units permitted in Brazoria County in 2024 (593 in 5+ unit buildings).
Forward outlook
- Local home prices are declining (-3.0%/yr); year-one equity from $2k of loan paydown is wiped out by about $8k of value loss. Plan a longer hold.
- Brazoria County population projected at +44% by 2050 — long-run rental-demand tailwind backs the buy-and-hold thesis.
Negotiation context
- It's been on market 131 days — a 12% lower offer ($242k) is reasonable based on typical stale-listing flexibility.
Risks & watch-outs
- Watch-outs: property tax is 3.3% of price; flood insurance adds $66/mo.
- Climate carrying-cost: major flood risk; severe wind risk, 99% chance of damaging wind over 30y; major wildfire risk; extreme-heat days projected 7→23/yr by 2055 (HVAC capex compounding) — expect insurance premiums to compound above CPI over the hold.
Questions for the listing agent
- What do current leases actually rent for vs. the listed asking? Can we see a recent rent roll and the last 12 months of T-12 income?
- It's been on market 131 days. Have you received any prior offers? Is the seller open to a 20% concession, seller financing, or rate buy-down credit?
- Property tax is high relative to price — has the assessment been appealed recently, and will the sale trigger a re-assessment?
- What's the actual annual flood-insurance premium (NFIP or private), and is the property in a SFHA with mandatory coverage?
- What does the HOA fee cover, when was the last increase, and are there any pending special assessments or reserve-fund shortfalls?
- Why hasn't it sold? Are there any deal-killer items the seller is aware of (foundation, flood, title, zoning, code violations)?
- Is there a deadline driving the sale (1031 exchange, divorce, estate, relocation)? That informs how much negotiation room exists.
- Schools are F-rated, which usually means shorter tenancies and higher turnover. Who's the typical renter profile here, and what's been the actual vacancy rate?
- The area grade is low — what's the realistic commute time and amenity access for the typical tenant pool here? Any planned neighborhood developments (good or bad) we should know about?
- What's the average days-on-market for RENTAL listings here right now (not sales)? A rising rental-DOM trend means longer vacancies and softer asking-rent achievability than the comps imply.
- What's the recent tenant-quality profile in this submarket — average credit score on applications, eviction rate, late-payment / NSF rate, and stable-employment percentage? A property-management company in the area should have these aggregated.
- How much new for-sale + rental construction is in the pipeline within 1–3 miles? Heavy new supply typically softens prices + rents 12–24 months out; constrained supply supports both.
Investment metrics
- 1% rule
- 0.99% ✗
- Cap rate
- 5.20%
- Cash-on-cash
- -3.92%
- DSCR
- 0.83
- GRM
- 8.4
CMA / ARV
- ARV (median comp)
- $301,383
- List price
- $275,000
- Delta
- -8.75%
- Verdict
- FAIR
- Comps
- 20 within 1.0 mi
Show comp detail 12 sales within ~0.75 mi
| Address | Dist | Beds/Ba | Sqft | Sold | Price | $/sf | Match |
|---|---|---|---|---|---|---|---|
| 1614 Diamond Mountain Dr | 0.12mi | 3/2.0 | 1,710 (+4%) | 1mo | $265,000 | $155 | 87 |
| 10510 Watershed Dr | 0.27mi | 3/2.0 | 1,641 (-1%) | 1mo | $258,000 | $157 | 86 |
| 1814 Homewood Point Ln | 0.45mi | 3/2.0 | 1,635 (-1%) | 3mo | $319,990 | $196 | 75 |
| 1202 Paradise Found Dr | 0.47mi | 3/2.0 | 1,581 (-4%) | 1mo | $265,000 | $168 | 70 |
| 2107 Tioga View Dr | 0.60mi | 3/2.0 | 1,662 (+1%) | 1mo | $359,900 | $217 | 70 |
| 1213 Red Hills Dr | 0.38mi | 4/2.0 (+1) | 1,582 (-4%) | 3mo | $299,900 | $190 | 68 |
| 2119 Tioga View Dr | 0.64mi | 3/2.0 | 1,662 (+1%) | 3mo | $359,900 | $217 | 67 |
| 9930 Opal Rock Dr | 0.73mi | 3/2.5 | 1,659 (+0%) | 1mo | $235,000 | $142 | 62 |
| 10518 Sutter Creek Dr | 0.48mi | 3/2.0 | 1,852 (+12%) | 3mo | $354,900 | $192 | 55 |
| 10618 Sutter Creek Dr | 0.54mi | 3/2.0 | 1,872 (+13%) | 2mo | $408,900 | $218 | 51 |
| 1910 Temple Grove Dr | 0.70mi | 3/2.0 | 1,837 (+11%) | 0mo | $368,990 | $201 | 49 |
| 9438 Sky Blue Dr | 0.72mi | 3/2.0 | 1,414 (-14%) | 3mo | $229,000 | $162 | 40 |
Match score weights: distance 35% · size 25% · config 20% · recency 20%. Top-matched comps best support the ARV.
Projected returns pro-forma
-3.0% appreciation · 0.44% rent growth · sell at horizon
- IRR
- -28.5%
- Equity multiple
- 0.07×
- Total profit
- $-71,286
- Equity at exit
- $41,003
- IRR
- -48.6%
- Equity multiple
- -0.47×
- Total profit
- $-113,307
- Equity at exit
- $23,777
Cash invested: $77,000 (down + closing). Projections, not guarantees.
Landlord ↔ Tenant lean methodology
- Overall (STATE)
- 87 Strongly Landlord-Friendly
- State Texas
- 87 Strongly Landlord-Friendly · R+5
- County
- — inherits STATE
- City
- — inherits STATE
ZIP-level market 77583
- Rents YoY
- 0.4%
- Active inventory
- 1139
- Price-to-rent
- 8.4×
Monthly cashflow live
- Estimated rent
- $2,733 high interval (Pro) →
- Mortgage (P&I)
- −$1,442
- Tax from tax record
- −$758 /mo · $9,091/yr
- Insurance
- −$115
- Flood insurance flood zone
- −$66 /mo · $798/yr
- HOA
- −$96
- Vacancy / Maint / Mgmt
- −$574
- Net cashflow
- $-318
Break-even live
UW: 25.0% down · 7.5% · 30yr · 1.5% tax · 5.0% vac · 8.0% maint · 8.0% mgmt
Financing live
Cash to close
- Down payment
- $68,750
- Closing costs
- $8,250
- Reserves months
- —
- Total cash needed
- —
Loan-product check · same deal, 3 products live
Conventional
25% down · 7.5% · 30yr
- Down + closing
- —
- Monthly P&I
- —
- Monthly cashflow
- —
- DSCR
- —
- Eligible?
- —
Personal DTI + credit; lowest rate.
DSCR
20% down · 8.5% · 30yr
- Down + closing
- —
- Monthly P&I
- —
- Monthly cashflow
- —
- DSCR
- —
- Eligible?
- —
No personal income docs; deal must DSCR.
Hard money
10% down · 12.0% · 12mo
- Down + closing
- —
- Monthly P&I
- —
- Monthly cashflow
- —
- DSCR
- —
- Eligible?
- —
Short-term bridge; refi at stabilization.
Rent comps 18 comps
| Address | Beds | Baths | Sqft | Rent | $/sqft | DOM | Units | Dist |
|---|---|---|---|---|---|---|---|---|
| 10610 Cascade Creek Dr Rosharon, TX | 3.0 | 2.0 | 1548 | $2,700 | $1.74 | 43d | 1 | 0.33mi |
| 10313 Malta Trace Dr Rosharon, TX | 4.0 | 2.0 | 1802 | $2,545 | $1.41 | 43d | 1 | 0.36mi |
| 10622 Cascade Creek Dr Rosharon, TX | 4.0 | 2.0 | 1780 | $2,775 | $1.56 | 43d | 1 | 0.36mi |
| 10507 Moon Valley Ln Rosharon, TX | 3.0 | 2.0 | 1548 | $2,650 | $1.71 | 1d | 1 | 0.38mi |
| 10630 Cascade Creek Dr Rosharon, TX | 3.0 | 2.5 | 1940 | $2,875 | $1.48 | 2d | 1 | 0.38mi |
| 10502 Moon Valley Ln Rosharon, TX | 3.0 | 2.0 | 1615 | $2,725 | $1.69 | 1d | 1 | 0.40mi |
| 1234 Scarlet Creek Dr Rosharon, TX | 3.0 | 2.0 | 1548 | $2,650 | $1.71 | 1d | 1 | 0.47mi |
| 1816 Corsica Creek Ln Rosharon, TX | 3.0–4.0 | 2.0–2.5 | 1653 | $2,306 | $1.40 | 1d | 21 | 0.47mi |
| 1403 Cascade Hills Dr Rosharon, TX | 4.0 | 3.0 | 2067 | $3,450 | $1.67 | 7d | 1 | 0.48mi |
| 10538 Wildflower View Dr Rosharon, TX | 3.0 | 2.0 | 1522 | $2,775 | $1.82 | 1d | 1 | 0.49mi |
| 10602 Wildflower View Dr Rosharon, TX | 4.0 | 2.0 | 1596 | $2,850 | $1.79 | 20d | 1 | 0.50mi |
| 10714 Cliffs View Dr Iowa Colony, TX | 4.0 | 3.5 | 2070 | $2,700 | $1.30 | 43d | 1 | 0.57mi |
| 9423 Grand Spark Dr Rosharon, TX | 3.0 | 3.0 | 1999 | $2,600 | $1.30 | 43d | 1 | 0.75mi |
| 10211 Alpine Lake Ln Rosharon, TX | 3.0–4.0 | 2.0–2.5 | 1731 | $2,700 | $1.56 | 1d | 6 | 0.82mi |
| 10211 Alpine Lake Ln Rosharon, TX | 3.0–4.0 | 2.0–2.5 | 1731 | $2,469 | $1.43 | 43d | 7 | 0.82mi |
| 1123 Diamond Drape Dr Rosharon, TX | 4.0 | 2.0 | 1844 | $2,000 | $1.08 | 12d | 1 | 0.85mi |
| 9518 Peridot Green Dr Rosharon, TX | 4.0 | 2.0 | 1593 | $1,886 | $1.18 | 22d | 1 | 1.08mi |
| 10203 Karsten Blvd Rosharon, TX | 1.0–2.0 | 1.0–2.0 | 935 | $2,061 | $2.20 | 1d | 138 | 1.31mi |
HOA detail
- Monthly dues
- $96 · $1,152/yr
- Likely covers
- landscapingpoolgym
Listing history 17 events
-
2026-06-18days on market $275,000 Active 131 DOM
-
2026-06-17days on market $275,000 Active 130 DOM
-
2026-06-16days on market $275,000 Active 129 DOM
-
2026-06-15days on market $275,000 Active 128 DOM
-
2026-06-13days on market $275,000 Active 126 DOM
-
2026-06-13days on market $275,000 Active 125 DOM
-
2026-06-09days on market $275,000 Active 122 DOM
-
2026-06-08days on market $275,000 Active 121 DOM
-
2026-06-07days on market $275,000 Active 120 DOM
-
2026-06-04days on market $275,000 Active 117 DOM
-
2026-06-03days on market $275,000 Active 116 DOM
-
2026-06-02days on market $275,000 Active 115 DOM
-
2026-06-01days on market $275,000 Active 114 DOM
-
2026-05-31days on market $275,000 Active 113 DOM
-
2026-05-07price $275,000 895-char remark
Show marketing remark (895 chars)
Step into comfort and style in this beautifully maintained single-story home in the desirable Sierra Vista community. Featuring 3 beds and 2 baths, this open-concept layout includes ceramic floors, and a light-filled design perfect for modern living. The kitchen shines with soft mat color cabinetry, quartz counters, farmhouse sink, stainless steel appliances (new microwave), and an oversized island ideal for entertaining. The spacious primary suite offers dual vanities, soaker tub, a walk-in shower. Enjoy upgrades like cover patio and in wall pest defense system. Fully fenced yard, ideal for relaxing or play. Smart home with wireless thermostat and garage. Sensor & touch kitchen faucet. Community perks include resort-style pools, fitness centers, pickleball, playgrounds, scenic trails, and more! With easy access to Hwy 288, commuting to Houston or the Medical Center is a breeze.
-
2026-04-19price $285,000 895-char remark
Show marketing remark (895 chars)
Step into comfort and style in this beautifully maintained single-story home in the desirable Sierra Vista community. Featuring 3 beds and 2 baths, this open-concept layout includes ceramic floors, and a light-filled design perfect for modern living. The kitchen shines with soft mat color cabinetry, quartz counters, farmhouse sink, stainless steel appliances (new microwave), and an oversized island ideal for entertaining. The spacious primary suite offers dual vanities, soaker tub, a walk-in shower. Enjoy upgrades like cover patio and in wall pest defense system. Fully fenced yard, ideal for relaxing or play. Smart home with wireless thermostat and garage. Sensor & touch kitchen faucet. Community perks include resort-style pools, fitness centers, pickleball, playgrounds, scenic trails, and more! With easy access to Hwy 288, commuting to Houston or the Medical Center is a breeze.
-
2026-02-07$290,000 Active 895-char remark
Show marketing remark (895 chars)
Step into comfort and style in this beautifully maintained single-story home in the desirable Sierra Vista community. Featuring 3 beds and 2 baths, this open-concept layout includes ceramic floors, and a light-filled design perfect for modern living. The kitchen shines with soft mat color cabinetry, quartz counters, farmhouse sink, stainless steel appliances (new microwave), and an oversized island ideal for entertaining. The spacious primary suite offers dual vanities, soaker tub, a walk-in shower. Enjoy upgrades like cover patio and in wall pest defense system. Fully fenced yard, ideal for relaxing or play. Smart home with wireless thermostat and garage. Sensor & touch kitchen faucet. Community perks include resort-style pools, fitness centers, pickleball, playgrounds, scenic trails, and more! With easy access to Hwy 288, commuting to Houston or the Medical Center is a breeze.
ⓘ Source: listings_history table (triggers on properties + properties_extension) + one-shot
backfill from property_details.listing_events for pre-trigger history.
Tax reassessment forecast TX · Resets to sale price
- Current annual tax
- $9,091 · $758/mo
- Projected year-2 tax
- $9,091 · $758/mo
- Expected delta
- $0/yr ($0/mo · 0.0%)
ⓘ Screening estimate from a state-policy table — verify with the county assessor before closing.
Climate risk First Street
- Flood 7/10 Severe FEMA zone X (unshaded) · 99% chance over 30 yrs
- Wildfire 6/10 Major
- Heat 9/10 Extreme 7 d/yr ≥110°F today · 23 d/yr by 30 yrs out
- Wind 9/10 Extreme 99% chance of damaging wind over 30 yrs
- Air quality 2/10 Low 1 unhealthy d/yr today · 2 by 30 yrs out
Nearby sold comps map
Loading sold comps map…
Walkable amenities ~0.75 mi
Loading nearby amenities…
Taxation est. · year 1
- Rental income
- $32,791
- − Mortgage interest
- −$15,404
- − Property taxes
- −$9,091
- − Insurance
- −$2,172
- − Repairs & maintenance
- −$2,623
- − Management
- −$2,623
- − HOA
- −$1,152
- − Depreciation
- −$8,000
- Taxable loss
- −$8,276
- Est. tax savings @ 24.0%
- +$1,986
- After-tax cash flow
- $-1,830/yr
For passive investors: Depreciation is non-cash, so a rental often shows a tax loss while cash-flowing — sheltering income. Rental losses are passive: they offset passive income freely, and up to $25,000/yr can offset ordinary (W-2) income if you actively participate and your MAGI is under $100k (phasing out to $0 by $150k); unused losses carry forward. On sale, claimed depreciation is recaptured at up to 25%, and gains may owe capital-gains tax (a 1031 exchange can defer both). Figures are a year-1 estimate at your 24.0% rate — not tax advice; consult a CPA.
Condition & rehab AI · 12 photos
This single-story home in Sierra Vista is in good condition with modern updates and a well-maintained exterior. It's ready for a fresh coat of paint and some landscaping to maximize its value.
Value-add opportunities
- Resale paint exterior — enhances curb appeal
- Resale paint interior — enhances interior appeal
- Both landscaping — improves curb appeal and enhances property value
Renovation cost estimate screening
Value-add ROI direction
- Resale paint exterior — enhances curb appeal ↑
- Resale paint interior — enhances interior appeal ↑
- Both landscaping — improves curb appeal and enhances property value ↑
ⓘ Cost ranges are severity-bucket heuristics (US national rule-of-thumb). Get contractor quotes + a written scope before underwriting a rehab budget.
Schools (NCES district)
- District
- Alvin ISD
- NCES district ID
- 4808090
- Math proficiency
- 39% ▼ -11.00%
- Reading proficiency
- 48% ▬ 0.00%
- Median HH income
- $66,740
- Composite
- 38.96/100
- National rank
- #4080
- State rank
- #255 of 826 in TX
Livability — Iowa Colony
- Score
- 64/100
- State rank
- #757
- US rank
- #13904
Category grades
Schools grade is shown separately in the Schools card above.
Census & demographics
- County
- Brazoria County · 374,982 people
- City population
- 52,747
- Metro
- Houston-The Woodlands-Sugar Land, TX
- Population (ZIP)
- 52,747
- Household income
- $119,287
- Rent vs Own
- Severe rent burden
- 251.0
Population outlook (Brazoria County) Hauer SSP2
- Today (2025)
- 420,414 people
- By 2030
- 457,585 · +8.8%
- By 2040
- 532,232 · +26.6%
- By 2050
- 605,399 · +44.0%
- By 2075
- 779,358 · +85.4%
- By 2100
- 883,759 · +110.2%
Race, ethnicity, and origin ACS 2023
- Neighborhood character
- Highly diverse neighborhood (Simpson 0.70)
- Race & ethnicity
- Hispanic / Latino 38% Black 34% White 20% Two or more races 18% Asian 5%
- Hispanic origin (detail)
- Mexican 31% Puerto Rican 2%
- Common ancestry
- Lithuanian 1% Slovak 1% Romanian 1%
- Foreign-born
- 16% · Canada, Vietnam, China
- Languages at home
- 64% English-only · Spanish 28% Other Asian/Pacific 2% Vietnamese 1%
Political lean MEDSL · Brazoria
- 2024 margin
- R (+19.7) · D 39.5% · R 59.2% · Other 1.3%
- 2008→2024 swing
- +9.9pp toward D · 2008: -29.6pp · 2024: -19.7pp
- All cycles
- 2024: R+19.7 2020: R+18.2 2016: R+24.6 2012: R+34.2 2008: R+29.6
Not yet ingested
- Civics
- —
Market trends
- HPI YoY
- ▼ -120.19%
- Current HPI
- 198.6559
- Rent YoY
- ▲ 0.44%
- Metro
- Houston-The Woodlands-Sugar Land, TX
- State GDP YoY
- ▲ 3.95%
- F500 in state
- 110
Industry mix (Fortune 500 HQ in TX)
| Industry | F500 HQs | Revenue |
|---|---|---|
| Energy | 16 | $1,198B |
|
||
| Technology | 5 | $198B |
|
||
| Engineering / Construction | 4 | $72B |
|
||
| Energy Services | 3 | $60B |
|
||
| Utilities | 3 | $41B |
|
||
| Healthcare | 2 | $330B |
|
||
Price history
-5.2% since first listed3 events — show timeline
- 2026-05-07 Price Changed $275,000 HARMLS
- 2026-04-19 Price Changed $285,000 HARMLS
- 2026-02-07 Listed $290,000 HARMLS
Property tax history
+91.6%/yrLatest (2025): $9,091 · -0.4% YoY. Source: county tax records.
Cash-flow waterfall
monthlySold comps — $/sqft
last 12 mo · ≤1 miLoading sold comps…