 5-Plex
12819 Dixie Hwy · Louisville/Jefferson County metro government (balance), KY
Flood risk 6/10 · Moderate
- FEMA flood zone
- X
- Chance of flooding over 30 yrs
- 0.71%
- Est. flood insurance / yr
- $507 – $1,088
Fire risk 4/10 · Minor
- Est. fire insurance / yr
- $839 – $1,559
Heat risk 5/10 · Moderate
- Hot days now (above 104°F)
- 7 days/yr
- Hot days in 30 yrs
- 19 days/yr
Wind risk 2/10 · Minimal
- Chance of severe wind over 30 yrs
- 2.0%
Air-quality risk 3/10 · Minor
- Unhealthy air days now
- 2 days/yr
- Unhealthy air days in 30 yrs
- 3 days/yr
Risk factors via First Street. Map © Google.
Why this score? — see what drove the B- grade
The composite is a weighted blend of 9 inputs, each scored 0–100. Each bar is that input's sub-score; the figure is the points it added to the 100-point composite (weight × sub-score).
- Cash flow +30.0/30.0
- 1% rule +10.0/10.0
- DSCR +10.0/10.0
- ARV discount +7.5/15.0
- Rent growth +3.0/5.0
- Livability +2.5/5.0
- Condition / age +2.5/5.0
- Schools +2.3/10.0
- Appreciation +0.0/10.0
$295,000
🖨 Deal sheet (PDF) 📄 Offer letter ✓ Due diligence
Multi-family units
County records classify this as Multi-Family (5+ Unit). Listing-text estimate: 5 units. confirmed
5+ unit building — per-unit beds/baths from public records are typically unavailable; the breakdown below (if shown) is an estimate from the listing text.
Listing remarks
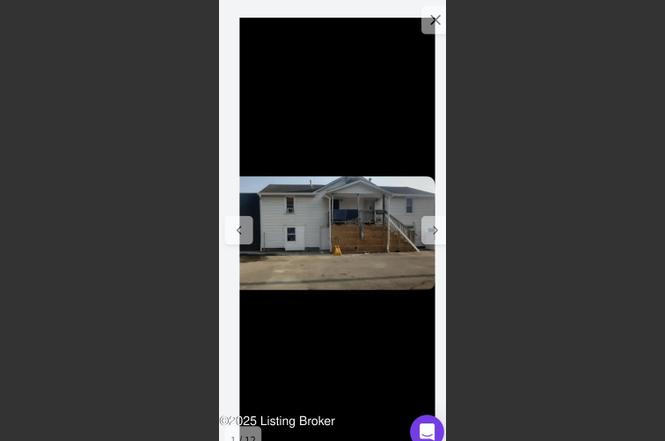
Fully leased 5 plex south of the Gene Snyder Freeway on Dixie Highway. Great opportunity to own a 5 unit investment property on Dixie Highway. This building offers five, one bedroom and one bathroom apartments. These units are currently leased month to month, at $700.00 per month 3 units, 2 units $600per unit. This building is super convenient to both Metro Louisville, and the Ft. Knox area. This neighborhood boasts great access to dining, shopping and the Interstate. Don't miss this opportunity to add this great investment property to your portfolio!
Key facts
- Access to shopping
- Access to dining
- 8 parking spots
Tags
Property features AI
Finance
- Other: Property reported as multi-unit: three units on the 1st level and two units on the 2nd level (total units indicated: 5); Building area source: Other
- HOA & community: No association fee
Exterior
- Parking: 8 parking spaces (not covered)
- Utilities: Electricity connected
- Home design: Bungalow-style apartment; Total building area approximately 2,968; Not located in a flood plain
- Construction: Aluminum siding; Asphalt roof; Year built listed as 1111
- Exterior features: Balcony
Interior
- Kitchen: Kitchen on 1st level; Kitchen on 2nd level
- Bedrooms: Total of 2 bedrooms (1 on the 1st level, 1 on the 2nd level)
- Bathrooms: Full baths: 1 on the 1st level, 1 on the 2nd level
- Heating & cooling: Five furnaces
- Interior features: Balcony
- Laundry & utility: No basement
Neighborhood map
What this means for you Summary
Snapshot
- This is a 5 × 1-bed/1.0-bath units multifamily listed at $295k.
Deal economics
- At list price, monthly cash flow is $2k ($27k/yr) — positive. Per door: $447/mo.
- The deal already cash-flows at list — no discount required.
- Meets the 1% rule at list price ($5k rent vs $295k).
- Recommended offer: $260k (12.0% below list) — sets the bar for market timing.
- Cap rate 15.4% vs local median 4.0% in Louisville/Jefferson County metro government (balance) — top-decile yield for the area; either an underpriced asset or a hidden risk that comps aren't pricing in. Stress-test before assuming the spread holds.
Location & tenants
- Location reads: area grade B — affects rentability + tenant quality, not the cash-flow math above.
- Jefferson County (urban): math 19% / reading 35% proficiency, ranked #121 of 165 in KY (top 73%) — low school quality limits family demand, transient renter base, plan for 1-2y turnover.
- Market conditions: Rents rising (+2.1%/yr); 217 active listings in the ZIP; 2,836 units permitted in Jefferson County in 2024 (1,558 in 5+ unit buildings).
- At $5,054/mo this rent would consume 87% of the median local household income ($70k/yr) (locally 702% of renters already pay >50% of income on rent) — very limited rent-growth headroom before tenants either downsize or default.
Forward outlook
- Local home prices are declining (-3.0%/yr); year-one equity from $2k of loan paydown is wiped out by about $9k of value loss. Plan a longer hold.
- Jefferson County population projected at +13% by 2050 — modest demand growth; plan on rents tracking national, not racing it.
- At projected returns (-3.0% appreciation + 2.1% rent growth), your $83k cash investment doubles in ~4 years — after that, you're playing with house money.
Negotiation context
- It's been on market 272 days — a 12% lower offer ($260k) is reasonable based on typical stale-listing flexibility.
- 3 sale attempts since 14y ago with the ask held roughly flat each time — persistent listings suggest the price (not the market) is what's stuck; bring a comps-based counter.
- Current owner paid $95k; list at $295k implies a 212% gain — meaningful room to come down on a strong offer.
Risks & watch-outs
- Watch-outs: built in 1111 — expect roof / HVAC / electrical / plumbing capex.
- Climate carrying-cost: major flood risk; extreme-heat days projected 7→19/yr by 2055 (HVAC capex compounding) — expect insurance premiums to compound above CPI over the hold.
Questions for the listing agent
- It's been on market 272 days. Have you received any prior offers? Is the seller open to a 12% concession, seller financing, or rate buy-down credit?
- Can we see the unit-by-unit rent roll, current vacancy, and any below-market leases? What's the average tenancy length?
- What capital expenditures (roof, boiler, parking lot, exteriors) have been made in the last 5 years, and what's planned in the next 2?
- Built in 1111 — when were the roof, HVAC, electrical panel, plumbing, and water heater last replaced?
- Why hasn't it sold? Are there any deal-killer items the seller is aware of (foundation, flood, title, zoning, code violations)?
- Is there a deadline driving the sale (1031 exchange, divorce, estate, relocation)? That informs how much negotiation room exists.
- What's the average days-on-market for RENTAL listings here right now (not sales)? A rising rental-DOM trend means longer vacancies and softer asking-rent achievability than the comps imply.
- What's the recent tenant-quality profile in this submarket — average credit score on applications, eviction rate, late-payment / NSF rate, and stable-employment percentage? A property-management company in the area should have these aggregated.
- How much new apartment / multifamily construction is in the pipeline within 1–3 miles? Heavy new supply (>2% of stock underway) typically softens rents 12–24 months out; light construction supports rent growth.
Investment metrics
- 1% rule
- 1.71% ✓
- Cap rate
- 15.38%
- Cash-on-cash
- 32.44%
- DSCR
- 2.44
- GRM
- 4.9
CMA / ARV
No comps found within radius.
Projected returns pro-forma
-3.0% appreciation · 2.07% rent growth · sell at horizon
- IRR
- 26.5%
- Equity multiple
- 2.09×
- Total profit
- $89,626
- Equity at exit
- $43,985
- IRR
- 33.6%
- Equity multiple
- 3.93×
- Total profit
- $241,904
- Equity at exit
- $25,506
Cash invested: $82,600 (down + closing). Projections, not guarantees.
Landlord ↔ Tenant lean methodology
- Overall (STATE)
- 83 Strongly Landlord-Friendly
- State Kentucky
- 83 Strongly Landlord-Friendly · R+16
- County
- — inherits STATE
- City
- — inherits STATE
ZIP-level market 40272
- Rents YoY
- 2.1%
- Active inventory
- 217
- Price-to-rent
- 24.3×
Monthly cashflow live
- Estimated rent
- $5,054 medium interval (Pro) →
- Mortgage (P&I)
- −$1,547
- Tax from tax record
- −$90 /mo · $1,079/yr
- Insurance
- −$123
- HOA
- −$0
- Vacancy / Maint / Mgmt
- −$1,061
- Net cashflow
- $2,233
Break-even live
Sensitivity live
| Price | -10% $2,400 | -5% $2,316 | +0% $2,233 | +5% $2,149 | +10% $2,066 |
|---|---|---|---|---|---|
| Rent | -10% $1,834 | -5% $2,033 | +0% $2,233 | +5% $2,432 | +10% $2,632 |
| Rate | -1.0pp $2,381 | -0.5pp $2,308 | base $2,233 | +0.5pp $2,156 | +1.0pp $2,079 |
5-unit breakdown (identical units grouped — click to expand)
| Units | Beds | Baths | Est. rent |
|---|---|---|---|
| 5× units | 1 | 1 | $5,055 |
| #1 | 1 | 1 | $1,011 |
| #2 | 1 | 1 | $1,011 |
| #3 | 1 | 1 | $1,011 |
| #4 | 1 | 1 | $1,011 |
| #5 | 1 | 1 | $1,011 |
| Total (5 units) | $5,054 | ||
UW: 25.0% down · 7.5% · 30yr · 1.5% tax · 5.0% vac · 8.0% maint · 8.0% mgmt
Financing live
Cash to close
- Down payment
- $73,750
- Closing costs
- $8,850
- Reserves months
- —
- Total cash needed
- —
Loan-product check · same deal, 3 products live
Conventional
25% down · 7.5% · 30yr
- Down + closing
- —
- Monthly P&I
- —
- Monthly cashflow
- —
- DSCR
- —
- Eligible?
- —
Personal DTI + credit; lowest rate.
DSCR
20% down · 8.5% · 30yr
- Down + closing
- —
- Monthly P&I
- —
- Monthly cashflow
- —
- DSCR
- —
- Eligible?
- —
No personal income docs; deal must DSCR.
Hard money
10% down · 12.0% · 12mo
- Down + closing
- —
- Monthly P&I
- —
- Monthly cashflow
- —
- DSCR
- —
- Eligible?
- —
Short-term bridge; refi at stabilization.
Listing history 21 events
-
2026-06-21days on market $295,000 Active 272 DOM
-
2026-06-18days on market $295,000 Active 269 DOM
-
2026-06-17days on market $295,000 Active 268 DOM
-
2026-06-16days on market $295,000 Active 267 DOM
-
2026-06-15days on market $295,000 Active 266 DOM
-
2026-06-13days on market $295,000 Active 264 DOM
-
2026-06-10days on market $295,000 Active 261 DOM
-
2026-06-09days on market $295,000 Active 260 DOM
-
2026-06-08days on market $295,000 Active 259 DOM
-
2026-06-07days on market $295,000 Active 258 DOM
-
2026-06-03days on market $295,000 Active 254 DOM
-
2026-06-02days on market $295,000 Active 253 DOM
-
2026-06-01days on market $295,000 Active 252 DOM
-
2026-05-31days on market $295,000 Active 251 DOM
-
2025-09-02$295,000 Active
-
2024-09-25historical
-
2024-08-15$300,000 Active
-
2021-02-25soldstatus $94,557
-
2014-01-14soldstatus $17,000
-
2013-12-31historical
-
2012-07-24$38,999
ⓘ Source: listings_history table (triggers on properties + properties_extension) + one-shot
backfill from property_details.listing_events for pre-trigger history.
Tax reassessment forecast KY · Resets to sale price
- Current annual tax
- $1,079 · $90/mo
- Projected year-2 tax
- $2,537 · $211/mo
- Expected delta
- +$1,458/yr (+$122/mo · 135.1%)
ⓘ Screening estimate from a state-policy table — verify with the county assessor before closing.
Climate risk First Street
- Flood 6/10 Major FEMA zone X · 71% chance over 30 yrs
- Wildfire 4/10 Moderate
- Heat 5/10 Major 7 d/yr ≥104°F today · 19 d/yr by 30 yrs out
- Wind 2/10 Low 2% chance of damaging wind over 30 yrs
- Air quality 3/10 Moderate 2 unhealthy d/yr today · 3 by 30 yrs out
Nearby sold comps map
Loading sold comps map…
Walkable amenities ~0.75 mi
Loading nearby amenities…
Taxation est. · year 1
- Rental income
- $60,648
- − Mortgage interest
- −$16,525
- − Property taxes
- −$1,079
- − Insurance
- −$1,475
- − Repairs & maintenance
- −$4,852
- − Management
- −$4,852
- − Depreciation
- −$8,582
- Taxable income
- $23,284
- Est. tax owed @ 24.0%
- −$5,588
- After-tax cash flow
- $21,206/yr
For passive investors: Depreciation is non-cash, so a rental often shows a tax loss while cash-flowing — sheltering income. Rental losses are passive: they offset passive income freely, and up to $25,000/yr can offset ordinary (W-2) income if you actively participate and your MAGI is under $100k (phasing out to $0 by $150k); unused losses carry forward. On sale, claimed depreciation is recaptured at up to 25%, and gains may owe capital-gains tax (a 1031 exchange can defer both). Figures are a year-1 estimate at your 24.0% rate — not tax advice; consult a CPA.
Schools (NCES district)
- District
- Jefferson County
- NCES district ID
- 2102990
- Math proficiency
- 19% ▼ -17.00%
- Reading proficiency
- 35% ▼ -11.00%
- Median HH income
- $47,885
- Composite
- 23.45/100
- National rank
- #7884
- State rank
- #121 of 165 in KY
Livability — Louisville/Jefferson County metro government (balance)
No livability data for this city. (Only ~50 U.S. cities are tracked.)
Census & demographics
- Census place
- Louisville/Jefferson County metro government (balance), KY
- County
- Jefferson County · 790,184 people
- City population
- 419,741
- Metro
- Louisville/Jefferson County, KY-IN
- Population (ZIP)
- 38,289
- Household income
- $69,940
- Rent vs Own
- Severe rent burden
- 702.0
Population outlook (Jefferson County) Hauer SSP2
- Today (2025)
- 823,112 people
- By 2030
- 849,343 · +3.2%
- By 2040
- 895,696 · +8.8%
- By 2050
- 933,630 · +13.4%
- By 2075
- 1,028,262 · +24.9%
- By 2100
- 1,072,675 · +30.3%
Race, ethnicity, and origin ACS 2023
- Neighborhood character
- Predominantly White (77%)
- Race & ethnicity
- White 77% Black 9% Hispanic / Latino 9% Two or more races 9%
- Hispanic origin (detail)
- Mexican 3% Cuban 3%
- Common ancestry
- Slovak 2% Lithuanian 1% Italian 1%
- Foreign-born
- 6% · Canada
- Languages at home
- 92% English-only · Spanish 7%
Political lean MEDSL · Jefferson
- 2024 margin
- D (+16.6) · D 57.4% · R 40.9% · Other 1.7%
- 2008→2024 swing
- +4.5pp toward D · 2008: 12.0pp · 2024: 16.6pp
- All cycles
- 2024: D+16.6 2020: D+20.1 2016: D+13.3 2012: D+11.1 2008: D+12.0
Not yet ingested
- Civics
- —
Market trends
- HPI YoY
- ▼ -262.10%
- Current HPI
- 247.2954
- Rent YoY
- ▲ 2.07%
- Metro
- Louisville/Jefferson County, KY-IN
- State GDP YoY
- ▲ 1.81%
- F500 in state
- 4
Industry mix (Fortune 500 HQ in KY)
| Industry | F500 HQs | Revenue |
|---|---|---|
| Healthcare | 1 | $118B |
|
||
| Food / Beverage | 1 | $7B |
|
||
Price history
+656.4% since first listed7 events — show timeline
- 2025-09-02 Listed $295,000 Metro Search MLS
- 2024-09-25 Listing Removed — Metro Search MLS
- 2024-08-15 Listed $300,000 Metro Search MLS
- 2021-02-25 Sold (Public Records) $94,557 Public Records
- 2014-01-14 Sold (Public Records) $17,000 Public Records
- 2013-12-31 Listing Removed — Metro Search MLS
- 2012-07-24 Listed $38,999 Metro Search MLS
Property tax history
+4.0%/yrLatest (2025): $1,079 · -2.1% YoY. Source: county tax records.
Cash-flow waterfall
monthlySold comps — $/sqft
last 12 mo · ≤1 miLoading sold comps…