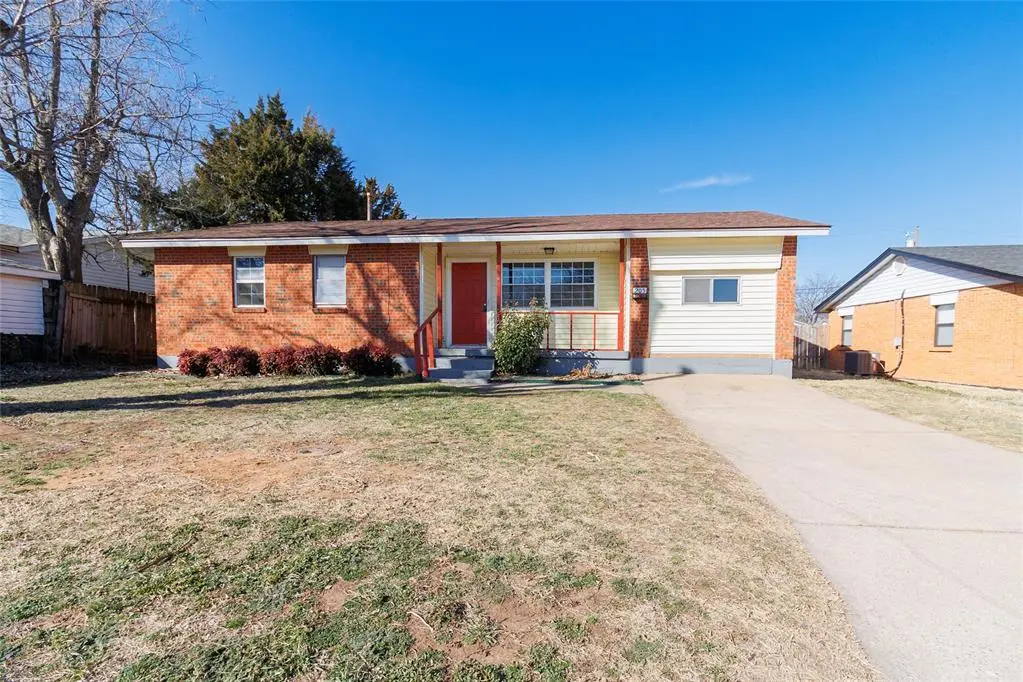
205 Oak St · Elgin, OK
Flood risk 1/10 · Minimal
- FEMA flood zone
- X (unshaded)
- Chance of flooding over 30 yrs
- 0.0%
- Est. flood insurance / yr
- $507 – $1,088
Fire risk 8/10 · Major
- Est. fire insurance / yr
- $2,463 – $4,575
Heat risk 6/10 · Moderate
- Hot days now (above 108°F)
- 7 days/yr
- Hot days in 30 yrs
- 19 days/yr
Wind risk 2/10 · Minimal
- Chance of severe wind over 30 yrs
- 4.0%
Air-quality risk 1/10 · Minimal
- Unhealthy air days now
- 0 days/yr
- Unhealthy air days in 30 yrs
- 0 days/yr
Risk factors via First Street. Map © Google.
Why this score? — see what drove the B grade
The composite is a weighted blend of 9 inputs, each scored 0–100. Each bar is that input's sub-score; the figure is the points it added to the 100-point composite (weight × sub-score).
- Cash flow +23.9/30.0
- ARV discount +15.0/15.0
- Appreciation +10.0/10.0
- DSCR +7.7/10.0
- 1% rule +5.8/10.0
- Livability +3.7/5.0
- Schools +3.0/10.0
- Rent growth +2.5/5.0
- Condition / age +2.5/5.0
$184,900
🖨 Deal sheet (PDF) 📄 Offer letter ✓ Due diligence
Listing remarks MLS
Nicely updated 4 bed, 1 3/4 bath, located in the heart of Elgin and within walking distance to the school. Updates include flooring, paint, light fixtures, carpet, and updated bathrooms. Roof is only 2yrs old. This home has an extra large living room and a formal dining space with lots cabinetry. Outback is a nice concrete patio and a large shop with electricity. Come see today! * Third-party automated valuations don't account for the added square footage and the shop.
Key facts
- Fresh paint
- Renovated bathrooms
- New flooring
Tags
Property features AI
Finance
- Other: Lot size approximately 0.1791 acres
- Financial info: Listing accepts Cash, Conventional, FHA or VA; Not assumable
- HOA & community: No mandatory association dues
Exterior
- Utilities: Cable available; Electricity available; Natural gas available; High-speed internet available; Public utilities
- Home design: Single family residence; One story; Residential property; Existing property
- Construction: Brick and frame construction; Vinyl siding; Composition roof; Conventional foundation; Built prior to current listing (existing)
- Exterior features: Covered porch; Workshop; Interior lot
Interior
- Kitchen: Gas range (freestanding); Gas oven (freestanding); Dishwasher; Refrigerator; Disposal
- Bedrooms: 4 bedrooms
- Flooring: Carpet; Laminate; Tile; Vinyl
- Bathrooms: 2 full bathrooms
- Interior features: Ceiling fans
- Laundry & utility: Inside utility; Water heater
Neighborhood map
What this means for you Summary
Snapshot
- This is a 4-bed/2.0-bath single-family listed at $185k.
Deal economics
- At list price, monthly cash flow is $360 ($4k/yr) — positive.
- The deal already cash-flows at list — no discount required.
- Meets the 1% rule at list price ($2k rent vs $185k).
- Recommended offer: $179k (3.0% below list) — sets the bar for market timing.
- Cap rate 8.6% vs local median 5.1% in Elgin — top-decile yield for the area; either an underpriced asset or a hidden risk that comps aren't pricing in. Stress-test before assuming the spread holds.
Location & tenants
- Location reads 73/100 on livability (#17 in OK) — a middle-class / working-renter tenant base. Strengths: crime A+, housing A+, cost of living A; Watch: amenities F, commute F, health & safety F.
- Elgin (rural): math 29% / reading 36% proficiency, ranked #38 of 270 in OK (top 14%) — families likely to look elsewhere, expect single-tenant / working-renter base with shorter leases.
- Zoned schools: Elgin Es (math 36% / reading 33%, grade F, #168 of 845 statewide, top 24%, 945 students, 0% FRL); Elgin Hs (math 27% / reading 47%, grade F, #42 of 447 statewide, top 10%, 771 students, 0% FRL) — zoned schools average 0% FRL vs 29% district-wide (29 pts lower); this property's tenant base skews higher-income than the district average.
- Market conditions: 95 active listings in the ZIP; 6 comparable units currently listed for rent nearby; rentals at typical pace (median 25d on market — plan ~3-4 weeks tenant-placement turnaround); solid renter incomes; 133 units permitted in Comanche County in 2024 (0 in 5+ unit buildings).
Forward outlook
- In year one you build about $20k of equity ($1k loan paydown + $18k appreciation (10.0% local appreciation)).
- Comanche County population projected to shrink 3% by 2050 — rents likely to lag national; underwrite the cash flow, not the appreciation.
- At projected returns (10.0% appreciation + 3.0% rent growth), your $52k cash investment doubles in ~3 years — after that, you're playing with house money.
- By year 2, paydown + projected appreciation supports a ~$32k cash-out refi (75% LTV) — recoverable capital for the next deal without selling this one.
Negotiation context
- It's been on market 56 days — a 3% lower offer ($179k) is reasonable based on typical stale-listing flexibility.
- 5 sale attempts since 4y ago with the ask held roughly flat each time — persistent listings suggest the price (not the market) is what's stuck; bring a comps-based counter.
Risks & watch-outs
- Climate carrying-cost: severe wildfire risk; extreme-heat days projected 7→19/yr by 2055 (HVAC capex compounding) — expect insurance premiums to compound above CPI over the hold.
Questions for the listing agent
- It's been on market 56 days. Have you received any prior offers? Is the seller open to a 3% concession, seller financing, or rate buy-down credit?
- Built in 1964 — when were the roof, HVAC, electrical panel, plumbing, and water heater last replaced?
- Is there a deadline driving the sale (1031 exchange, divorce, estate, relocation)? That informs how much negotiation room exists.
- What's the average days-on-market for RENTAL listings here right now (not sales)? A rising rental-DOM trend means longer vacancies and softer asking-rent achievability than the comps imply.
- What's the recent tenant-quality profile in this submarket — average credit score on applications, eviction rate, late-payment / NSF rate, and stable-employment percentage? A property-management company in the area should have these aggregated.
- How much new for-sale + rental construction is in the pipeline within 1–3 miles? Heavy new supply typically softens prices + rents 12–24 months out; constrained supply supports both.
Investment metrics
- 1% rule
- 1.08% ✓
- Cap rate
- 8.63%
- Cash-on-cash
- 8.35%
- DSCR
- 1.37
- GRM
- 7.7
CMA / ARV
- ARV (on-the-fly)
- $243,507
- Comps found
- 12
Show comp detail 12 sales within ~0.75 mi
| Address | Dist | Beds/Ba | Sqft | Sold | Price | $/sf | Match |
|---|---|---|---|---|---|---|---|
| 1430 Limestone Way | 0.27mi | 4/2.0 | 1,564 (+1%) | 0mo | $245,000 | $157 | 86 |
| 1206 Hershel Dr | 0.18mi | 3/2.0 (-1) | 1,500 (-3%) | 0mo | $240,000 | $160 | 81 |
| 1405 NE Limestone Way | 0.32mi | 3/2.0 (-1) | 1,600 (+3%) | 7mo | $248,000 | $155 | 69 |
| 1404 Limestone Way | 0.34mi | 4/2.0 | 1,700 (+10%) | 2mo | $267,000 | $157 | 66 |
| 1408 Limestone Way | 0.35mi | 4/2.0 | 1,700 (+10%) | 6mo | $267,000 | $157 | 63 |
| 18 NE Summerwood Dr | 0.40mi | 4/2.0 | 1,700 (+10%) | 3mo | $255,000 | $150 | 63 |
| 33 Blue Mdw | 0.46mi | 4/2.0 | 1,700 (+10%) | 1mo | $255,000 | $150 | 62 |
| 508 2nd St | 0.45mi | 4/2.0 | 1,700 (+10%) | 2mo | $295,000 | $174 | 61 |
| 109 Sunny Ln | 0.49mi | 4/2.0 | 1,697 (+9%) | 4mo | $190,000 | $112 | 58 |
| 209 Glover Cir | 0.73mi | 3/2.0 (-1) | 1,500 (-3%) | 3mo | $220,000 | $147 | 53 |
| 718 5th St | 0.30mi | 3/2.0 (-1) | 1,344 (-13%) | 9mo | $226,000 | $168 | 51 |
| 220 Glover Cir | 0.74mi | 4/2.5 | 1,750 (+13%) | 2mo | $256,000 | $146 | 40 |
Match score weights: distance 35% · size 25% · config 20% · recency 20%. Top-matched comps best support the ARV.
Projected returns pro-forma
10.0% appreciation · 3.0% rent growth · sell at horizon
- IRR
- 30.4%
- Equity multiple
- 3.39×
- Total profit
- $123,628
- Equity at exit
- $166,573
- IRR
- 26.3%
- Equity multiple
- 7.68×
- Total profit
- $346,014
- Equity at exit
- $359,220
Cash invested: $51,772 (down + closing). Projections, not guarantees.
Landlord ↔ Tenant lean methodology
- Overall (STATE)
- 83 Strongly Landlord-Friendly
- State Oklahoma
- 83 Strongly Landlord-Friendly · R+20
- County
- — inherits STATE
- City
- — inherits STATE
ZIP-level market 73538
- Home prices YoY
- 22.9%
- Active inventory
- 95
- Price-to-rent
- 7.7×
Monthly cashflow live
- Estimated rent
- $1,997 high interval (Pro) →
- Mortgage (P&I)
- −$970
- Tax from tax record
- −$170 /mo · $2,046/yr
- Insurance
- −$77
- HOA
- −$0
- Vacancy / Maint / Mgmt
- −$419
- Net cashflow
- $360
Break-even live
Sensitivity live
| Price | -10% $465 | -5% $412 | +0% $360 | +5% $308 | +10% $255 |
|---|---|---|---|---|---|
| Rent | -10% $202 | -5% $281 | +0% $360 | +5% $439 | +10% $518 |
| Rate | -1.0pp $453 | -0.5pp $407 | base $360 | +0.5pp $312 | +1.0pp $263 |
UW: 25.0% down · 7.5% · 30yr · 1.5% tax · 5.0% vac · 8.0% maint · 8.0% mgmt
Financing live
Cash to close
- Down payment
- $46,225
- Closing costs
- $5,547
- Reserves months
- —
- Total cash needed
- —
Loan-product check · same deal, 3 products live
Conventional
25% down · 7.5% · 30yr
- Down + closing
- —
- Monthly P&I
- —
- Monthly cashflow
- —
- DSCR
- —
- Eligible?
- —
Personal DTI + credit; lowest rate.
DSCR
20% down · 8.5% · 30yr
- Down + closing
- —
- Monthly P&I
- —
- Monthly cashflow
- —
- DSCR
- —
- Eligible?
- —
No personal income docs; deal must DSCR.
Hard money
10% down · 12.0% · 12mo
- Down + closing
- —
- Monthly P&I
- —
- Monthly cashflow
- —
- DSCR
- —
- Eligible?
- —
Short-term bridge; refi at stabilization.
Rent comps 6 comps
| Address | Beds | Baths | Sqft | Rent | $/sqft | DOM | Units | Dist |
|---|---|---|---|---|---|---|---|---|
| 107 Oak St Elgin, OK | 4.0 | 1.0 | 1300 | $1,295 | $1.00 | 12d | 1 | 0.06mi |
| 1205 Alma Dr Elgin, OK | 4.0 | 2.0 | 1800 | $1,900 | $1.06 | 12d | 1 | 0.22mi |
| 1534 Stonehouse Dr Elgin, OK | 3.0 | 2.0 | 1700 | $1,975 | $1.16 | 24d | 1 | 0.24mi |
| 1517 Stonehouse Dr Elgin, OK | 4.0 | 2.0 | 1565 | $1,700 | $1.09 | 22d | 1 | 0.32mi |
| 313 Marilyn Glover Dr Elgin, OK | 3.0 | 2.0 | 1600 | $1,650 | $1.03 | 24d | 1 | 0.79mi |
| 1201 Kensington Ln Elgin, OK | 2.0–3.0 | 2.0–2.5 | 1414 | $1,700 | $1.20 | 24d | 1 | 1.39mi |
Listing history 31 events
-
2026-06-19days on market $184,900 Active 56 DOM
-
2026-06-18days on market $184,900 Active 55 DOM
-
2026-06-17days on market $184,900 Active 54 DOM
-
2026-06-16days on market $184,900 Active 53 DOM
-
2026-06-15days on market $184,900 Active 52 DOM
-
2026-06-14days on market $184,900 Active 50 DOM
-
2026-06-13pricedays on market $184,900 Active 49 DOM
-
2026-06-10days on market $189,900 Active 47 DOM
-
2026-06-09days on market $189,900 Active 46 DOM
-
2026-06-08days on market $189,900 Active 45 DOM
-
2026-06-07days on market $189,900 Active 44 DOM
-
2026-06-05days on market $189,900 Active 41 DOM
-
2026-06-02days on market $189,900 Active 39 DOM
-
2026-06-01days on market $189,900 Active 38 DOM
-
2026-05-31days on market $189,900 Active 37 DOM
-
2026-05-30days on market $189,900 Active 36 DOM
-
2026-04-24$189,900 Active
-
2026-03-03price $195,000
-
2026-02-17$200,000 Active
-
2024-07-30historical $1,500
-
2024-07-28historical $1,500
-
2024-07-28$1,500
-
2024-06-05
-
2022-07-27soldstatus $170,000
-
2022-07-22soldstatus $170,000 474-char remark
Show marketing remark (474 chars)
Nicely updated 4 bed, 1 3/4 bath, located in the heart of Elgin and within walking distance to the school. Updates include flooring, paint, light fixtures, carpet, and updated bathrooms. Roof is only 2yrs old. This home has an extra large living room and a formal dining space with lots cabinetry. Outback is a nice concrete patio and a large shop with electricity. Come see today! * Third-party automated valuations don't account for the added square footage and the shop.
-
2022-06-14$170,000 474-char remark
Show marketing remark (474 chars)
Nicely updated 4 bed, 1 3/4 bath, located in the heart of Elgin and within walking distance to the school. Updates include flooring, paint, light fixtures, carpet, and updated bathrooms. Roof is only 2yrs old. This home has an extra large living room and a formal dining space with lots cabinetry. Outback is a nice concrete patio and a large shop with electricity. Come see today! * Third-party automated valuations don't account for the added square footage and the shop.
-
2004-02-09soldstatus $63,500
-
2002-05-06soldstatus $51,000
-
1998-08-10soldstatus $55,000
-
1998-08-06soldstatus $55,000
-
1992-07-15soldstatus $36,500
ⓘ Source: listings_history table (triggers on properties + properties_extension) + one-shot
backfill from property_details.listing_events for pre-trigger history.
Tax reassessment forecast OK · Resets to sale price
- Current annual tax
- $2,046 · $170/mo
- Projected year-2 tax
- $2,046 · $170/mo
- Expected delta
- $0/yr ($0/mo · 0.0%)
ⓘ Screening estimate from a state-policy table — verify with the county assessor before closing.
Climate risk First Street
- Flood 1/10 Low FEMA zone X (unshaded) · 0% chance over 30 yrs
- Wildfire 8/10 Severe
- Heat 6/10 Major 7 d/yr ≥108°F today · 19 d/yr by 30 yrs out
- Wind 2/10 Low 4% chance of damaging wind over 30 yrs
- Air quality 1/10 Low 0 unhealthy d/yr today · 0 by 30 yrs out
Nearby sold comps map
Loading sold comps map…
Walkable amenities ~0.75 mi
Loading nearby amenities…
Taxation est. · year 1
- Rental income
- $23,958
- − Mortgage interest
- −$10,357
- − Property taxes
- −$2,046
- − Insurance
- −$924
- − Repairs & maintenance
- −$1,917
- − Management
- −$1,917
- − Depreciation
- −$5,379
- Taxable income
- $1,418
- Est. tax owed @ 24.0%
- −$340
- After-tax cash flow
- $3,981/yr
For passive investors: Depreciation is non-cash, so a rental often shows a tax loss while cash-flowing — sheltering income. Rental losses are passive: they offset passive income freely, and up to $25,000/yr can offset ordinary (W-2) income if you actively participate and your MAGI is under $100k (phasing out to $0 by $150k); unused losses carry forward. On sale, claimed depreciation is recaptured at up to 25%, and gains may owe capital-gains tax (a 1031 exchange can defer both). Figures are a year-1 estimate at your 24.0% rate — not tax advice; consult a CPA.
Schools (NCES district)
- District
- Elgin
- NCES district ID
- 4010710
- Math proficiency
- 29% ▼ -9.00%
- Reading proficiency
- 36% ▼ -5.00%
- Median HH income
- $65,900
- Composite
- 29.77/100
- National rank
- #6432
- State rank
- #38 of 270 in OK
Livability — Elgin
- Score
- 73/100
- State rank
- #17
- US rank
- #5411
Category grades
Schools grade is shown separately in the Schools card above.
Census & demographics
- Census place
- Elgin, OK
- County
- Comanche County · 96,361 people
- City population
- 7,128
- Metro
- Lawton, OK
- Population (ZIP)
- 7,128
- Household income
- $91,324
- Rent vs Own
- Severe rent burden
- 70.0
Population outlook (Comanche County) Hauer SSP2
- Today (2025)
- 124,518 people
- By 2030
- 124,231 · -0.2%
- By 2040
- 122,193 · -1.9%
- By 2050
- 120,368 · -3.3%
- By 2075
- 120,492 · -3.2%
- By 2100
- 123,113 · -1.1%
Race, ethnicity, and origin ACS 2023
- Neighborhood character
- Predominantly White (71%)
- Race & ethnicity
- White 71% Two or more races 15% Hispanic / Latino 13% Native American 4% Black 2% Asian 1%
- Hispanic origin (detail)
- Mexican 11% Puerto Rican 2%
- Common ancestry
- Slovak 5% Romanian 2% Serbian 1%
- Foreign-born
- 3% · Canada
- Languages at home
- 93% English-only · Spanish 4% German/W. Germanic 1%
Political lean MEDSL · Comanche
- 2024 margin
- Strong R (+23.3) · D 37.4% · R 60.7% · Other 1.9%
- 2008→2024 swing
- -5.8pp toward R · 2008: -17.5pp · 2024: -23.3pp
- All cycles
- 2024: R+23.3 2020: R+20.1 2016: R+23.7 2012: R+17.0 2008: R+17.5
Not yet ingested
- Civics
- —
Market trends
- HPI YoY
- ▲ 45.70%
- Current HPI
- 245.4249
- Rent YoY
- —
- Metro
- Lawton, OK
- State GDP YoY
- ▲ 1.55%
- F500 in state
- 6
Industry mix (Fortune 500 HQ in OK)
| Industry | F500 HQs | Revenue |
|---|---|---|
| Energy | 3 | $48B |
|
||
Price history
+420.3% since first listed15 events — show timeline
- 2026-04-24 Listed $189,900 MLSOK
- 2026-03-03 Price Changed $195,000 LBRMLS
- 2026-02-17 Listed $200,000 LBRMLS
- 2024-07-30 Rental Removed $1,500 RENTALBEAST
- 2024-07-28 Rental Removed $1,500 BUILDIUM
- 2024-07-28 Listed for Rent $1,500 RENTALBEAST
- 2024-06-05 Listed for Rent — BUILDIUM
- 2022-07-27 Sold (Public Records) $170,000 Public Records
- 2022-07-22 Sold (MLS) $170,000 LBRMLS
- 2022-06-14 Listed $170,000 LBRMLS
- 2004-02-09 Sold (Public Records) $63,500 Public Records
- 2002-05-06 Sold (Public Records) $51,000 Public Records
- 1998-08-10 Sold (Public Records) $55,000 Public Records
- 1998-08-06 Sold (Public Records) $55,000 Public Records
- 1992-07-15 Sold (Public Records) $36,500 Public Records
Property tax history
+7.2%/yrLatest (2025): $2,046 · +1.1% YoY. Source: county tax records.
Cash-flow waterfall
monthlySold comps — $/sqft
last 12 mo · ≤1 miLoading sold comps…