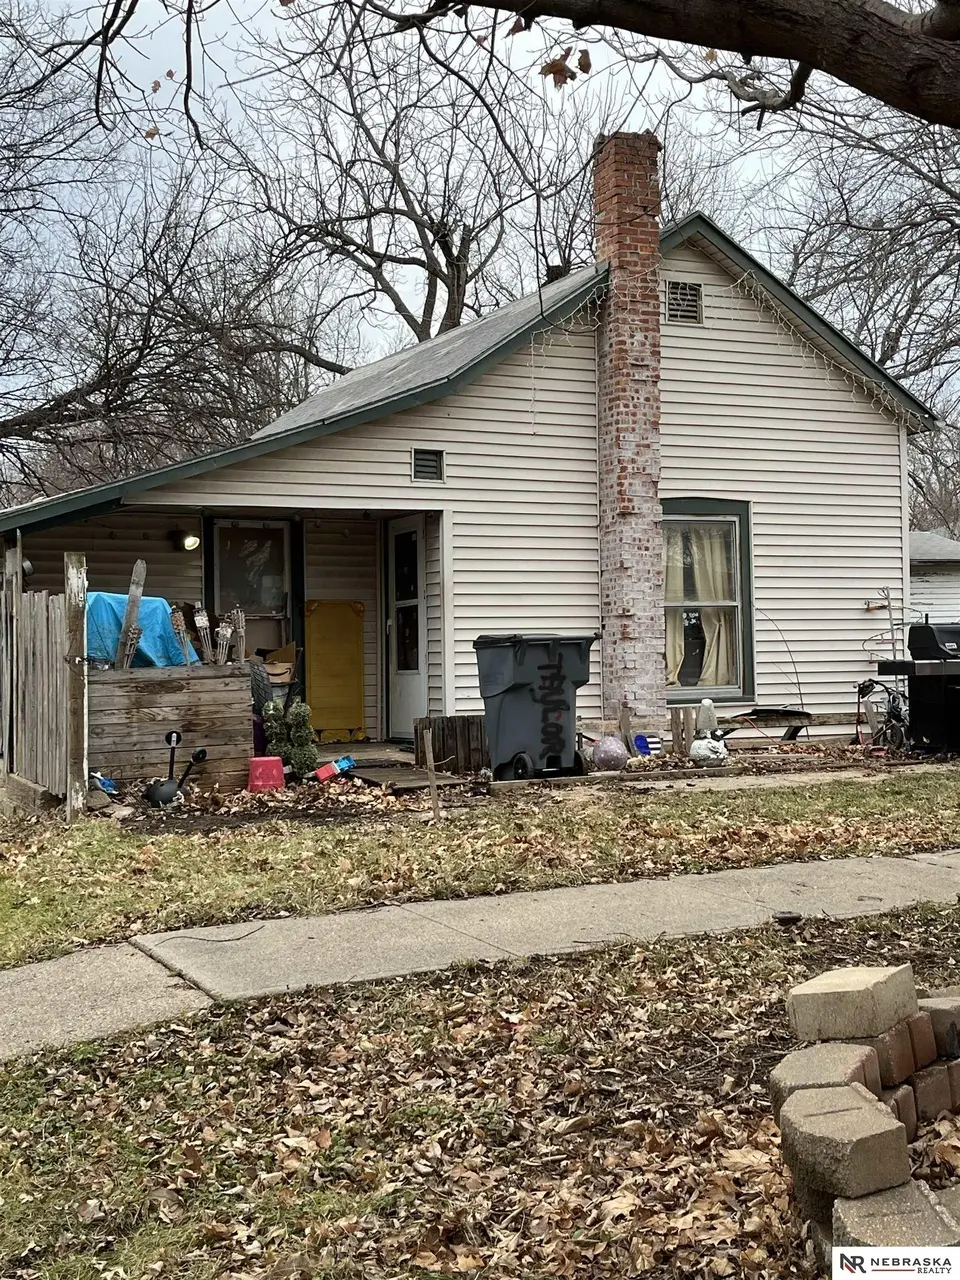
2304 N St · Auburn, NE
Flood risk 1/10 · Minimal
- FEMA flood zone
- X (unshaded)
- Chance of flooding over 30 yrs
- 0.0%
- Est. flood insurance / yr
- $473 – $860
Fire risk 2/10 · Minimal
- Est. fire insurance / yr
- $1,161 – $2,155
Heat risk 3/10 · Minor
- Hot days now (above 107°F)
- 7 days/yr
- Hot days in 30 yrs
- 16 days/yr
Wind risk 2/10 · Minimal
- Chance of severe wind over 30 yrs
- —
Air-quality risk 1/10 · Minimal
- Unhealthy air days now
- 0 days/yr
- Unhealthy air days in 30 yrs
- 0 days/yr
Risk factors via First Street. Map © Google.
Why this score? — see what drove the B+ grade
The composite is a weighted blend of 9 inputs, each scored 0–100. Each bar is that input's sub-score; the figure is the points it added to the 100-point composite (weight × sub-score).
- Cash flow +30.0/30.0
- ARV discount +15.0/15.0
- DSCR +10.0/10.0
- 1% rule +9.4/10.0
- Schools +4.4/10.0
- Livability +3.9/5.0
- Rent growth +2.5/5.0
- Condition / age +2.5/5.0
- Appreciation +0.0/10.0
$48,500
🖨 Deal sheet 📄 Offer letter ✓ Due diligence
Listing remarks MLS
Property in Auburn featuring a large backyard with great potential. A solid opportunity for buyers looking to customize or add value.
Key facts
- 6,970 sq ft lot
- Garage
- Built 1900
Neighborhood map
What this means for you Summary
Snapshot
- This is a 2-bed/1.0-bath single-family listed at $48k.
Deal economics
- At list price, monthly cash flow is $232 ($3k/yr) — positive.
- The deal already cash-flows at list — no discount required.
- Meets the 1% rule at list price ($696 rent vs $48k).
- Recommended offer: $43k (12.0% below list) — sets the bar for market timing.
Location & tenants
- Location reads 77/100 on livability (#68 in NE, #3,032 nationally) — a middle-class / working-renter tenant base. Strengths: schools A+, crime A+, cost of living A+; Watch: amenities F, commute F.
- Auburn Public Schools (town): math 49% / reading 56% proficiency, ranked #58 of 111 in NE (top 52%) — acceptable for families but not a draw, mixed tenant base, ~2y average lease.
- Market conditions: 15 active listings in the ZIP; 13 units permitted in Nemaha County in 2024 (0 in 5+ unit buildings).
Forward outlook
- Local home prices are declining (-3.0%/yr); year-one equity from $335 of loan paydown is wiped out by about $1k of value loss. Plan a longer hold.
- Nemaha County population projected to shrink 4% by 2050 — rents likely to lag national; underwrite the cash flow, not the appreciation.
- At projected returns (-3.0% appreciation + 3.0% rent growth), your $14k cash investment doubles in ~6 years — after that, you're playing with house money.
Negotiation context
- It's been on market 157 days — a 12% lower offer ($43k) is reasonable based on typical stale-listing flexibility.
- Current owner paid $17k; list at $48k implies a 185% gain — meaningful room to come down on a strong offer.
Risks & watch-outs
- Watch-outs: built in 1900 — expect roof / HVAC / electrical / plumbing capex.
Questions for the listing agent
- It's been on market 157 days. Have you received any prior offers? Is the seller open to a 12% concession, seller financing, or rate buy-down credit?
- Built in 1900 — when were the roof, HVAC, electrical panel, plumbing, and water heater last replaced?
- Why hasn't it sold? Are there any deal-killer items the seller is aware of (foundation, flood, title, zoning, code violations)?
- Is there a deadline driving the sale (1031 exchange, divorce, estate, relocation)? That informs how much negotiation room exists.
- Schools are A-rated — typically a magnet for longer-tenancy family renters. What's the average tenant stay here, and is there a school-zone premium baked into asking?
- What's the average days-on-market for RENTAL listings here right now (not sales)? A rising rental-DOM trend means longer vacancies and softer asking-rent achievability than the comps imply.
- What's the recent tenant-quality profile in this submarket — average credit score on applications, eviction rate, late-payment / NSF rate, and stable-employment percentage? A property-management company in the area should have these aggregated.
- How much new for-sale + rental construction is in the pipeline within 1–3 miles? Heavy new supply typically softens prices + rents 12–24 months out; constrained supply supports both.
Investment metrics
- 1% rule
- 1.44% ✓
- Cap rate
- 12.03%
- Cash-on-cash
- 20.49%
- DSCR
- 1.91
- GRM
- 5.8
CMA / ARV
- ARV (median comp)
- $72,823
- List price
- $48,500
- Delta
- -33.40%
- Verdict
- UNDERPRICED
- Comps
- 17 within 1.0 mi
Show comp detail 4 sales within ~0.75 mi
| Address | Dist | Beds/Ba | Sqft | Sold | Price | $/sf | Match |
|---|---|---|---|---|---|---|---|
| 2115 M St | 0.16mi | 2/1.0 | 815 (+12%) | 14mo | $100,000 | $123 | 61 |
| 1509 P St St | 0.59mi | 2/1.0 | 732 (+0%) | 16mo | $36,000 | $49 | 58 |
| 1704 J St | 0.52mi | 2/1.0 | 780 (+7%) | 10mo | $22,500 | $29 | 56 |
| 1507 O St | 0.59mi | 2/1.0 | 672 (-8%) | 23mo | $70,000 | $104 | 41 |
Match score weights: distance 35% · size 25% · config 20% · recency 20%. Top-matched comps best support the ARV.
Projected returns pro-forma
-3.0% appreciation · 3.0% rent growth · sell at horizon
- IRR
- 12.8%
- Equity multiple
- 1.51×
- Total profit
- $6,909
- Equity at exit
- $7,232
- IRR
- 21.7%
- Equity multiple
- 2.84×
- Total profit
- $25,033
- Equity at exit
- $4,193
Cash invested: $13,580 (down + closing). Projections, not guarantees.
Landlord ↔ Tenant lean methodology
- Overall (STATE)
- 83 Strongly Landlord-Friendly
- State Nebraska
- 83 Strongly Landlord-Friendly · R+13
- County
- — inherits STATE
- City
- — inherits STATE
ZIP-level market 68305
- Home prices YoY
- -12.9%
- Active inventory
- 15
- Price-to-rent
- 5.8×
Monthly cashflow live
- Estimated rent
- $696 medium interval (Pro) →
- Mortgage (P&I)
- −$254
- Tax from tax record
- −$43 /mo · $522/yr
- Insurance
- −$20
- HOA
- −$0
- Vacancy / Maint / Mgmt
- −$146
- Net cashflow
- $232
Break-even live
UW: 25.0% down · 7.5% · 30yr · 1.5% tax · 5.0% vac · 8.0% maint · 8.0% mgmt
Financing live
Cash to close
- Down payment
- $12,125
- Closing costs
- $1,455
- Reserves months
- —
- Total cash needed
- —
Loan-product check · same deal, 3 products live
Conventional
25% down · 7.5% · 30yr
- Down + closing
- —
- Monthly P&I
- —
- Monthly cashflow
- —
- DSCR
- —
- Eligible?
- —
Personal DTI + credit; lowest rate.
DSCR
20% down · 8.5% · 30yr
- Down + closing
- —
- Monthly P&I
- —
- Monthly cashflow
- —
- DSCR
- —
- Eligible?
- —
No personal income docs; deal must DSCR.
Hard money
10% down · 12.0% · 12mo
- Down + closing
- —
- Monthly P&I
- —
- Monthly cashflow
- —
- DSCR
- —
- Eligible?
- —
Short-term bridge; refi at stabilization.
Listing history 19 events
-
2026-06-18days on market $48,500 Active 157 DOM
-
2026-06-17days on market $48,500 Active 156 DOM
-
2026-06-16days on market $48,500 Active 155 DOM
-
2026-06-15days on market $48,500 Active 154 DOM
-
2026-06-13days on market $48,500 Active 152 DOM
-
2026-06-12days on market $48,500 Active 151 DOM
-
2026-06-09days on market $48,500 Active 148 DOM
-
2026-06-08days on market $48,500 Active 147 DOM
-
2026-06-07days on market $48,500 Active 146 DOM
-
2026-06-07days on market $48,500 Active 145 DOM
-
2026-06-04days on market $48,500 Active 142 DOM
-
2026-06-02days on market $48,500 Active 141 DOM
-
2026-06-01days on market $48,500 Active 140 DOM
-
2026-05-31days on market $48,500 Active 139 DOM
-
2026-04-27price $48,500 133-char remark
Show marketing remark (133 chars)
Property in Auburn featuring a large backyard with great potential. A solid opportunity for buyers looking to customize or add value.
-
2026-01-10$55,000 New 133-char remark
Show marketing remark (133 chars)
Property in Auburn featuring a large backyard with great potential. A solid opportunity for buyers looking to customize or add value.
-
2007-01-18soldstatus $17,000
-
2006-02-17soldstatus $13,000
-
1999-04-30soldstatus $18,000
ⓘ Source: listings_history table (triggers on properties + properties_extension) + one-shot
backfill from property_details.listing_events for pre-trigger history.
Tax reassessment forecast NE · Resets to sale price
- Current annual tax
- $522 · $43/mo
- Projected year-2 tax
- $839 · $70/mo
- Expected delta
- +$317/yr (+$26/mo · 60.8%)
ⓘ Screening estimate from a state-policy table — verify with the county assessor before closing.
Climate risk First Street
- Flood 1/10 Low FEMA zone X (unshaded) · 0% chance over 30 yrs
- Wildfire 2/10 Low
- Heat 3/10 Moderate 7 d/yr ≥107°F today · 16 d/yr by 30 yrs out
- Wind 2/10 Low
- Air quality 1/10 Low 0 unhealthy d/yr today · 0 by 30 yrs out
Nearby sold comps map
Loading sold comps map…
Walkable amenities ~0.75 mi
Loading nearby amenities…
Taxation est. · year 1
- Rental income
- $8,353
- − Mortgage interest
- −$2,717
- − Property taxes
- −$522
- − Insurance
- −$242
- − Repairs & maintenance
- −$668
- − Management
- −$668
- − Depreciation
- −$1,411
- Taxable income
- $2,125
- Est. tax owed @ 24.0%
- −$510
- After-tax cash flow
- $2,273/yr
For passive investors: Depreciation is non-cash, so a rental often shows a tax loss while cash-flowing — sheltering income. Rental losses are passive: they offset passive income freely, and up to $25,000/yr can offset ordinary (W-2) income if you actively participate and your MAGI is under $100k (phasing out to $0 by $150k); unused losses carry forward. On sale, claimed depreciation is recaptured at up to 25%, and gains may owe capital-gains tax (a 1031 exchange can defer both). Figures are a year-1 estimate at your 24.0% rate — not tax advice; consult a CPA.
Schools (NCES district)
- District
- Auburn Public Schools
- NCES district ID
- 3103330
- Math proficiency
- 49% ▼ -8.00%
- Reading proficiency
- 56% ▼ -8.00%
- Median HH income
- $45,761
- Composite
- 44.43/100
- National rank
- #2807
- State rank
- #58 of 111 in NE
Livability — Auburn
- Score
- 77/100
- State rank
- #68
- US rank
- #3032
Category grades
Schools grade is shown separately in the Schools card above.
Census & demographics
- Census place
- Auburn, NE
- Population (ZIP)
- 4,338
Population outlook (Nemaha County) Hauer SSP2
- Today (2025)
- 7,018 people
- By 2030
- 6,911 · -1.5%
- By 2040
- 6,730 · -4.1%
- By 2050
- 6,738 · -4.0%
- By 2075
- 7,053 · +0.5%
- By 2100
- 7,347 · +4.7%
Race, ethnicity, and origin ACS 2023
- Neighborhood character
- Predominantly White (89%)
- Race & ethnicity
- White 89% Two or more races 8% Hispanic / Latino 3%
- Common ancestry
- Scotch-Irish 3% Slovak 2% Romanian 2%
- Foreign-born
- 1% · Canada, Jamaica
- Languages at home
- 95% English-only · Spanish 3% German/W. Germanic 1%
Political lean MEDSL · Nemaha
- 2024 margin
- Solid R (+44.7) · D 26.8% · R 71.5% · Other 1.8%
- 2008→2024 swing
- -19.0pp toward R · 2008: -25.7pp · 2024: -44.7pp
- All cycles
- 2024: R+44.7 2020: R+43.9 2016: R+42.9 2012: R+28.5 2008: R+25.7
Not yet ingested
- Civics
- —
Market trends
- HPI YoY
- ▼ -24.72%
- Current HPI
- 166.7858
- Rent YoY
- —
- Metro
- —
- State GDP YoY
- ▲ 0.68%
- F500 in state
- 2
Industry mix (Fortune 500 HQ in NE)
| Industry | F500 HQs | Revenue |
|---|---|---|
| Conglomerate | 1 | $371B |
|
||
Price history
+169.4% since first listed5 events — show timeline
- 2026-04-27 Price Changed $48,500 GPRMLS
- 2026-01-10 Listed $55,000 GPRMLS
- 2007-01-18 Sold (Public Records) $17,000 Public Records
- 2006-02-17 Sold (Public Records) $13,000 Public Records
- 1999-04-30 Sold (Public Records) $18,000 Public Records
Property tax history
+3.0%/yrLatest (2025): $522 · -38.9% YoY. Source: county tax records.
Cash-flow waterfall
monthlySold comps — $/sqft
last 12 mo · ≤1 miLoading sold comps…