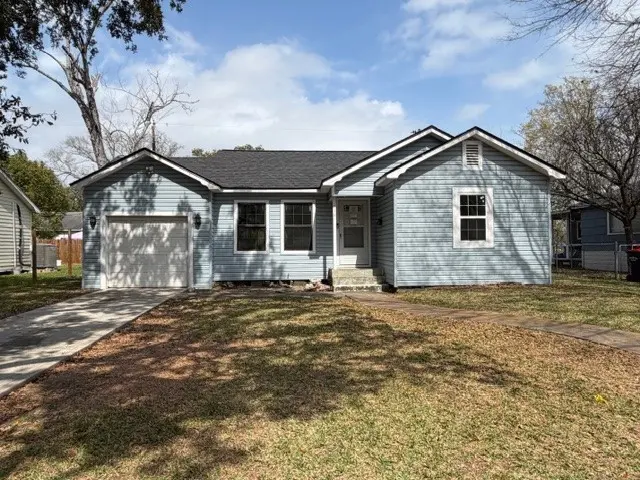
716 E Republic Ave · Baytown, TX
Flood risk 1/10 · Minimal
- FEMA flood zone
- X (unshaded)
- Chance of flooding over 30 yrs
- 0.0%
- Est. flood insurance / yr
- $507 – $1,088
Fire risk 2/10 · Minimal
- Est. fire insurance / yr
- $1,222 – $2,270
Heat risk 10/10 · Severe
- Hot days now (above 109°F)
- 7 days/yr
- Hot days in 30 yrs
- 26 days/yr
Wind risk 9/10 · Severe
- Chance of severe wind over 30 yrs
- 99.0%
Air-quality risk 2/10 · Minimal
- Unhealthy air days now
- 1 days/yr
- Unhealthy air days in 30 yrs
- 2 days/yr
Risk factors via First Street. Map © Google.
Why this score? — see what drove the B- grade
The composite is a weighted blend of 9 inputs, each scored 0–100. Each bar is that input's sub-score; the figure is the points it added to the 100-point composite (weight × sub-score).
- Cash flow +30.0/30.0
- 1% rule +10.0/10.0
- DSCR +10.0/10.0
- ARV discount +7.5/15.0
- Livability +3.5/5.0
- Schools +3.2/10.0
- Rent growth +2.8/5.0
- Condition / age +2.5/5.0
- Appreciation +0.0/10.0
$85,000
🖨 Deal sheet (PDF) 📄 Offer letter ✓ Due diligence
Listing remarks MLS
Cute 3 bedroom 1 bath home with new roof! Open concept living and kitchen with new granite counter tops. Nice wood look vinyl flooring, new carpet in the bedrooms. Secure this home quickly! Easy access to Grand Parkway!
Key facts
- Close to schools
- Open living room
- Attached garage
Tags
Neighborhood map
What this means for you Summary
Snapshot
- This is a 3-bed/1.0-bath single-family listed at $85k.
Deal economics
- At list price, monthly cash flow is $482 ($6k/yr) — positive.
- The deal already cash-flows at list — no discount required.
- Meets the 1% rule at list price ($1k rent vs $85k).
- Recommended offer: $84k (1.5% below list) — sets the bar for market timing.
- Cap rate 13.1% vs local median 4.2% in Baytown — top-decile yield for the area; either an underpriced asset or a hidden risk that comps aren't pricing in. Stress-test before assuming the spread holds.
Location & tenants
- Location reads 69/100 on livability (#412 in TX) — a middle-class / working-renter tenant base. Strengths: cost of living A+, housing A+; Watch: employment D+, crime F, amenities F.
- Goose Creek CISD (urban): math 37% / reading 36% proficiency, ranked #473 of 826 in TX (top 57%) — families likely to look elsewhere, expect single-tenant / working-renter base with shorter leases; 61% free/reduced lunch — lower-income household profile, screen leases tightly.
- Zoned schools: Ashbel Smith El (math 28% / reading 28%, grade F, #2,740 of 4,322 statewide, top 64%, 582 students, 90% FRL); Horace Mann J H (math 34% / reading 28%, grade F, #1,015 of 1,662 statewide, top 62%, 811 students, 87% FRL); High Point School (12 students, 75% FRL) — zoned schools average 84% FRL vs 61% district-wide (23 pts higher); higher-poverty schools than district average — tighter screening recommended.
- Market conditions: Rents rising (+1.3%/yr); 274 active listings in the ZIP; 16 comparable units currently listed for rent nearby; rentals lingering (median 46d on market — plan ~5-8 weeks vacancy on turnover, expect pricing pressure); 62% of comp listings sitting > 30 days — soft ceiling on asking rent; 29,883 units permitted in Harris County in 2024 (8,621 in 5+ unit buildings).
Forward outlook
- Local home prices are declining (-3.0%/yr); year-one equity from $588 of loan paydown is wiped out by about $3k of value loss. Plan a longer hold.
- Harris County population projected at +47% by 2050 — long-run rental-demand tailwind backs the buy-and-hold thesis.
- At projected returns (-3.0% appreciation + 1.3% rent growth), your $24k cash investment doubles in ~6 years — after that, you're playing with house money.
Negotiation context
- It's been on market 23 days — a 2% lower offer ($84k) is reasonable based on typical stale-listing flexibility.
- 2 sale attempts since 4y ago with the ask held roughly flat each time — persistent listings suggest the price (not the market) is what's stuck; bring a comps-based counter.
Risks & watch-outs
- Climate carrying-cost: severe wind risk, 99% chance of damaging wind over 30y; extreme-heat days projected 7→26/yr by 2055 (HVAC capex compounding) — expect insurance premiums to compound above CPI over the hold.
Questions for the listing agent
- Built in 1964 — when were the roof, HVAC, electrical panel, plumbing, and water heater last replaced?
- Is there a deadline driving the sale (1031 exchange, divorce, estate, relocation)? That informs how much negotiation room exists.
- Schools are D-rated, which usually means shorter tenancies and higher turnover. Who's the typical renter profile here, and what's been the actual vacancy rate?
- Crime grade is F in this area — have there been break-ins, vandalism, or insurance claims at this property in the last 3 years? What carrier currently insures it and at what premium?
- What's the average days-on-market for RENTAL listings here right now (not sales)? A rising rental-DOM trend means longer vacancies and softer asking-rent achievability than the comps imply.
- What's the recent tenant-quality profile in this submarket — average credit score on applications, eviction rate, late-payment / NSF rate, and stable-employment percentage? A property-management company in the area should have these aggregated.
- How much new for-sale + rental construction is in the pipeline within 1–3 miles? Heavy new supply typically softens prices + rents 12–24 months out; constrained supply supports both.
Investment metrics
- 1% rule
- 1.59% ✓
- Cap rate
- 13.09%
- Cash-on-cash
- 24.28%
- DSCR
- 2.08
- GRM
- 5.2
CMA / ARV
- ARV (on-the-fly)
- $187,740
- Comps found
- 12
Show comp detail 12 sales within ~0.75 mi
| Address | Dist | Beds/Ba | Sqft | Sold | Price | $/sf | Match |
|---|---|---|---|---|---|---|---|
| 708 N Circle Dr | 0.31mi | 3/1.5 | 1,056 (+1%) | 0mo | $189,990 | $180 | 81 |
| 122 E Murrill Ave | 0.57mi | 3/1.0 | 1,008 (-3%) | 1mo | $109,000 | $108 | 67 |
| 916 Parkway St | 0.34mi | 3/2.0 | 930 (-11%) | 0mo | $170,000 | $183 | 62 |
| 804 E James St | 0.43mi | 3/2.0 | 1,100 (+6%) | 7mo | $185,000 | $168 | 61 |
| 520 E Fayle St | 0.69mi | 3/1.0 | 1,020 (-2%) | 4mo | $149,900 | $147 | 61 |
| 315 E Adoue St | 0.63mi | 3/2.0 | 1,036 (-1%) | 10mo | $189,900 | $183 | 57 |
| 704 E Adoue St | 0.58mi | 3/2.0 | 1,012 (-3%) | 11mo | $182,000 | $180 | 55 |
| 503 E Fayle St | 0.67mi | 3/1.0 | 980 (-6%) | 6mo | $139,900 | $143 | 54 |
| 15 High St | 0.62mi | 3/2.0 | 1,162 (+11%) | 3mo | $140,000 | $120 | 45 |
| 1205 S Alexander Dr | 0.61mi | 2/1.5 (-1) | 1,103 (+6%) | 13mo | $199,990 | $181 | 44 |
| 316 E Hunnicutt St | 0.70mi | 2/1.0 (-1) | 1,092 (+5%) | 14mo | $100,000 | $92 | 43 |
| 417 E Hunnicutt St | 0.64mi | 2/1.0 (-1) | 944 (-10%) | 11mo | $169,900 | $180 | 40 |
Match score weights: distance 35% · size 25% · config 20% · recency 20%. Top-matched comps best support the ARV.
Projected returns pro-forma
-3.0% appreciation · 1.3% rent growth · sell at horizon
- IRR
- 15.6%
- Equity multiple
- 1.62×
- Total profit
- $14,642
- Equity at exit
- $12,674
- IRR
- 23.0%
- Equity multiple
- 2.82×
- Total profit
- $43,301
- Equity at exit
- $7,349
Cash invested: $23,800 (down + closing). Projections, not guarantees.
Landlord ↔ Tenant lean methodology
- Overall (STATE)
- 87 Strongly Landlord-Friendly
- State Texas
- 87 Strongly Landlord-Friendly · R+5
- County
- — inherits STATE
- City
- — inherits STATE
ZIP-level market 77520
- Rents YoY
- 1.3%
- Active inventory
- 274
- Price-to-rent
- 5.2×
Monthly cashflow live
- Estimated rent
- $1,353 high interval (Pro) →
- Mortgage (P&I)
- −$446
- Tax est. 1.5%
- −$106 /mo · $1,275/yr
- Insurance
- −$35
- HOA
- −$0
- Vacancy / Maint / Mgmt
- −$284
- Net cashflow
- $482
Break-even live
Sensitivity live
| Price | -10% $540 | -5% $511 | +0% $482 | +5% $452 | +10% $423 |
|---|---|---|---|---|---|
| Rent | -10% $375 | -5% $428 | +0% $482 | +5% $535 | +10% $588 |
| Rate | -1.0pp $524 | -0.5pp $503 | base $482 | +0.5pp $460 | +1.0pp $437 |
UW: 25.0% down · 7.5% · 30yr · 1.5% tax · 5.0% vac · 8.0% maint · 8.0% mgmt
Financing live
Cash to close
- Down payment
- $21,250
- Closing costs
- $2,550
- Reserves months
- —
- Total cash needed
- —
Loan-product check · same deal, 3 products live
Conventional
25% down · 7.5% · 30yr
- Down + closing
- —
- Monthly P&I
- —
- Monthly cashflow
- —
- DSCR
- —
- Eligible?
- —
Personal DTI + credit; lowest rate.
DSCR
20% down · 8.5% · 30yr
- Down + closing
- —
- Monthly P&I
- —
- Monthly cashflow
- —
- DSCR
- —
- Eligible?
- —
No personal income docs; deal must DSCR.
Hard money
10% down · 12.0% · 12mo
- Down + closing
- —
- Monthly P&I
- —
- Monthly cashflow
- —
- DSCR
- —
- Eligible?
- —
Short-term bridge; refi at stabilization.
Rent comps 16 comps
| Address | Beds | Baths | Sqft | Rent | $/sqft | DOM | Units | Dist |
|---|---|---|---|---|---|---|---|---|
| 301 Tri City Beach Rd Baytown, TX | 1.0–2.0 | 1.0 | 792 | $1,350 | $1.70 | 45d | 1 | 0.19mi |
| 105 E Adoue St Baytown, TX | 3.0 | 1.0 | 1040 | $1,200 | $1.15 | 45d | 1 | 0.72mi |
| 1300 Madison St Baytown, TX | 3.0 | 1.0 | 1316 | $1,500 | $1.14 | 45d | 1 | 0.94mi |
| 1804 Chilton Dr Baytown, TX | 3.0 | 2.5 | 1255 | $1,720 | $1.37 | 26d | 1 | 1.08mi |
| 607 Vista Ave Baytown, TX | 3.0 | 2.0 | 1232 | $1,475 | $1.20 | 45d | 1 | 1.13mi |
| 2500 E James Ave Baytown, TX | 2.0–3.0 | 1.0–2.0 | 1093 | $1,408 | $1.29 | 0d | 16 | 1.15mi |
| 508 Forrest St Baytown, TX | 2.0 | 1.0 | 980 | $1,299 | $1.33 | 7d | 1 | 1.18mi |
| 1502 Beaumont Rd Baytown, TX | 2.0 | 1.0 | 1010 | $1,000 | $0.99 | 45d | 1 | 1.22mi |
| 1507 Barcelona Way Baytown, TX | 2.0 | 2.0 | 1070 | $1,075 | $1.00 | 45d | 1 | 1.23mi |
| 1510 Beaumont Rd Baytown, TX | 2.0 | 1.0 | 1010 | $1,100 | $1.09 | 45d | 1 | 1.23mi |
| 1512 Beaumont Rd Baytown, TX | 3.0 | 2.0 | 1112 | $1,200 | $1.08 | 45d | 1 | 1.24mi |
| 1519 Barcelona Way Baytown, TX | 3.0 | 2.0 | 1325 | $1,250 | $0.94 | 45d | 1 | 1.27mi |
| 1525 Barcelona Way Baytown, TX | 3.0 | 2.0 | 1112 | $1,250 | $1.12 | 26d | 1 | 1.28mi |
| 510 Williams Ave Baytown, TX | 1.0–2.0 | 1.0 | 699 | $1,599 | $2.29 | 3d | 5 | 1.34mi |
| 516 William Ave Baytown, TX | 2.0 | 1.0 | 931 | $1,250 | $1.34 | 45d | 1 | 1.35mi |
| 2300 Taft Cir Baytown, TX | 1.0–3.0 | 1.0–2.0 | 1070 | $1,065 | $0.99 | 0d | 19 | 1.46mi |
Listing history 10 events
-
2026-04-09status Pending
-
2026-03-27status Pending
-
2026-03-16$85,000 Active
-
2022-09-06soldstatus Sold 223-char remark
Show marketing remark (223 chars)
Cute 3 bedroom 1 bath home with new roof! Open concept living and kitchen with new granite counter tops. Nice wood look vinyl flooring, new carpet in the bedrooms. Secure this home quickly! Easy access to Grand Parkway!
-
2022-09-06soldstatus
Show marketing remark (223 chars)
Cute 3 bedroom 1 bath home with new roof! Open concept living and kitchen with new granite counter tops. Nice wood look vinyl flooring, new carpet in the bedrooms. Secure this home quickly! Easy access to Grand Parkway!
-
2022-08-03status Pending 223-char remark
Show marketing remark (223 chars)
Cute 3 bedroom 1 bath home with new roof! Open concept living and kitchen with new granite counter tops. Nice wood look vinyl flooring, new carpet in the bedrooms. Secure this home quickly! Easy access to Grand Parkway!
-
2022-07-06$145,000 Active 223-char remark
Show marketing remark (223 chars)
Cute 3 bedroom 1 bath home with new roof! Open concept living and kitchen with new granite counter tops. Nice wood look vinyl flooring, new carpet in the bedrooms. Secure this home quickly! Easy access to Grand Parkway!
-
2011-09-09soldstatus
-
2007-08-10soldstatus
-
2001-02-26soldstatus
ⓘ Source: listings_history table (triggers on properties + properties_extension) + one-shot
backfill from property_details.listing_events for pre-trigger history.
Climate risk First Street
- Flood 1/10 Low FEMA zone X (unshaded) · 0% chance over 30 yrs
- Wildfire 2/10 Low
- Heat 10/10 Extreme 7 d/yr ≥109°F today · 26 d/yr by 30 yrs out
- Wind 9/10 Extreme 99% chance of damaging wind over 30 yrs
- Air quality 2/10 Low 1 unhealthy d/yr today · 2 by 30 yrs out
Nearby sold comps map
Loading sold comps map…
Walkable amenities ~0.75 mi
Loading nearby amenities…
Taxation est. · year 1
- Rental income
- $16,238
- − Mortgage interest
- −$4,761
- − Property taxes
- −$1,275
- − Insurance
- −$425
- − Repairs & maintenance
- −$1,299
- − Management
- −$1,299
- − Depreciation
- −$2,473
- Taxable income
- $4,706
- Est. tax owed @ 24.0%
- −$1,129
- After-tax cash flow
- $4,649/yr
For passive investors: Depreciation is non-cash, so a rental often shows a tax loss while cash-flowing — sheltering income. Rental losses are passive: they offset passive income freely, and up to $25,000/yr can offset ordinary (W-2) income if you actively participate and your MAGI is under $100k (phasing out to $0 by $150k); unused losses carry forward. On sale, claimed depreciation is recaptured at up to 25%, and gains may owe capital-gains tax (a 1031 exchange can defer both). Figures are a year-1 estimate at your 24.0% rate — not tax advice; consult a CPA.
Schools (NCES district)
- District
- Goose Creek CISD
- NCES district ID
- 4821150
- Math proficiency
- 37% ▼ -11.00%
- Reading proficiency
- 36% ▼ -4.00%
- Median HH income
- $52,468
- Composite
- 31.84/100
- National rank
- #5877
- State rank
- #473 of 826 in TX
Livability — Baytown
- Score
- 69/100
- State rank
- #412
- US rank
- #8494
Category grades
Schools grade is shown separately in the Schools card above.
Census & demographics
- Census place
- Baytown, TX
- County
- Harris County · 4,702,590 people
- City population
- 135,579
- Metro
- Houston-The Woodlands-Sugar Land, TX
- Population (ZIP)
- 36,355
- Household income
- $54,278
- Rent vs Own
- Severe rent burden
- 1559.0
Population outlook (Harris County) Hauer SSP2
- Today (2025)
- 5,571,493 people
- By 2030
- 6,089,821 · +9.3%
- By 2040
- 7,142,806 · +28.2%
- By 2050
- 8,185,864 · +46.9%
- By 2075
- 10,574,329 · +89.8%
- By 2100
- 12,109,958 · +117.4%
Race, ethnicity, and origin ACS 2023
- Neighborhood character
- Diverse neighborhood (Simpson 0.60)
- Race & ethnicity
- Hispanic / Latino 55% White 30% Two or more races 19% Black 10% Asian 2%
- Hispanic origin (detail)
- Mexican 48%
- Common ancestry
- Italian 1% Lithuanian 1% Romanian 1%
- Foreign-born
- 21% · Canada, Vietnam
- Languages at home
- 55% English-only · Spanish 43% Other Asian/Pacific 1% Other Indo-European 1%
Political lean MEDSL · Harris
- 2024 margin
- Lean D (+5.5) · D 52.0% · R 46.4% · Other 1.6%
- 2008→2024 swing
- +3.9pp toward D · 2008: 1.6pp · 2024: 5.5pp
- All cycles
- 2024: D+5.5 2020: D+13.3 2016: D+12.4 2012: D+0.1 2008: D+1.6
Not yet ingested
- Civics
- —
Market trends
- HPI YoY
- ▼ -143.36%
- Current HPI
- 262.066
- Rent YoY
- ▲ 1.30%
- Metro
- Houston-The Woodlands-Sugar Land, TX
- State GDP YoY
- ▲ 3.95%
- F500 in state
- 110
Industry mix (Fortune 500 HQ in TX)
| Industry | F500 HQs | Revenue |
|---|---|---|
| Energy | 16 | $1,198B |
|
||
| Technology | 5 | $198B |
|
||
| Engineering / Construction | 4 | $72B |
|
||
| Energy Services | 3 | $60B |
|
||
| Utilities | 3 | $41B |
|
||
| Healthcare | 2 | $330B |
|
||
Price history
-41.4% since first listed10 events — show timeline
- 2026-04-09 Pending — HARMLS
- 2026-03-27 Pending — HARMLS
- 2026-03-16 Listed $85,000 HARMLS
- 2022-09-06 Sold (Public Records) — Public Records
- 2022-09-06 Sold (MLS) — HARMLS
- 2022-08-03 Pending — HARMLS
- 2022-07-06 Listed $145,000 HARMLS
- 2011-09-09 Sold (Public Records) — Public Records
- 2007-08-10 Sold (Public Records) — Public Records
- 2001-02-26 Sold (Public Records) — Public Records
Property tax history
+7.8%/yrLatest (2025): $4,733 · +19.7% YoY. Source: county tax records.
Cash-flow waterfall
monthlySold comps — $/sqft
last 12 mo · ≤1 miLoading sold comps…