35 E 30th St · Wilmington, DE
Flood risk 7/10 · Major
- FEMA flood zone
- X (unshaded)
- Chance of flooding over 30 yrs
- 0.77%
- Est. flood insurance / yr
- $473 – $860
Fire risk 1/10 · Minimal
- Est. fire insurance / yr
- $476 – $884
Heat risk 8/10 · Major
- Hot days now (above 103°F)
- 7 days/yr
- Hot days in 30 yrs
- 16 days/yr
Wind risk 6/10 · Moderate
- Chance of severe wind over 30 yrs
- 27.0%
Air-quality risk 3/10 · Minor
- Unhealthy air days now
- 2 days/yr
- Unhealthy air days in 30 yrs
- 3 days/yr
Risk factors via First Street. Map © Google.
Why this score? — see what drove the C+ grade
The composite is a weighted blend of 9 inputs, each scored 0–100. Each bar is that input's sub-score; the figure is the points it added to the 100-point composite (weight × sub-score).
- Cash flow +21.7/30.0
- ARV discount +14.4/15.0
- DSCR +6.9/10.0
- 1% rule +4.7/10.0
- Rent growth +3.9/5.0
- Livability +3.2/5.0
- Schools +3.1/10.0
- Condition / age +2.5/5.0
- Appreciation +0.0/10.0
$184,900
🖨 Deal sheet 📄 Offer letter ✓ Due diligence
Listing remarks MLS
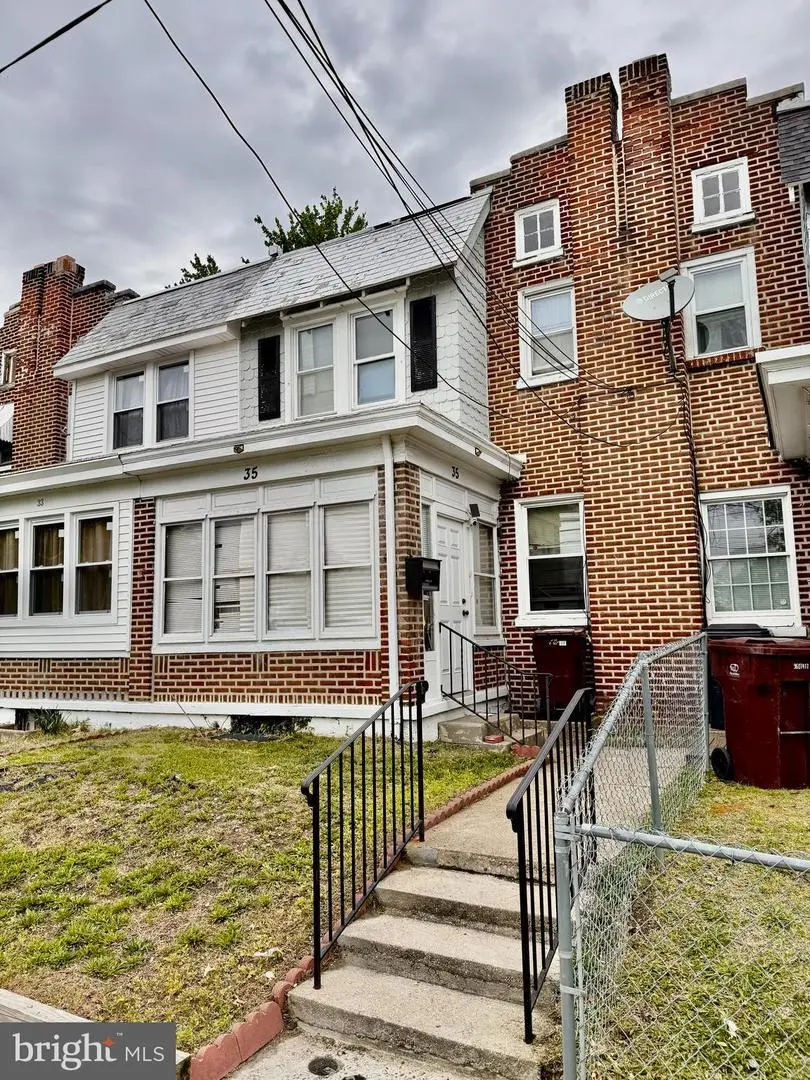
FIRST TIME HOMEBUYER / INVESTOR Alert: Why rent when you can buy? Gorgeous 3 bedroom, 1 bath home with stunning park views available to celebrate your New Year! Home offers led crystal lighting throughout, glass stainless steel backsplash, polished ceramic tile and newly refinished hardwood floors throughout the home on upper and main level. On the upper level, you will also find 3 great bedrooms, complete with an updated full bathroom, paired with granite countertop, white vessel sink and waterfall brush nickel faucet. On the lower level, offers an open concept feel for entertaining, or storage, with washer and dryer hookup, a one car garage and long driveway for off-street parking in the city. New water heater and a 1 year home warranty provided. A pre-owned Viking stainless steel refrigerator and champagne colored Kenmore Elite washer and dryer, with matching pedestals may be negotiated as part of sale. FHA Buyers welcome. Seller is a licensed Delaware Realtor.
Key facts
- Garage
- Built 1929
Property features AI
Exterior
- Parking: Built-in basement garage (1 garage space); Driveway with two parking spaces; Total of 3 garage and parking spaces
- Utilities: Public water; Public sewer; Natural gas service
- Home design: Interior townhouse/rowhouse; Fee simple ownership; Above-grade finished living space
- Construction: Brick construction; Block foundation
- Exterior features: Lot dimensions approximately 17.90 x 106.00; Not on tidal water
Interior
- Bedrooms: Three bedrooms on the upper level
- Bathrooms: One full bathroom
- Heating & cooling: Forced air heating; Window air conditioning units; Natural gas hot water
- Interior features: Partially finished basement with garage access
Neighborhood map
What this means for you Summary
Snapshot
- This is a 3-bed/1.0-bath townhouse listed at $185k.
Deal economics
- At list price, monthly cash flow is $229 ($3k/yr) — positive.
- The deal already cash-flows at list — no discount required.
- To meet the 1% rule (rent ≥ 1% of price), the offer needs to be $180k (2.6% below list).
- Recommended offer: $180k (2.6% below list) — sets the bar for 1% rule.
- Cap rate 8.1% vs local median 5.6% in Wilmington — top-decile yield for the area; either an underpriced asset or a hidden risk that comps aren't pricing in. Stress-test before assuming the spread holds.
Location & tenants
- Location reads 64/100 on livability (#52 in DE) — a middle-class / working-renter tenant base. Strengths: cost of living A+, housing A; Watch: employment D+, schools D, commute D.
- Brandywine School District (suburban): math 28% / reading 40% proficiency, ranked #11 of 26 in DE (top 42%) — families likely to look elsewhere, expect single-tenant / working-renter base with shorter leases.
- Market conditions: Rents rising fast (+5.7%/yr); 119 active listings in the ZIP; 40 comparable units currently listed for rent nearby; rentals at typical pace (median 25d on market — plan ~3-4 weeks tenant-placement turnaround); 1,367 units permitted in New Castle County in 2024 (201 in 5+ unit buildings).
- This rent runs 40% of the median local income ($54k/yr) — at the standard rent-burdened threshold; future hikes will face affordability resistance.
Forward outlook
- Local home prices are declining (-3.0%/yr); year-one equity from $1k of loan paydown is wiped out by about $6k of value loss. Plan a longer hold.
- New Castle County population projected at +9% by 2050 — modest demand growth; plan on rents tracking national, not racing it.
Negotiation context
- Only 2 days on market — expect competitive offers; lowballing is unlikely to land.
- 5 sale attempts since 20y ago; this cycle's ask is 25% above the opening price — seller raised mid-cycle; expect resistance to lowballs.
- Current owner paid $124k; 49% above their basis — modest negotiation headroom, anchor on the comps not their cost.
Risks & watch-outs
- Watch-outs: flood insurance adds $56/mo; built in 1929 — expect roof / HVAC / electrical / plumbing capex.
- Climate carrying-cost: major flood risk; major wind risk, 27% chance of damaging wind over 30y; extreme-heat days projected 7→16/yr by 2055 (HVAC capex compounding) — expect insurance premiums to compound above CPI over the hold.
Questions for the listing agent
- Built in 1929 — when were the roof, HVAC, electrical panel, plumbing, and water heater last replaced?
- What's the actual annual flood-insurance premium (NFIP or private), and is the property in a SFHA with mandatory coverage?
- Is there a deadline driving the sale (1031 exchange, divorce, estate, relocation)? That informs how much negotiation room exists.
- Schools are D-rated, which usually means shorter tenancies and higher turnover. Who's the typical renter profile here, and what's been the actual vacancy rate?
- Crime grade is F in this area — have there been break-ins, vandalism, or insurance claims at this property in the last 3 years? What carrier currently insures it and at what premium?
- What's the average days-on-market for RENTAL listings here right now (not sales)? A rising rental-DOM trend means longer vacancies and softer asking-rent achievability than the comps imply.
- What's the recent tenant-quality profile in this submarket — average credit score on applications, eviction rate, late-payment / NSF rate, and stable-employment percentage? A property-management company in the area should have these aggregated.
- How much new for-sale + rental construction is in the pipeline within 1–3 miles? Heavy new supply typically softens prices + rents 12–24 months out; constrained supply supports both.
Investment metrics
- 1% rule
- 0.97% ✗
- Cap rate
- 8.14%
- Cash-on-cash
- 6.61%
- DSCR
- 1.29
- GRM
- 8.6
CMA / ARV
- ARV (on-the-fly)
- $218,400
- Comps found
- 12
Show comp detail 12 sales within ~0.75 mi
| Address | Dist | Beds/Ba | Sqft | Sold | Price | $/sf | Match |
|---|---|---|---|---|---|---|---|
| 3208 N Madison St | 0.43mi | 3/1.0 | 1,200 (0%) | 2mo | $274,999 | $229 | 79 |
| 2708 Thompson Pl | 0.38mi | 3/1.0 | 1,175 (-2%) | 1mo | $215,000 | $183 | 78 |
| 2717 N West St | 0.30mi | 3/1.0 | 1,150 (-4%) | 2mo | $155,000 | $135 | 78 |
| 212 W 25th St | 0.42mi | 3/1.0 | 1,225 (+2%) | 1mo | $80,000 | $65 | 76 |
| 417 E 35th St | 0.37mi | 3/1.0 | 1,150 (-4%) | 2mo | $227,000 | $197 | 74 |
| 2412 Lamotte St | 0.34mi | 3/1.0 | 1,275 (+6%) | 0mo | $125,000 | $98 | 73 |
| 206 W 26th St | 0.38mi | 3/2.0 | 1,250 (+4%) | 2mo | $228,000 | $182 | 70 |
| 3003 N Tatnall St | 0.16mi | 2/1.0 (-1) | 1,050 (-12%) | 1mo | $165,000 | $157 | 66 |
| 623 W Twenty Eighth St | 0.59mi | 3/1.5 | 1,250 (+4%) | 0mo | $235,000 | $188 | 63 |
| 709 E 26th St | 0.26mi | 3/2.5 | 1,375 (+15%) | 0mo | $230,000 | $167 | 57 |
| 11 E 42nd St | 0.63mi | 3/1.5 | 1,075 (-10%) | 1mo | $252,500 | $235 | 51 |
| 2011 N West St | 0.65mi | 4/1.0 (+1) | 1,375 (+15%) | 1mo | $135,000 | $98 | 40 |
Match score weights: distance 35% · size 25% · config 20% · recency 20%. Top-matched comps best support the ARV.
Projected returns pro-forma
-3.0% appreciation · 5.72% rent growth · sell at horizon
- IRR
- -5.2%
- Equity multiple
- 0.80×
- Total profit
- $-10,308
- Equity at exit
- $27,569
- IRR
- 7.3%
- Equity multiple
- 1.61×
- Total profit
- $31,718
- Equity at exit
- $15,987
Cash invested: $51,772 (down + closing). Projections, not guarantees.
Landlord ↔ Tenant lean methodology
- Overall (STATE)
- 70 Landlord-Friendly
- State Delaware
- 70 Landlord-Friendly · D+7
- County
- — inherits STATE
- City
- — inherits STATE
ZIP-level market 19802
- Rents YoY
- 5.7%
- Active inventory
- 119
- Price-to-rent
- 8.6×
Monthly cashflow live
- Estimated rent
- $1,802 high interval (Pro) →
- Mortgage (P&I)
- −$970
- Tax from tax record
- −$92 /mo · $1,098/yr
- Insurance
- −$77
- Flood insurance flood zone
- −$56 /mo · $666/yr
- HOA
- −$0
- Vacancy / Maint / Mgmt
- −$378
- Net cashflow
- $229
Break-even live
UW: 25.0% down · 7.5% · 30yr · 1.5% tax · 5.0% vac · 8.0% maint · 8.0% mgmt
Financing live
Cash to close
- Down payment
- $46,225
- Closing costs
- $5,547
- Reserves months
- —
- Total cash needed
- —
Loan-product check · same deal, 3 products live
Conventional
25% down · 7.5% · 30yr
- Down + closing
- —
- Monthly P&I
- —
- Monthly cashflow
- —
- DSCR
- —
- Eligible?
- —
Personal DTI + credit; lowest rate.
DSCR
20% down · 8.5% · 30yr
- Down + closing
- —
- Monthly P&I
- —
- Monthly cashflow
- —
- DSCR
- —
- Eligible?
- —
No personal income docs; deal must DSCR.
Hard money
10% down · 12.0% · 12mo
- Down + closing
- —
- Monthly P&I
- —
- Monthly cashflow
- —
- DSCR
- —
- Eligible?
- —
Short-term bridge; refi at stabilization.
Rent comps 40 comps
| Address | Beds | Baths | Sqft | Rent | $/sqft | DOM | Units | Dist |
|---|---|---|---|---|---|---|---|---|
| 3005 N West St Wilmington, DE | 3.0 | 1.0 | 1176 | $1,900 | $1.62 | 24d | 1 | 0.20mi |
| 2705 Speakman Pl Wilmington, DE | 3.0 | 1.5 | 1100 | $1,975 | $1.80 | 13d | 1 | 0.20mi |
| 3003 N Washington St Wilmington, DE | 3.0 | 1.0 | 1250 | $1,950 | $1.56 | 44d | 1 | 0.28mi |
| 2923 N Washington St Wilmington, DE | 3.0 | 1.0 | 1225 | $1,600 | $1.31 | 2d | 1 | 0.28mi |
| 103 E 24th St Unit 1 Wilmington, DE | 3.0 | 1.0 | 1025 | $1,795 | $1.75 | 44d | 1 | 0.35mi |
| 400 W 29th St Wilmington, DE | 3.0 | 1.5 | 1125 | $1,950 | $1.73 | 44d | 1 | 0.36mi |
| 5 E 24th St Unit 1 Wilmington, DE | 3.0 | 1.0 | 1150 | $1,795 | $1.56 | 44d | 1 | 0.37mi |
| 2601 N Heald St Wilmington, DE | 3.0 | 1.0 | 1025 | $1,795 | $1.75 | 1d | 1 | 0.43mi |
| 547 Eastlawn Ave Wilmington, DE | 3.0 | 1.0 | 1400 | $1,995 | $1.43 | 44d | 1 | 0.43mi |
| 517 W 26th St Unit NA Wilmington, DE | 3.0 | 1.5 | 1344 | $1,900 | $1.41 | 24d | 1 | 0.52mi |
| 302 W 23rd St Unit 1 Wilmington, DE | 2.0 | 1.0 | 1450 | $1,295 | $0.89 | 24d | 1 | 0.55mi |
| 306 W 23rd St Unit 1 Wilmington, DE | 2.0 | 1.0 | 1475 | $1,295 | $0.88 | 24d | 1 | 0.55mi |
| 306 W 23rd St Unit 2 Wilmington, DE | 2.0 | 1.0 | 1475 | $1,295 | $0.88 | 44d | 1 | 0.55mi |
| 507 Barrett St Wilmington, DE | 3.0 | 1.0 | 1275 | $1,700 | $1.33 | 44d | 1 | 0.55mi |
| 306 Concord Ave Unit 2 Wilmington, DE | 3.0 | 1.0 | 1100 | $1,350 | $1.23 | 44d | 1 | 0.57mi |
| 312 Concord Ave Unit 2 Wilmington, DE | 2.0 | 1.0 | 700 | $1,295 | $1.85 | 24d | 1 | 0.57mi |
| 314 Concord Ave Unit 2 Wilmington, DE | 2.0 | 1.0 | 1300 | $1,295 | $1.00 | 24d | 1 | 0.57mi |
| 918 E 17th St Unit 1 Wilmington, DE | 3.0 | 1.0 | 1100 | $1,795 | $1.63 | 1d | 1 | 0.67mi |
| 409 W 20th St Unit 2 Wilmington, DE | 2.0 | 1.0 | 1100 | $1,700 | $1.55 | 10d | 1 | 0.74mi |
| 409 W 20th St Unit 2 Wilmington, DE | 2.0 | 1.0 | 1100 | $1,500 | $1.36 | 13d | 1 | 0.74mi |
| 3408 Miller Rd Wilmington, DE | 1.0–2.0 | 1.0–2.0 | 889 | $1,775 | $2.00 | 5d | 6 | 0.76mi |
| 608 W Lea Blvd Wilmington, DE | 1.0–2.0 | 1.0 | 825 | $1,500 | $1.82 | 44d | 1 | 0.80mi |
| 2 Colony Blvd Wilmington, DE | 1.0–2.0 | 1.0–2.0 | 1112 | $2,500 | $2.25 | 1d | 6 | 0.80mi |
| 604 W 20th St Unit 2 Wilmington, DE | 2.0 | 1.0 | 900 | $1,195 | $1.33 | 24d | 1 | 0.81mi |
| 608 W 20th St Wilmington, DE | 2.0 | 1.0 | 800 | $1,400 | $1.75 | 44d | 1 | 0.82mi |
| 518 E 12th St Wilmington, DE | 2.0 | 1.0 | 875 | $1,425 | $1.63 | 20d | 1 | 0.93mi |
| 1217 N King St Wilmington, DE | 3.0 | 1.5 | 1300 | $2,145 | $1.65 | 18d | 1 | 0.97mi |
| 1124 Clifford Brown Walk Wilmington, DE | 2.0 | 1.0 | 1240 | $1,625 | $1.31 | 44d | 1 | 0.97mi |
| 107 W 13th St Wilmington, DE | 3.0 | 1.5 | 1325 | $1,895 | $1.43 | 44d | 1 | 1.00mi |
| 310 Shipley Rd Wilmington, DE | 2.0 | 2.0 | 1010 | $1,722 | $1.71 | 1d | 2 | 1.01mi |
| 1026 Bennett St Wilmington, DE | 3.0 | 1.0 | 1125 | $1,685 | $1.50 | 1d | 1 | 1.01mi |
| 201 Philadelphia Pike Unit 216 Wilmington, DE | 2.0 | 1.0 | 850 | $1,400 | $1.65 | 44d | 1 | 1.01mi |
| 1004 N Spruce St Wilmington, DE | 3.0 | 1.5 | 1075 | $1,800 | $1.67 | 18d | 1 | 1.03mi |
| 201 1/2 Philadelphia Pike #326 Wilmington, DE | 2.0 | 1.0 | 779 | $1,595 | $2.05 | 44d | 1 | 1.04mi |
| 605 E 10th St Wilmington, DE | 3.0 | 1.0 | 1200 | $1,850 | $1.54 | 24d | 1 | 1.05mi |
| 928 Kirkwood St Wilmington, DE | 3.0 | 1.5 | 1150 | $1,700 | $1.48 | 17d | 1 | 1.08mi |
| 1001 N Orange St Wilmington, DE | 1.0–2.0 | 1.0–2.0 | 833 | $2,135 | $2.56 | 1d | 62 | 1.15mi |
| 835 N Spruce St Wilmington, DE | 3.0 | 1.0 | 775 | $1,700 | $2.19 | 1d | 1 | 1.16mi |
| 913 N Market St Wilmington, DE | 1.0–2.0 | 1.0–2.0 | 974 | $1,985 | $2.04 | 44d | 5 | 1.19mi |
| 116 W 9th St Wilmington, DE | 1.0–2.0 | 1.0–2.0 | 813 | $2,250 | $2.77 | 2d | 16 | 1.26mi |
Listing history 15 events
-
2026-06-18days on market $184,900 Active 2 DOM
-
2026-06-17remarks 557-char remark
-
2026-06-17statusdays on market $184,900 Active 1 DOM
-
2026-06-16days on market $184,900 Coming Soon 16 DOM
-
2026-06-15days on market $184,900 Coming Soon 15 DOM
-
2026-06-13days on market $184,900 Coming Soon 13 DOM
-
2026-06-09days on market $184,900 Coming Soon 9 DOM
-
2026-06-08days on market $184,900 Coming Soon 8 DOM
-
2026-06-07days on market $184,900 Coming Soon 7 DOM
-
2026-06-04days on market $184,900 Coming Soon 4 DOM
-
2026-06-03days on market $184,900 Coming Soon 3 DOM
-
2026-06-02days on market $184,900 Coming Soon 2 DOM
-
2026-06-02remarks 533-char remark
-
2026-06-01remarks 512-char remark
-
2026-06-01$184,900 Coming Soon 1 DOM
ⓘ Source: listings_history table (triggers on properties + properties_extension) + one-shot
backfill from property_details.listing_events for pre-trigger history.
Tax reassessment forecast DE · Partial reset (capped growth)
- Current annual tax
- $1,098 · $92/mo
- Projected year-2 tax
- $1,098 · $92/mo
- Expected delta
- $0/yr ($0/mo · 0.0%)
ⓘ Screening estimate from a state-policy table — verify with the county assessor before closing.
Climate risk First Street
- Flood 7/10 Severe FEMA zone X (unshaded) · 77% chance over 30 yrs
- Wildfire 1/10 Low
- Heat 8/10 Severe 7 d/yr ≥103°F today · 16 d/yr by 30 yrs out
- Wind 6/10 Major 27% chance of damaging wind over 30 yrs
- Air quality 3/10 Moderate 2 unhealthy d/yr today · 3 by 30 yrs out
Nearby sold comps map
Loading sold comps map…
Walkable amenities ~0.75 mi
Loading nearby amenities…
Taxation est. · year 1
- Rental income
- $21,618
- − Mortgage interest
- −$10,357
- − Property taxes
- −$1,098
- − Insurance
- −$1,591
- − Repairs & maintenance
- −$1,729
- − Management
- −$1,729
- − Depreciation
- −$5,379
- Taxable loss
- −$266
- Est. tax savings @ 24.0%
- +$64
- After-tax cash flow
- $2,817/yr
For passive investors: Depreciation is non-cash, so a rental often shows a tax loss while cash-flowing — sheltering income. Rental losses are passive: they offset passive income freely, and up to $25,000/yr can offset ordinary (W-2) income if you actively participate and your MAGI is under $100k (phasing out to $0 by $150k); unused losses carry forward. On sale, claimed depreciation is recaptured at up to 25%, and gains may owe capital-gains tax (a 1031 exchange can defer both). Figures are a year-1 estimate at your 24.0% rate — not tax advice; consult a CPA.
Schools (NCES district)
- District
- Brandywine School District
- NCES district ID
- 1001240
- Math proficiency
- 28% ▼ -13.00%
- Reading proficiency
- 40% ▼ -13.00%
- Median HH income
- $68,743
- Composite
- 31.27/100
- National rank
- #6019
- State rank
- #11 of 26 in DE
Livability — Wilmington
- Score
- 64/100
- State rank
- #52
- US rank
- #14251
Category grades
Schools grade is shown separately in the Schools card above.
Census & demographics
- Census place
- Wilmington, DE
- County
- New Castle County · 483,412 people
- City population
- 173,480
- Metro
- Philadelphia-Camden-Wilmington, PA-NJ-DE-MD
- Population (ZIP)
- 26,051
- Household income
- $53,812
- Rent vs Own
- Severe rent burden
- 1816.0
Population outlook (New Castle County) Hauer SSP2
- Today (2025)
- 594,686 people
- By 2030
- 609,164 · +2.4%
- By 2040
- 632,154 · +6.3%
- By 2050
- 649,068 · +9.1%
- By 2075
- 687,771 · +15.7%
- By 2100
- 694,961 · +16.9%
Race, ethnicity, and origin ACS 2023
- Neighborhood character
- Predominantly Black (68%)
- Race & ethnicity
- Black 68% White 20% Hispanic / Latino 7% Two or more races 5%
- Hispanic origin (detail)
- Puerto Rican 4%
- Common ancestry
- Slovak 1% Romanian 1% Italian 1%
- Foreign-born
- 11% · Canada, Jamaica, China
- Languages at home
- 92% English-only · Spanish 4% Arabic 0%
Political lean MEDSL · New Castle
- 2024 margin
- Solid D (+32.6) · D 65.5% · R 32.9% · Other 1.6%
- 2008→2024 swing
- -8.1pp toward R · 2008: 40.6pp · 2024: 32.6pp
- All cycles
- 2024: D+32.6 2020: D+37.1 2016: D+29.6 2012: D+34.1 2008: D+40.6
Not yet ingested
- Civics
- —
Market trends
- HPI YoY
- ▼ -296.47%
- Current HPI
- 225.6613
- Rent YoY
- ▲ 5.72%
- Metro
- Philadelphia-Camden-Wilmington, PA-NJ-DE-MD
- State GDP YoY
- —
- F500 in state
- 0
Price history
+428.3% since first listed18 events — show timeline
- 2026-05-31 Coming Soon $184,900 BRIGHT MLS
- 2020-02-19 Sold (Public Records) $124,000 Public Records
- 2020-02-12 Sold (MLS) $124,000 BRIGHT MLS
- 2020-01-31 Pending — BRIGHT MLS
- 2020-01-03 Contingent — BRIGHT MLS
- 2019-12-16 Price Changed $129,999 BRIGHT MLS
- 2019-12-05 Listed $147,777 BRIGHT MLS
- 2019-08-09 Sold (MLS) $35,030 BRIGHT MLS
- 2019-07-26 Pending — BRIGHT MLS
- 2019-06-12 Listed $59,900 BRIGHT MLS
- 2008-08-29 Listing Removed — BRIGHT MLS
- 2008-07-12 Listed $129,900 BRIGHT MLS
- 2008-04-10 Sold (Public Records) $62,000 Public Records
- 2007-07-31 Listing Removed — BRIGHT MLS
- 2007-05-03 Listed $82,900 BRIGHT MLS
- 2007-04-16 Listing Removed — BRIGHT MLS
- 2006-04-16 Listed $86,900 BRIGHT MLS
- 1983-12-01 Sold (Public Records) $35,000 Public Records
Property tax history
+2.2%/yrLatest (2024): $1,098 · +10.2% YoY. Source: county tax records.
Cash-flow waterfall
monthlySold comps — $/sqft
last 12 mo · ≤1 miLoading sold comps…