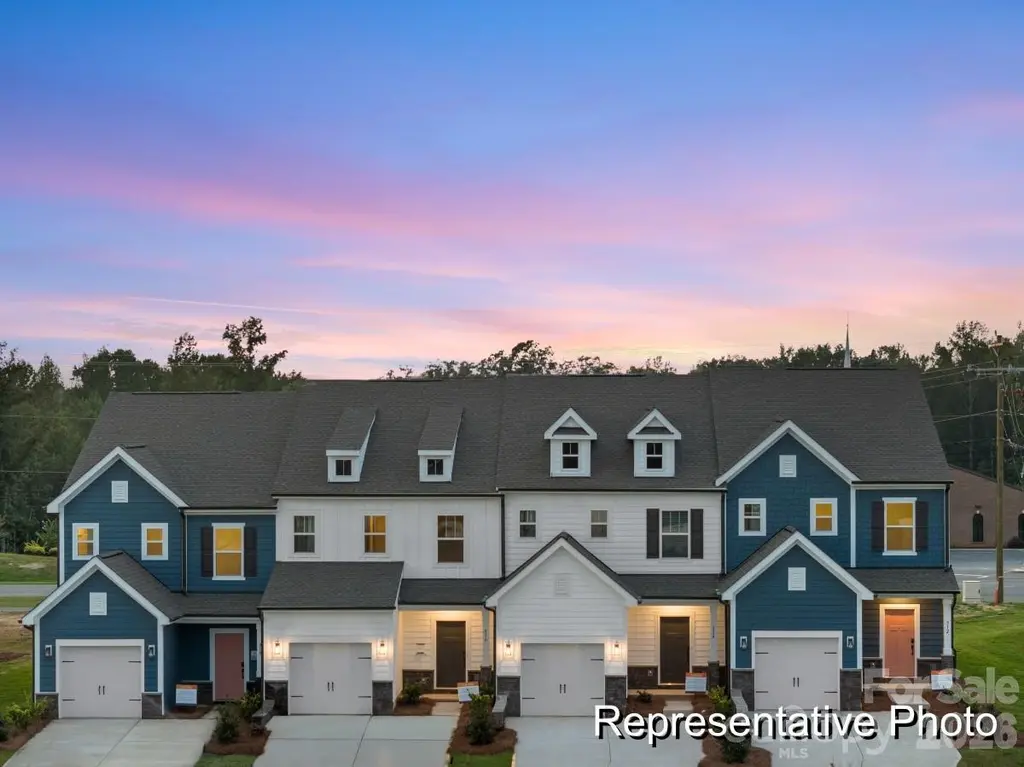
325 Drawbar Dr #98 · Clover, SC
Flood risk No data
- FEMA flood zone
- —
- Chance of flooding over 30 yrs
- —
- Est. flood insurance / yr
- —
Fire risk No data
- Est. fire insurance / yr
- —
Heat risk No data
- Hot days now (above threshold)
- —
- Hot days in 30 yrs
- —
Wind risk No data
- Chance of severe wind over 30 yrs
- —
Air-quality risk No data
- Unhealthy air days now
- —
- Unhealthy air days in 30 yrs
- —
Risk factors via First Street. Map © Google.
Why this score? — see what drove the D grade
The composite is a weighted blend of 9 inputs, each scored 0–100. Each bar is that input's sub-score; the figure is the points it added to the 100-point composite (weight × sub-score).
- Cash flow +10.6/30.0
- ARV discount +9.1/15.0
- Schools +5.4/10.0
- 1% rule +4.1/10.0
- Condition / age +4.0/5.0
- Livability +3.5/5.0
- DSCR +3.1/10.0
- Rent growth +2.7/5.0
- Appreciation +0.0/10.0
$259,900
🖨 Deal sheet (PDF) 📄 Offer letter ✓ Due diligence
Listing remarks
The Longfield offers 3 bedrooms, 2.5 bathrooms, and 1 car garage with a 2-car wide driveway. Enjoy the benefits of landscaping services included, so you can spend more time doing what you love! This beautifully designed townhome features an open main floor layout with a well-appointed kitchen, dining area, and inviting great room. The kitchen is a standout with quartz countertops, soft closed cabinets, elegant pendants, USB outlet, sleek stainless steel appliances, and stylish painted cabinetry that add a modern touch to your cooking space. Elegant laminate floors are included in the entire main living area, not to mention a modern ceiling fan and dimmer in the great room. Located in the de
Key facts
- Modern ceiling fan
- $200 HOA
- Garage
Tags
Neighborhood map
What this means for you Summary
Snapshot
- This is a 3-bed/2.5-bath townhouse listed at $260k. Condition is rated good.
Deal economics
- At list price, monthly cash flow is $-129 ($-2k/yr) — negative.
- To cash-flow at today's rent, offer at most $241k (7.2% below list).
- To meet the 1% rule (rent ≥ 1% of price), the offer needs to be $236k (9.1% below list).
- Recommended offer: $236k (9.1% below list) — sets the bar for 1% rule.
- Cap rate 5.7% vs local median 4.2% in Clover — top-decile yield for the area; either an underpriced asset or a hidden risk that comps aren't pricing in. Stress-test before assuming the spread holds.
Location & tenants
- Location reads 70/100 on livability (#63 in SC) — a middle-class / working-renter tenant base. Strengths: cost of living A+, housing A+, crime A; Watch: health & safety D+, employment D, amenities F.
- York 02 (rural): math 61% / reading 63% proficiency, ranked #2 of 80 in SC (top 2%) — acceptable for families but not a draw, mixed tenant base, ~2y average lease.
- Zoned schools: Kinard Elementary (math 47% / reading 42%, grade F, #226 of 597 statewide, top 40%, 441 students, 61% FRL); Clover Middle (math 44% / reading 49%, grade D+, #44 of 229 statewide, top 19%, 988 students, 52% FRL); Clover High (math 86% / reading 94%, grade A+, #4 of 196 statewide, top 2%, 2,685 students, 35% FRL) — zoned schools average 49% FRL vs 26% district-wide (24 pts higher); higher-poverty schools than district average — tighter screening recommended.
- Market conditions: Rents flat; 359 active listings in the ZIP; 7 comparable units currently listed for rent nearby; rentals at typical pace (median 18d on market — plan ~3-4 weeks tenant-placement turnaround); solid renter incomes; 2,550 units permitted in York County in 2024 (350 in 5+ unit buildings).
Forward outlook
- Local home prices are declining (-3.0%/yr); year-one equity from $2k of loan paydown is wiped out by about $8k of value loss. Plan a longer hold.
- York County population projected at +44% by 2050 — long-run rental-demand tailwind backs the buy-and-hold thesis.
Negotiation context
- It's been on market 21 days — a 2% lower offer ($256k) is reasonable based on typical stale-listing flexibility.
Questions for the listing agent
- What do current leases actually rent for vs. the listed asking? Can we see a recent rent roll and the last 12 months of T-12 income?
- What does the HOA fee cover, when was the last increase, and are there any pending special assessments or reserve-fund shortfalls?
- Is there a deadline driving the sale (1031 exchange, divorce, estate, relocation)? That informs how much negotiation room exists.
- The area grade is low — what's the realistic commute time and amenity access for the typical tenant pool here? Any planned neighborhood developments (good or bad) we should know about?
- What's the average days-on-market for RENTAL listings here right now (not sales)? A rising rental-DOM trend means longer vacancies and softer asking-rent achievability than the comps imply.
- What's the recent tenant-quality profile in this submarket — average credit score on applications, eviction rate, late-payment / NSF rate, and stable-employment percentage? A property-management company in the area should have these aggregated.
- How much new for-sale + rental construction is in the pipeline within 1–3 miles? Heavy new supply typically softens prices + rents 12–24 months out; constrained supply supports both.
Investment metrics
- 1% rule
- 0.91% ✗
- Cap rate
- 5.70%
- Cash-on-cash
- -2.12%
- DSCR
- 0.91
- GRM
- 9.2
CMA / ARV
- ARV (on-the-fly)
- $269,586
- Comps found
- 12
Show comp detail 12 sales within ~0.75 mi
| Address | Dist | Beds/Ba | Sqft | Sold | Price | $/sf | Match |
|---|---|---|---|---|---|---|---|
| 325 Drawbar Dr #98 | 0.00mi | 3/2.5 | 1,762 (0%) | 0mo | $259,900 | $148 | 100 |
| 321 Drawbar Dr #96 | 0.01mi | 3/2.5 | 1,762 (0%) | 1mo | $259,900 | $148 | 98 |
| 311 Drawbar Dr | 0.03mi | 3/2.5 | 1,762 (0%) | 1mo | $271,900 | $154 | 98 |
| 397 Drawbar Dr #128 | 0.15mi | 3/2.5 | 1,762 (0%) | 2mo | $249,900 | $142 | 91 |
| 393 Drawbar Dr #126 | 0.14mi | 3/2.5 | 1,762 (0%) | 3mo | $269,900 | $153 | 91 |
| 420 Drawbar Dr #53 | 0.18mi | 3/2.5 | 1,762 (0%) | 2mo | $249,900 | $142 | 90 |
| 571 Station St #68 | 0.10mi | 3/2.5 | 1,762 (0%) | 7mo | $267,900 | $152 | 89 |
| 587 Station St #61 | 0.13mi | 3/2.5 | 1,762 (0%) | 7mo | $274,900 | $156 | 88 |
| 583 Station St #63 | 0.13mi | 3/2.5 | 1,762 (0%) | 8mo | $274,900 | $156 | 88 |
| 589 Station St #60 | 0.14mi | 3/2.5 | 1,762 (0%) | 8mo | $270,000 | $153 | 86 |
| 426 Drawbar Dr #50 | 0.18mi | 3/2.5 | 1,762 (0%) | 6mo | $274,253 | $156 | 86 |
| 622 Station St #48 | 0.21mi | 3/2.5 | 1,762 (0%) | 10mo | $271,146 | $154 | 82 |
Match score weights: distance 35% · size 25% · config 20% · recency 20%. Top-matched comps best support the ARV.
Projected returns pro-forma
-3.0% appreciation · 0.88% rent growth · sell at horizon
- IRR
- -22.4%
- Equity multiple
- 0.24×
- Total profit
- $-55,095
- Equity at exit
- $38,752
- IRR
- -23.8%
- Equity multiple
- -0.06×
- Total profit
- $-77,310
- Equity at exit
- $22,471
Cash invested: $72,772 (down + closing). Projections, not guarantees.
Landlord ↔ Tenant lean methodology
- Overall (STATE)
- 90 Strongly Landlord-Friendly
- State South Carolina
- 90 Strongly Landlord-Friendly · R+6
- County
- — inherits STATE
- City
- — inherits STATE
ZIP-level market 29710
- Rents YoY
- 0.9%
- Active inventory
- 359
- Price-to-rent
- 9.2×
Monthly cashflow live
- Estimated rent
- $2,364 high interval (Pro) →
- Mortgage (P&I)
- −$1,363
- Tax est. 1.5%
- −$325 /mo · $3,898/yr
- Insurance
- −$108
- HOA
- −$200
- Vacancy / Maint / Mgmt
- −$496
- Net cashflow
- $-129
Break-even live
Sensitivity live
| Price | -10% $51 | -5% $-39 | +0% $-129 | +5% $-219 | +10% $-308 |
|---|---|---|---|---|---|
| Rent | -10% $-315 | -5% $-222 | +0% $-129 | +5% $-35 | +10% $58 |
| Rate | -1.0pp $2 | -0.5pp $-63 | base $-129 | +0.5pp $-196 | +1.0pp $-265 |
UW: 25.0% down · 7.5% · 30yr · 1.5% tax · 5.0% vac · 8.0% maint · 8.0% mgmt
Financing live
Cash to close
- Down payment
- $64,975
- Closing costs
- $7,797
- Reserves months
- —
- Total cash needed
- —
Loan-product check · same deal, 3 products live
Conventional
25% down · 7.5% · 30yr
- Down + closing
- —
- Monthly P&I
- —
- Monthly cashflow
- —
- DSCR
- —
- Eligible?
- —
Personal DTI + credit; lowest rate.
DSCR
20% down · 8.5% · 30yr
- Down + closing
- —
- Monthly P&I
- —
- Monthly cashflow
- —
- DSCR
- —
- Eligible?
- —
No personal income docs; deal must DSCR.
Hard money
10% down · 12.0% · 12mo
- Down + closing
- —
- Monthly P&I
- —
- Monthly cashflow
- —
- DSCR
- —
- Eligible?
- —
Short-term bridge; refi at stabilization.
Rent comps 7 comps
| Address | Beds | Baths | Sqft | Rent | $/sqft | DOM | Units | Dist |
|---|---|---|---|---|---|---|---|---|
| 328 Drawbar Dr Clover, SC | 3.0 | 2.5 | 1704 | $2,200 | $1.29 | 18d | 1 | 0.04mi |
| 328 Drawbar Dr Clover, SC | 3.0 | 2.5 | 1704 | $2,200 | $1.29 | 19d | 1 | 0.04mi |
| 3894 Shasta Cir Clover, SC | 3.0 | 2.5 | 2417 | $2,500 | $1.03 | 25d | 1 | 0.09mi |
| 6079 Shamrock Green Dr Clover, SC | 3.0 | 2.5 | 2169 | $2,295 | $1.06 | 25d | 1 | 0.11mi |
| 6056 Shamrock Green Dr Clover, SC | 3.0 | 2.5 | 1591 | $2,300 | $1.45 | 4d | 1 | 0.16mi |
| 316 Zion Church Rd Clover, SC | 3.0 | 2.0 | 1500 | $2,295 | $1.53 | 3d | 1 | 1.18mi |
| 294 Zion Church Rd Clover, SC | 3.0 | 2.0 | 1596 | $2,295 | $1.44 | 3d | 1 | 1.22mi |
HOA detail
- Monthly dues
- $200 · $2,400/yr
- Likely covers
- landscaping
Listing history 3 events
-
2026-04-13status Pending
-
2026-04-13price $259,900
-
2026-03-23$239,900 Active
ⓘ Source: listings_history table (triggers on properties + properties_extension) + one-shot
backfill from property_details.listing_events for pre-trigger history.
Nearby sold comps map
Loading sold comps map…
Walkable amenities ~0.75 mi
Loading nearby amenities…
Taxation est. · year 1
- Rental income
- $28,365
- − Mortgage interest
- −$14,558
- − Property taxes
- −$3,898
- − Insurance
- −$1,300
- − Repairs & maintenance
- −$2,269
- − Management
- −$2,269
- − HOA
- −$2,400
- − Depreciation
- −$7,561
- Taxable loss
- −$5,891
- Est. tax savings @ 24.0%
- +$1,414
- After-tax cash flow
- $-131/yr
For passive investors: Depreciation is non-cash, so a rental often shows a tax loss while cash-flowing — sheltering income. Rental losses are passive: they offset passive income freely, and up to $25,000/yr can offset ordinary (W-2) income if you actively participate and your MAGI is under $100k (phasing out to $0 by $150k); unused losses carry forward. On sale, claimed depreciation is recaptured at up to 25%, and gains may owe capital-gains tax (a 1031 exchange can defer both). Figures are a year-1 estimate at your 24.0% rate — not tax advice; consult a CPA.
Condition & rehab AI · 3 photos
This townhome is in good condition with a good condition score of 80. It has a cosmetic rehab level and requires minimal repairs and maintenance. The highest-ROI updates would be landscaping and interior paint touch-up to enhance its resale and rental value.
Value-add opportunities
- Both Landscaping — Enhances curb appeal and property value
- Resale Interior paint touch-up — Fresh paint can make a home look more inviting
Renovation cost estimate screening
Value-add ROI direction
- Both Landscaping — Enhances curb appeal and property value ↑
- Resale Interior paint touch-up — Fresh paint can make a home look more inviting ↑
ⓘ Cost ranges are severity-bucket heuristics (US national rule-of-thumb). Get contractor quotes + a written scope before underwriting a rehab budget.
Schools (NCES district)
- District
- York 02
- NCES district ID
- 4503840
- Math proficiency
- 61% ▼ -4.00%
- Reading proficiency
- 63% ▲ 3.00%
- Median HH income
- $60,598
- Composite
- 53.74/100
- National rank
- #1421
- State rank
- #2 of 80 in SC
Livability — Clover
- Score
- 70/100
- State rank
- #63
- US rank
- #7672
Category grades
Schools grade is shown separately in the Schools card above.
Census & demographics
- Census place
- Clover, SC
- County
- York County · 281,758 people
- City population
- 40,595
- Metro
- Charlotte-Concord-Gastonia, NC-SC
- Population (ZIP)
- 40,595
- Household income
- $96,563
- Rent vs Own
- Severe rent burden
- 569.0
Population outlook (York County) Hauer SSP2
- Today (2025)
- 307,757 people
- By 2030
- 335,979 · +9.2%
- By 2040
- 391,378 · +27.2%
- By 2050
- 443,234 · +44.0%
- By 2075
- 557,102 · +81.0%
- By 2100
- 625,837 · +103.4%
Race, ethnicity, and origin ACS 2023
- Neighborhood character
- Predominantly White (77%)
- Race & ethnicity
- White 77% Black 10% Hispanic / Latino 8% Two or more races 7%
- Hispanic origin (detail)
- Mexican 2% Cuban 1%
- Common ancestry
- Serbian 4% Slovak 3% Romanian 2%
- Foreign-born
- 4% · Canada, Jamaica
- Languages at home
- 94% English-only · Spanish 4% Other Indo-European 1%
Political lean MEDSL · York
- 2024 margin
- R (+19.1) · D 39.7% · R 58.8% · Other 1.5%
- 2008→2024 swing
- -1.4pp toward R · 2008: -17.7pp · 2024: -19.1pp
- All cycles
- 2024: R+19.1 2020: R+16.5 2016: R+22.1 2012: R+20.5 2008: R+17.7
Not yet ingested
- Civics
- —
Market trends
- HPI YoY
- ▼ -194.83%
- Current HPI
- 252.3011
- Rent YoY
- ▲ 0.88%
- Metro
- Charlotte-Concord-Gastonia, NC-SC
- State GDP YoY
- ▲ 4.51%
- F500 in state
- 2
Industry mix (Fortune 500 HQ in SC)
| Industry | F500 HQs | Revenue |
|---|---|---|
| Packaging | 1 | $7B |
|
||
Price history
+8.3% since first listed3 events — show timeline
- 2026-04-13 Pending — CANOPYMLS as Distributed by MLS Grid
- 2026-04-13 Price Changed $259,900 CANOPYMLS as Distributed by MLS Grid
- 2026-03-23 Listed $239,900 CANOPYMLS as Distributed by MLS Grid
Cash-flow waterfall
monthlySold comps — $/sqft
last 12 mo · ≤1 miLoading sold comps…