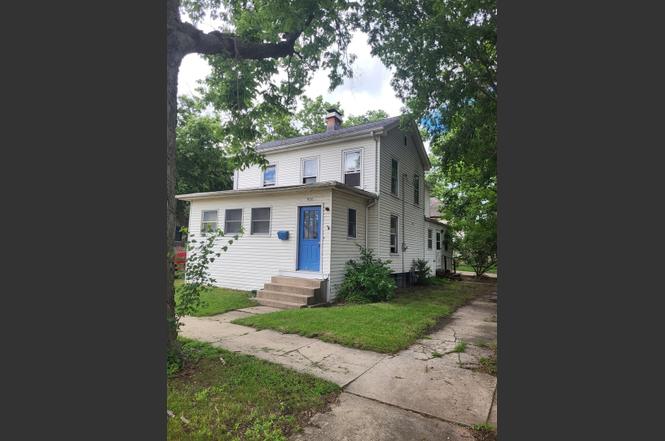
900 W Jackson St · Ottawa, IL
Flood risk 6/10 · Moderate
- FEMA flood zone
- X (unshaded)
- Chance of flooding over 30 yrs
- 0.75%
- Est. flood insurance / yr
- $473 – $860
Fire risk 4/10 · Minor
- Est. fire insurance / yr
- $804 – $1,492
Heat risk 3/10 · Minor
- Hot days now (above 102°F)
- 7 days/yr
- Hot days in 30 yrs
- 17 days/yr
Wind risk 2/10 · Minimal
- Chance of severe wind over 30 yrs
- 1.0%
Air-quality risk 2/10 · Minimal
- Unhealthy air days now
- 1 days/yr
- Unhealthy air days in 30 yrs
- 2 days/yr
Risk factors via First Street. Map © Google.
Why this score? — see what drove the B grade
The composite is a weighted blend of 9 inputs, each scored 0–100. Each bar is that input's sub-score; the figure is the points it added to the 100-point composite (weight × sub-score).
- Cash flow +26.0/30.0
- ARV discount +15.0/15.0
- 1% rule +9.5/10.0
- DSCR +8.7/10.0
- Livability +3.9/5.0
- Schools +2.7/10.0
- Rent growth +2.5/5.0
- Condition / age +2.5/5.0
- Appreciation +0.0/10.0
$139,900
🖨 Deal sheet (PDF) 📄 Offer letter ✓ Due diligence
Listing remarks MLS
Large family home with lots of character.
Key facts
- Den off living room
- Corner-lot home
- Formal dining room
Tags
Property features AI
Finance
- HOA & community: No master association fees required; Community features include park access, curbs, sidewalks, street lights, and paved streets
Exterior
- Parking: No parking details provided
- Utilities: Public water; Public sewer; Electric with circuit breakers
- Home design: Detached single-family home; 2 stories; Over 100 years old; Corner lot; Less than 0.25 acre; Lot dimensions approximately 58 x 60; Fee simple ownership; Interstate access nearby
- Construction: Aluminum siding and plaster exterior; Asphalt roof; Block and stone foundation; Built before 1978
- Exterior features: Deck; Enclosed porch (5 x 22, vinyl)
Interior
- Kitchen: Galley kitchen (14 x 10, vinyl); Range
- Bedrooms: 5 bedrooms total; Main-level bedroom (8 x 15, carpet); Second-level master bedroom (12 x 23, carpet); Second-level bedroom (11 x 11, hardwood); Second-level bedroom (14 x 11, hardwood); Second-level bedroom (12 x 15, hardwood)
- Flooring: Hardwood and wood flooring throughout; Carpet in some bedrooms; Vinyl in kitchen, dining room, family room, and enclosed porch
- Bathrooms: 1 full bathroom; 1 half bathroom
- Heating & cooling: Radiator heating; Ceiling fan(s)
- Interior features: First-floor bedroom; Separate dining room; 10 total rooms
- Laundry & utility: Main-level laundry (5 x 10, hardwood); Gas water heater
Neighborhood map
What this means for you Summary
Snapshot
- This is a 5-bed/1.5-bath single-family listed at $140k.
Deal economics
- At list price, monthly cash flow is $347 ($4k/yr) — positive.
- The deal already cash-flows at list — no discount required.
- Meets the 1% rule at list price ($2k rent vs $140k).
- Cap rate 9.3% vs local median 3.1% in Ottawa — top-decile yield for the area; either an underpriced asset or a hidden risk that comps aren't pricing in. Stress-test before assuming the spread holds.
Location & tenants
- Location reads 77/100 on livability (#172 in IL, #3,175 nationally) — a middle-class / working-renter tenant base. Strengths: cost of living A+, health & safety A+, housing A; Watch: employment C-, amenities D, commute F.
- Ottawa Twp Hsd 140 (town): math 25% / reading 30% proficiency, ranked #545 of 919 in IL (top 59%) — low school quality limits family demand, transient renter base, plan for 1-2y turnover.
- Zoned schools: Ottawa Township High School (math 17% / reading 27%, grade F, #319 of 693 statewide, top 50%, 1,261 students, 0% FRL).
- Market conditions: 208 active listings in the ZIP; solid renter incomes; 82 units permitted in LaSalle County in 2024 (0 in 5+ unit buildings).
- This rent runs 31% of the median local income ($78k/yr) — at the standard rent-burdened threshold; future hikes will face affordability resistance.
Forward outlook
- Local home prices are declining (-3.0%/yr); year-one equity from $967 of loan paydown is wiped out by about $4k of value loss. Plan a longer hold.
- LaSalle County population projected at -16% by 2050 — secular population decline; favor cash flow + early exit over multi-decade hold.
- At projected returns (-3.0% appreciation + 3.0% rent growth), your $39k cash investment doubles in ~10 years — after that, you're playing with house money.
Negotiation context
- Only 3 days on market — expect competitive offers; lowballing is unlikely to land.
- 2 sale attempts since 18y ago with the ask held roughly flat each time — persistent listings suggest the price (not the market) is what's stuck; bring a comps-based counter.
- Current owner paid $88k; list at $140k implies a 59% gain — meaningful room to come down on a strong offer.
Risks & watch-outs
- Watch-outs: property tax is 4.0% of price; built in 1911 — expect roof / HVAC / electrical / plumbing capex.
- Climate carrying-cost: major flood risk — expect insurance premiums to compound above CPI over the hold.
Questions for the listing agent
- Built in 1911 — when were the roof, HVAC, electrical panel, plumbing, and water heater last replaced?
- Property tax is high relative to price — has the assessment been appealed recently, and will the sale trigger a re-assessment?
- Is there a deadline driving the sale (1031 exchange, divorce, estate, relocation)? That informs how much negotiation room exists.
- Schools are D-rated, which usually means shorter tenancies and higher turnover. Who's the typical renter profile here, and what's been the actual vacancy rate?
- What's the average days-on-market for RENTAL listings here right now (not sales)? A rising rental-DOM trend means longer vacancies and softer asking-rent achievability than the comps imply.
- What's the recent tenant-quality profile in this submarket — average credit score on applications, eviction rate, late-payment / NSF rate, and stable-employment percentage? A property-management company in the area should have these aggregated.
- How much new for-sale + rental construction is in the pipeline within 1–3 miles? Heavy new supply typically softens prices + rents 12–24 months out; constrained supply supports both.
Investment metrics
- 1% rule
- 1.45% ✓
- Cap rate
- 9.27%
- Cash-on-cash
- 10.62%
- DSCR
- 1.47
- GRM
- 5.7
CMA / ARV
- ARV (on-the-fly)
- $239,652
- Comps found
- 9
Show comp detail 9 sales within ~0.75 mi
| Address | Dist | Beds/Ba | Sqft | Sold | Price | $/sf | Match |
|---|---|---|---|---|---|---|---|
| 906 W Madison St | 0.14mi | 4/1.5 (-1) | 2,052 (+8%) | 9mo | $212,000 | $103 | 68 |
| 802 W Main St | 0.23mi | 4/2.0 (-1) | 1,965 (+3%) | 15mo | $246,900 | $126 | 64 |
| 407 Clay St | 0.34mi | 4/1.5 (-1) | 1,974 (+4%) | 12mo | $215,000 | $109 | 63 |
| 226 Clay St | 0.46mi | 4/2.0 (-1) | 2,064 (+8%) | 0mo | $260,000 | $126 | 57 |
| 1107 W Lafayette St | 0.14mi | 4/1.5 (-1) | 1,616 (-15%) | 10mo | $213,500 | $132 | 55 |
| 1408 W Jackson St | 0.39mi | 5/2.0 | 1,727 (-9%) | 15mo | $235,000 | $136 | 52 |
| 1115 Illinois Ave | 0.38mi | 4/1.5 (-1) | 2,018 (+6%) | 19mo | $110,000 | $55 | 52 |
| 1527 Pine St | 0.46mi | 4/2.0 (-1) | 2,088 (+10%) | 13mo | $225,000 | $108 | 44 |
| 1818 Poplar St | 0.72mi | 4/2.0 (-1) | 1,662 (-13%) | 18mo | $229,900 | $138 | 24 |
Match score weights: distance 35% · size 25% · config 20% · recency 20%. Top-matched comps best support the ARV.
Projected returns pro-forma
-3.0% appreciation · 3.0% rent growth · sell at horizon
- IRR
- -0.3%
- Equity multiple
- 0.99×
- Total profit
- $-389
- Equity at exit
- $20,860
- IRR
- 9.5%
- Equity multiple
- 1.74×
- Total profit
- $28,931
- Equity at exit
- $12,096
Cash invested: $39,172 (down + closing). Projections, not guarantees.
Landlord ↔ Tenant lean methodology
- Overall (STATE)
- 43 Moderately Tenant-Leaning
- State Illinois
- 43 Moderately Tenant-Leaning · D+7
- County
- — inherits STATE
- City
- — inherits STATE
ZIP-level market 61350
- Home prices YoY
- -31.5%
- Active inventory
- 208
- Price-to-rent
- 5.7×
Monthly cashflow live
- Estimated rent
- $2,030 medium interval (Pro) →
- Mortgage (P&I)
- −$734
- Tax from tax record
- −$465 /mo · $5,584/yr
- Insurance
- −$58
- HOA
- −$0
- Vacancy / Maint / Mgmt
- −$426
- Net cashflow
- $347
Break-even live
Sensitivity live
| Price | -10% $426 | -5% $386 | +0% $347 | +5% $307 | +10% $267 |
|---|---|---|---|---|---|
| Rent | -10% $186 | -5% $266 | +0% $347 | +5% $427 | +10% $507 |
| Rate | -1.0pp $417 | -0.5pp $382 | base $347 | +0.5pp $310 | +1.0pp $273 |
UW: 25.0% down · 7.5% · 30yr · 1.5% tax · 5.0% vac · 8.0% maint · 8.0% mgmt
Financing live
Cash to close
- Down payment
- $34,975
- Closing costs
- $4,197
- Reserves months
- —
- Total cash needed
- —
Loan-product check · same deal, 3 products live
Conventional
25% down · 7.5% · 30yr
- Down + closing
- —
- Monthly P&I
- —
- Monthly cashflow
- —
- DSCR
- —
- Eligible?
- —
Personal DTI + credit; lowest rate.
DSCR
20% down · 8.5% · 30yr
- Down + closing
- —
- Monthly P&I
- —
- Monthly cashflow
- —
- DSCR
- —
- Eligible?
- —
No personal income docs; deal must DSCR.
Hard money
10% down · 12.0% · 12mo
- Down + closing
- —
- Monthly P&I
- —
- Monthly cashflow
- —
- DSCR
- —
- Eligible?
- —
Short-term bridge; refi at stabilization.
Listing history 3 events
-
2026-06-21days on market $139,900 Active 3 DOM
-
2026-06-19remarks 699-char remark
-
2026-06-19$139,900 Active 1 DOM
ⓘ Source: listings_history table (triggers on properties + properties_extension) + one-shot
backfill from property_details.listing_events for pre-trigger history.
Tax reassessment forecast IL · Partial reset (capped growth)
- Current annual tax
- $5,584 · $465/mo
- Projected year-2 tax
- $5,584 · $465/mo
- Expected delta
- $0/yr ($0/mo · 0.0%)
ⓘ Screening estimate from a state-policy table — verify with the county assessor before closing.
Climate risk First Street
- Flood 6/10 Major FEMA zone X (unshaded) · 75% chance over 30 yrs
- Wildfire 4/10 Moderate
- Heat 3/10 Moderate 7 d/yr ≥102°F today · 17 d/yr by 30 yrs out
- Wind 2/10 Low 100% chance of damaging wind over 30 yrs
- Air quality 2/10 Low 1 unhealthy d/yr today · 2 by 30 yrs out
Nearby sold comps map
Loading sold comps map…
Walkable amenities ~0.75 mi
Loading nearby amenities…
Taxation est. · year 1
- Rental income
- $24,362
- − Mortgage interest
- −$7,837
- − Property taxes
- −$5,584
- − Insurance
- −$700
- − Repairs & maintenance
- −$1,949
- − Management
- −$1,949
- − Depreciation
- −$4,070
- Taxable income
- $2,274
- Est. tax owed @ 24.0%
- −$546
- After-tax cash flow
- $3,613/yr
For passive investors: Depreciation is non-cash, so a rental often shows a tax loss while cash-flowing — sheltering income. Rental losses are passive: they offset passive income freely, and up to $25,000/yr can offset ordinary (W-2) income if you actively participate and your MAGI is under $100k (phasing out to $0 by $150k); unused losses carry forward. On sale, claimed depreciation is recaptured at up to 25%, and gains may owe capital-gains tax (a 1031 exchange can defer both). Figures are a year-1 estimate at your 24.0% rate — not tax advice; consult a CPA.
Schools (NCES district)
- District
- Ottawa Twp Hsd 140
- NCES district ID
- 1730330
- Math proficiency
- 25% ▼ -3.00%
- Reading proficiency
- 30% ▼ -4.00%
- Median HH income
- $47,828
- Composite
- 26.85/100
- National rank
- #12528
- State rank
- #545 of 919 in IL
Livability — Ottawa
- Score
- 77/100
- State rank
- #172
- US rank
- #3175
Category grades
Schools grade is shown separately in the Schools card above.
Census & demographics
- Census place
- Ottawa, IL
- County
- La Salle County · 41,676 people
- City population
- 23,713
- Metro
- Ottawa, IL
- Population (ZIP)
- 23,713
- Household income
- $77,921
- Rent vs Own
- Severe rent burden
- 628.0
Population outlook (LaSalle County) Hauer SSP2
- Today (2025)
- 107,080 people
- By 2030
- 104,196 · -2.7%
- By 2040
- 97,413 · -9.0%
- By 2050
- 90,294 · -15.7%
- By 2075
- 76,252 · -28.8%
- By 2100
- 61,339 · -42.7%
Race, ethnicity, and origin ACS 2023
- Neighborhood character
- Predominantly White (85%)
- Race & ethnicity
- White 85% Hispanic / Latino 9% Two or more races 4% Black 2%
- Hispanic origin (detail)
- Mexican 7%
- Common ancestry
- Romanian 6% Portuguese 5% Lithuanian 2%
- Foreign-born
- 2% · Canada
- Languages at home
- 95% English-only · Spanish 3%
Political lean MEDSL · LaSalle
- 2024 margin
- R (+18.5) · D 40.1% · R 58.6% · Other 1.3%
- 2008→2024 swing
- -29.6pp toward R · 2008: 11.1pp · 2024: -18.5pp
- All cycles
- 2024: R+18.5 2020: R+14.3 2016: R+14.4 2012: R+0.4 2008: D+11.1
Not yet ingested
- Civics
- —
Market trends
- HPI YoY
- ▼ -84.46%
- Current HPI
- 183.6833
- Rent YoY
- —
- Metro
- Ottawa, IL
- State GDP YoY
- ▲ 1.59%
- F500 in state
- 60
Industry mix (Fortune 500 HQ in IL)
| Industry | F500 HQs | Revenue |
|---|---|---|
| Insurance | 4 | $201B |
|
||
| Consumer Goods | 4 | $87B |
|
||
| Industrial Machinery | 3 | $64B |
|
||
| Healthcare | 2 | $55B |
|
||
| Retail / Pharmacy | 1 | $148B |
|
||
| Agriculture / Food | 1 | $86B |
|
||
Price history
+55.6% since first listed6 events — show timeline
- 2026-06-18 Listed $139,900 MRED as Distributed by MLS Grid
- 2009-02-03 Sold (Public Records) $88,000 Public Records
- 2009-01-30 Sold (MLS) $87,900 MRED as Distributed by MLS Grid
- 2009-01-23 Listing Removed — MRED as Distributed by MLS Grid
- 2009-01-06 Contingent — MRED as Distributed by MLS Grid
- 2008-11-06 Listed $89,900 MRED as Distributed by MLS Grid
Property tax history
+6.1%/yrLatest (2024): $5,584 · +9.3% YoY. Source: county tax records.
Cash-flow waterfall
monthlySold comps — $/sqft
last 12 mo · ≤1 miLoading sold comps…